
|
|||||
|
 | |
| |
| |
| |
| |
| |
|
Gene: SPNS1 |
Gene summary for SPNS1 |
| Gene information | Species | Human | Gene symbol | SPNS1 | Gene ID | 83985 |
| Gene name | sphingolipid transporter 1 (putative) | |
| Gene Alias | HSpin1 | |
| Cytomap | 16p11.2 | |
| Gene Type | protein-coding | GO ID | GO:0006810 | UniProtAcc | Q9H2V7 |
Top |
Malignant transformation analysis |
| Identification of the aberrant gene expression in precancerous and cancerous lesions by comparing the gene expression of stem-like cells in diseased tissues with normal stem cells |
| Entrez ID | Symbol | Replicates | Species | Organ | Tissue | Adj P-value | Log2FC | Malignancy |
| 83985 | SPNS1 | LZE2T | Human | Esophagus | ESCC | 2.18e-04 | 4.66e-01 | 0.082 |
| 83985 | SPNS1 | LZE4T | Human | Esophagus | ESCC | 6.19e-10 | 2.80e-01 | 0.0811 |
| 83985 | SPNS1 | LZE5T | Human | Esophagus | ESCC | 1.40e-06 | 3.36e-01 | 0.0514 |
| 83985 | SPNS1 | LZE7T | Human | Esophagus | ESCC | 4.33e-11 | 5.21e-01 | 0.0667 |
| 83985 | SPNS1 | LZE8T | Human | Esophagus | ESCC | 1.35e-07 | 2.65e-01 | 0.067 |
| 83985 | SPNS1 | LZE20T | Human | Esophagus | ESCC | 1.30e-10 | 3.51e-01 | 0.0662 |
| 83985 | SPNS1 | LZE21D1 | Human | Esophagus | HGIN | 5.38e-03 | 3.94e-01 | 0.0632 |
| 83985 | SPNS1 | LZE22D1 | Human | Esophagus | HGIN | 8.03e-04 | 2.01e-01 | 0.0595 |
| 83985 | SPNS1 | LZE22T | Human | Esophagus | ESCC | 1.15e-08 | 5.38e-01 | 0.068 |
| 83985 | SPNS1 | LZE24T | Human | Esophagus | ESCC | 5.96e-45 | 1.12e+00 | 0.0596 |
| 83985 | SPNS1 | LZE21T | Human | Esophagus | ESCC | 1.37e-06 | 3.66e-01 | 0.0655 |
| 83985 | SPNS1 | LZE6T | Human | Esophagus | ESCC | 2.96e-03 | 1.56e-01 | 0.0845 |
| 83985 | SPNS1 | P1T-E | Human | Esophagus | ESCC | 1.23e-18 | 7.63e-01 | 0.0875 |
| 83985 | SPNS1 | P2T-E | Human | Esophagus | ESCC | 1.03e-89 | 1.26e+00 | 0.1177 |
| 83985 | SPNS1 | P4T-E | Human | Esophagus | ESCC | 9.78e-64 | 1.31e+00 | 0.1323 |
| 83985 | SPNS1 | P5T-E | Human | Esophagus | ESCC | 5.17e-27 | 4.46e-01 | 0.1327 |
| 83985 | SPNS1 | P8T-E | Human | Esophagus | ESCC | 6.89e-44 | 6.83e-01 | 0.0889 |
| 83985 | SPNS1 | P9T-E | Human | Esophagus | ESCC | 1.37e-15 | 3.26e-01 | 0.1131 |
| 83985 | SPNS1 | P10T-E | Human | Esophagus | ESCC | 1.35e-23 | 3.87e-01 | 0.116 |
| 83985 | SPNS1 | P11T-E | Human | Esophagus | ESCC | 2.64e-31 | 1.09e+00 | 0.1426 |
| Page: 1 2 3 4 5 6 7 |
| Tissue | Expression Dynamics | Abbreviation |
| Esophagus | 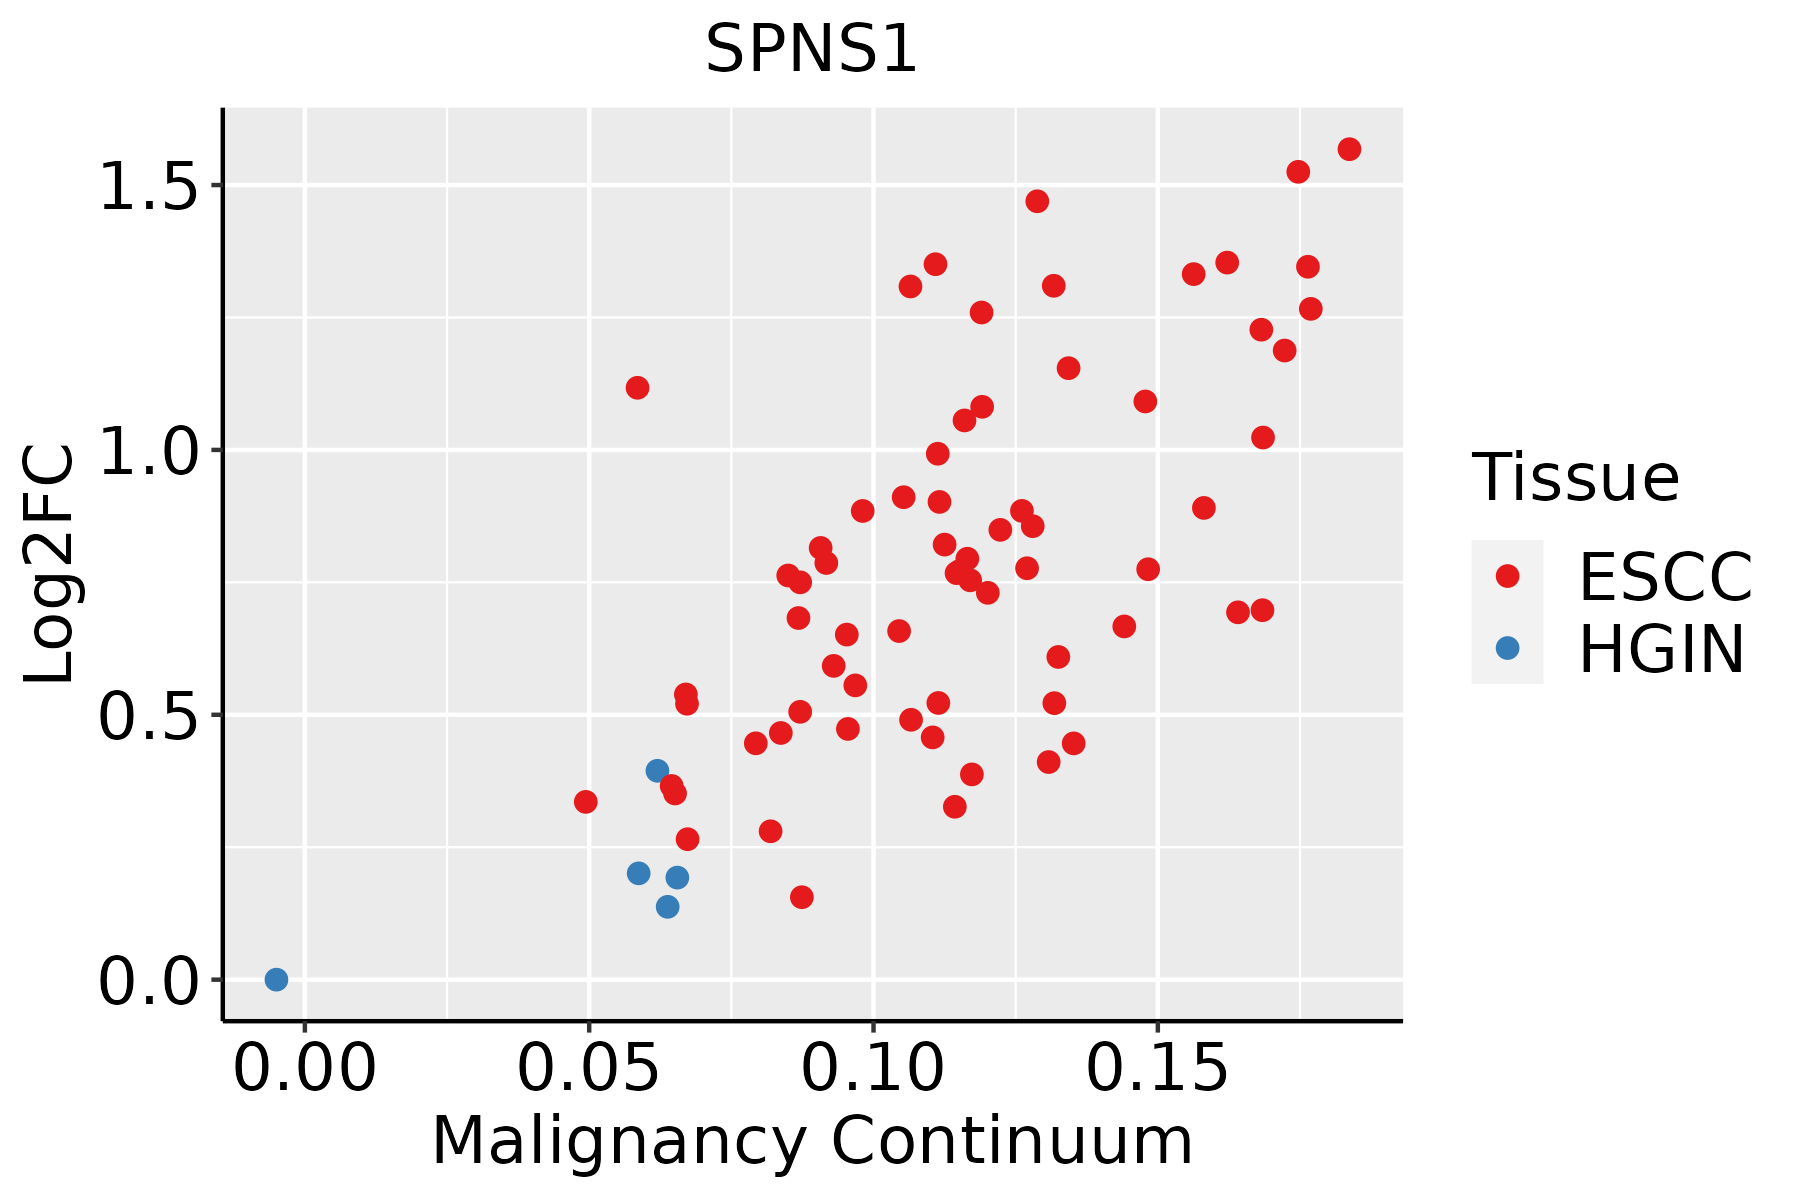 | ESCC: Esophageal squamous cell carcinoma |
| HGIN: High-grade intraepithelial neoplasias | ||
| LGIN: Low-grade intraepithelial neoplasias | ||
| Liver | 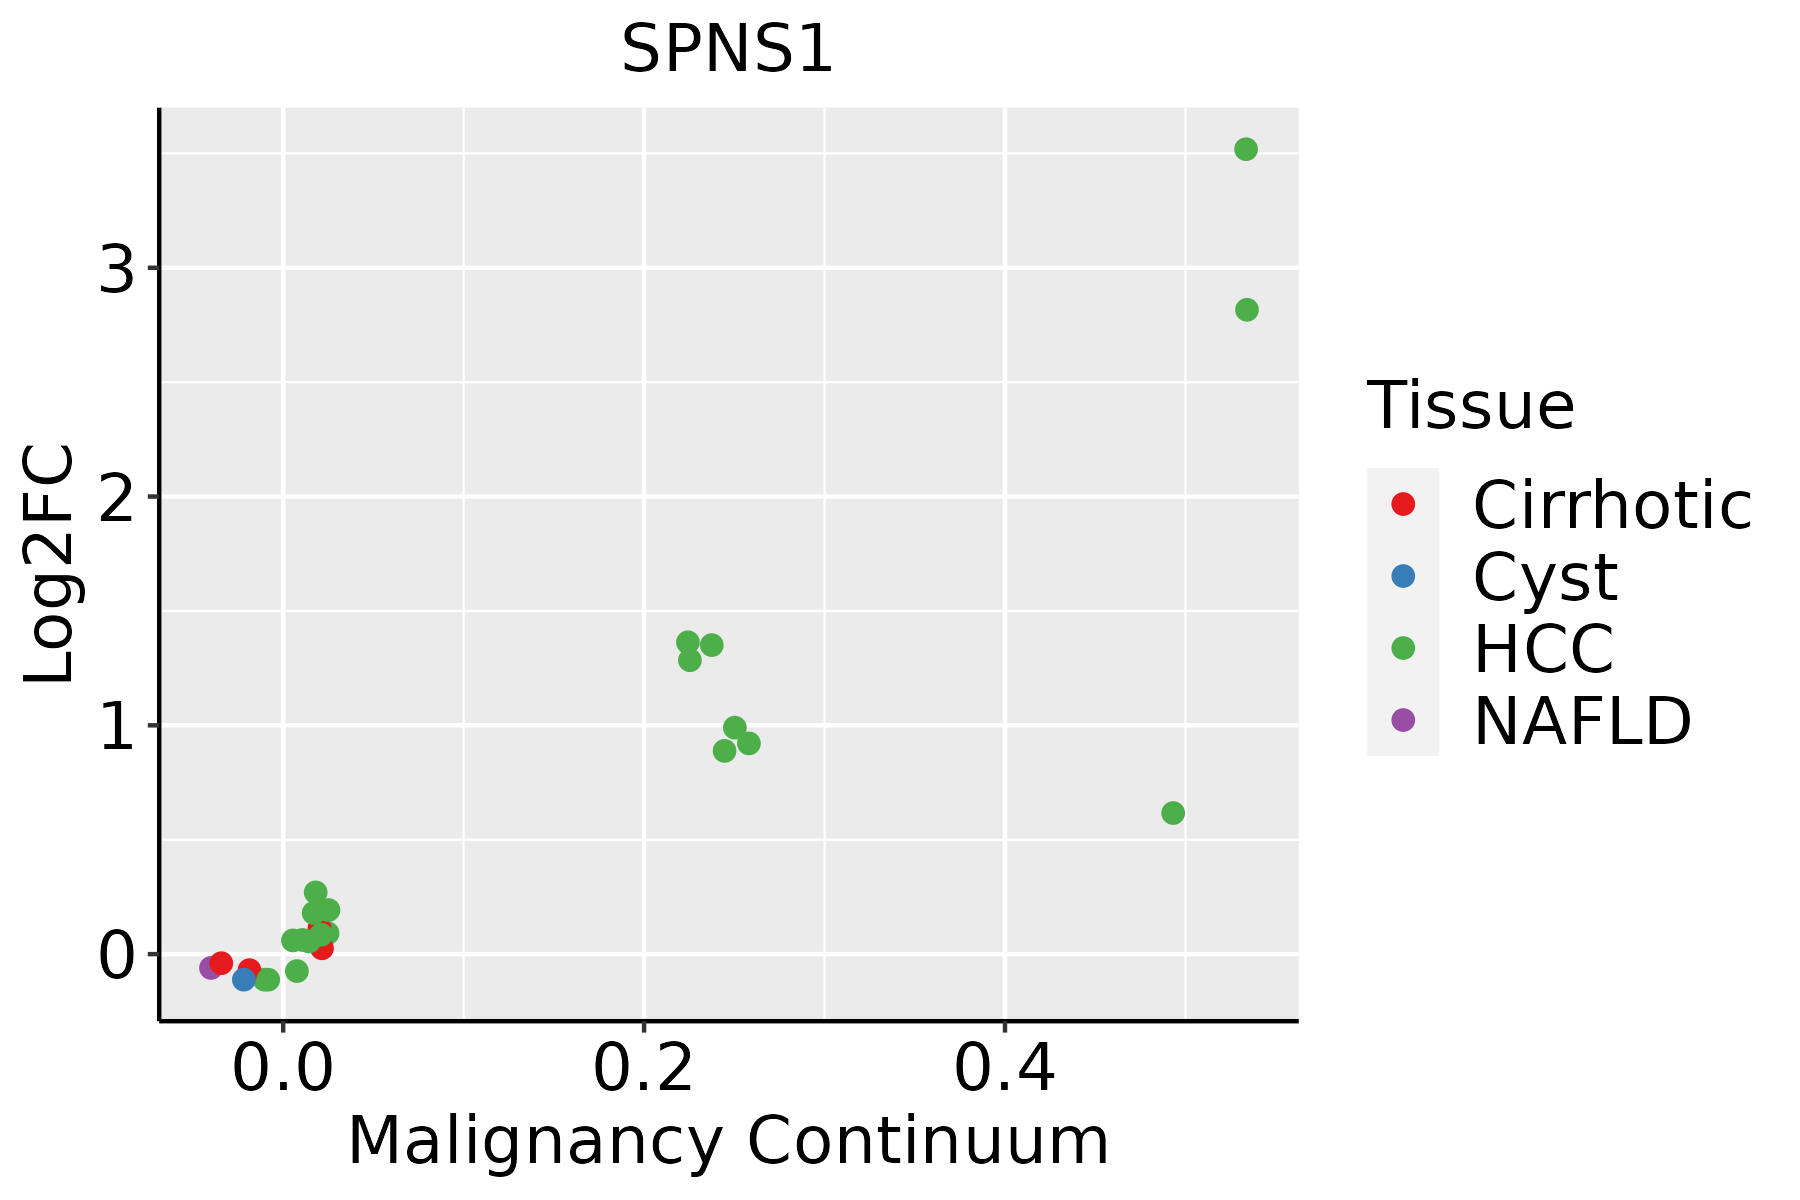 | HCC: Hepatocellular carcinoma |
| NAFLD: Non-alcoholic fatty liver disease | ||
| Oral Cavity |  | EOLP: Erosive Oral lichen planus |
| LP: leukoplakia | ||
| NEOLP: Non-erosive oral lichen planus | ||
| OSCC: Oral squamous cell carcinoma | ||
| Skin |  | AK: Actinic keratosis |
| cSCC: Cutaneous squamous cell carcinoma | ||
| SCCIS:squamous cell carcinoma in situ | ||
| Thyroid |  | ATC: Anaplastic thyroid cancer |
| HT: Hashimoto's thyroiditis | ||
| PTC: Papillary thyroid cancer |
| ∗log2FC in expression of this searched gene in stem-like cells from each diseased tissue sample relative to stem-like cells in normal samples in each tissue plotted against the malignancy continuum. Samples are colored based on if they are from different disease stage. |
Top |
Malignant transformation related pathway analysis |
| Find out the enriched GO biological processes and KEGG pathways involved in transition from healthy to precancer to cancer |
| Tissue | Disease Stage | Enriched GO biological Processes |
| Colorectum | AD |  |
| Colorectum | SER |  |
| Colorectum | MSS |  |
| Colorectum | MSI-H |  |
| Colorectum | FAP |  |
| ∗Top 15 enriched GO BP terms are showed in the bar plot of each disease state in each tissue. Each row represents a significant GO biological process which is colored according to the -log10(p.adjust). |
| Page: 1 2 3 4 5 6 7 8 9 |
| GO ID | Tissue | Disease Stage | Description | Gene Ratio | Bg Ratio | pvalue | p.adjust | Count |
| GO:001087611 | Liver | Cirrhotic | lipid localization | 147/4634 | 448/18723 | 6.24e-05 | 7.12e-04 | 147 |
| GO:000686911 | Liver | Cirrhotic | lipid transport | 128/4634 | 398/18723 | 4.54e-04 | 3.69e-03 | 128 |
| GO:001087621 | Liver | HCC | lipid localization | 228/7958 | 448/18723 | 1.80e-04 | 1.41e-03 | 228 |
| GO:000686921 | Liver | HCC | lipid transport | 198/7958 | 398/18723 | 1.92e-03 | 9.78e-03 | 198 |
| Page: 1 |
| Pathway ID | Tissue | Disease Stage | Description | Gene Ratio | Bg Ratio | pvalue | p.adjust | qvalue | Count |
| Page: 1 |
Top |
Cell-cell communication analysis |
| Identification of potential cell-cell interactions between two cell types and their ligand-receptor pairs for different disease states |
| Ligand | Receptor | LRpair | Pathway | Tissue | Disease Stage |
| Page: 1 |
Top |
Single-cell gene regulatory network inference analysis |
| Find out the significant the regulons (TFs) and the target genes of each regulon across cell types for different disease states |
| TF | Cell Type | Tissue | Disease Stage | Target Gene | RSS | Regulon Activity |
| ∗The dot plots of a searched regulon are shown for all cell subpopulations in each disease state of each tissue based on the regulon specific score inferred using pySCENIC and by calculating the average expression. |
| Page: 1 |
Top |
Somatic mutation of malignant transformation related genes |
| Annotation of somatic variants for genes involved in malignant transformation |
| Hugo Symbol | Variant Class | Variant Classification | dbSNP RS | HGVSc | HGVSp | HGVSp Short | SWISSPROT | BIOTYPE | SIFT | PolyPhen | Tumor Sample Barcode | Tissue | Histology | Sex | Age | Stage | Therapy Types | Drugs | Outcome |
| SPNS1 | SNV | Missense_Mutation | c.47C>G | p.Pro16Arg | p.P16R | Q9H2V7 | protein_coding | tolerated(0.52) | benign(0.026) | TCGA-A2-A0CU-01 | Breast | breast invasive carcinoma | Female | >=65 | I/II | Hormone Therapy | tamoxiphen | SD | |
| SPNS1 | SNV | Missense_Mutation | c.112N>A | p.Glu38Lys | p.E38K | Q9H2V7 | protein_coding | tolerated(0.71) | benign(0.001) | TCGA-AC-A23H-01 | Breast | breast invasive carcinoma | Female | >=65 | I/II | Unknown | Unknown | PD | |
| SPNS1 | SNV | Missense_Mutation | novel | c.919G>A | p.Glu307Lys | p.E307K | Q9H2V7 | protein_coding | tolerated(0.8) | benign(0.01) | TCGA-AN-A046-01 | Breast | breast invasive carcinoma | Female | >=65 | I/II | Unknown | Unknown | SD |
| SPNS1 | SNV | Missense_Mutation | novel | c.796N>T | p.Ala266Ser | p.A266S | Q9H2V7 | protein_coding | tolerated(0.5) | benign(0.034) | TCGA-BH-A0HQ-01 | Breast | breast invasive carcinoma | Female | <65 | I/II | Hormone Therapy | arimidex | SD |
| SPNS1 | SNV | Missense_Mutation | novel | c.796N>T | p.Ala266Ser | p.A266S | Q9H2V7 | protein_coding | tolerated(0.5) | benign(0.034) | TCGA-C8-A274-01 | Breast | breast invasive carcinoma | Female | <65 | I/II | Hormone Therapy | tamoxiphen | SD |
| SPNS1 | SNV | Missense_Mutation | novel | c.531N>A | p.Asp177Glu | p.D177E | Q9H2V7 | protein_coding | deleterious(0) | probably_damaging(0.956) | TCGA-LL-A6FP-01 | Breast | breast invasive carcinoma | Female | >=65 | I/II | Hormone Therapy | arimidex | SD |
| SPNS1 | deletion | Frame_Shift_Del | novel | c.127delG | p.Asp43ThrfsTer19 | p.D43Tfs*19 | Q9H2V7 | protein_coding | TCGA-EW-A2FV-01 | Breast | breast invasive carcinoma | Female | <65 | III/IV | Chemotherapy | docetaxel | SD | ||
| SPNS1 | SNV | Missense_Mutation | novel | c.878G>T | p.Trp293Leu | p.W293L | Q9H2V7 | protein_coding | deleterious(0.02) | probably_damaging(0.957) | TCGA-C5-A8YT-01 | Cervix | cervical & endocervical cancer | Female | <65 | I/II | Chemotherapy | cisplatin | PD |
| SPNS1 | SNV | Missense_Mutation | novel | c.1207N>A | p.Ala403Thr | p.A403T | Q9H2V7 | protein_coding | tolerated(0.18) | benign(0.241) | TCGA-EA-A3HS-01 | Cervix | cervical & endocervical cancer | Female | <65 | I/II | Unknown | Unknown | SD |
| SPNS1 | SNV | Missense_Mutation | rs766964284 | c.561N>A | p.Met187Ile | p.M187I | Q9H2V7 | protein_coding | deleterious(0) | possibly_damaging(0.449) | TCGA-EX-A1H6-01 | Cervix | cervical & endocervical cancer | Female | <65 | I/II | Unknown | Unknown | SD |
| Page: 1 2 3 4 5 6 |
Top |
Related drugs of malignant transformation related genes |
| Identification of chemicals and drugs interact with genes involved in malignant transfromation |
| (DGIdb 4.0) |
| Entrez ID | Symbol | Category | Interaction Types | Drug Claim Name | Drug Name | PMIDs |
| Page: 1 |

Copyright 2023-Present -The University of Texas Health Science Center at Houston |