
|
|||||
|
 | |
| |
| |
| |
| |
| |
|
Gene: SPN |
Gene summary for SPN |
| Gene information | Species | Human | Gene symbol | SPN | Gene ID | 6693 |
| Gene name | sialophorin | |
| Gene Alias | CD43 | |
| Cytomap | 16p11.2 | |
| Gene Type | protein-coding | GO ID | GO:0001775 | UniProtAcc | A0A024R629 |
Top |
Malignant transformation analysis |
| Identification of the aberrant gene expression in precancerous and cancerous lesions by comparing the gene expression of stem-like cells in diseased tissues with normal stem cells |
| Entrez ID | Symbol | Replicates | Species | Organ | Tissue | Adj P-value | Log2FC | Malignancy |
| 6693 | SPN | HCC1 | Human | Liver | HCC | 1.44e-10 | 1.53e+00 | 0.5336 |
| 6693 | SPN | HCC2 | Human | Liver | HCC | 8.86e-28 | 2.18e+00 | 0.5341 |
| 6693 | SPN | HCC5 | Human | Liver | HCC | 4.03e-14 | 1.63e+00 | 0.4932 |
| Page: 1 |
| Tissue | Expression Dynamics | Abbreviation |
| Liver | 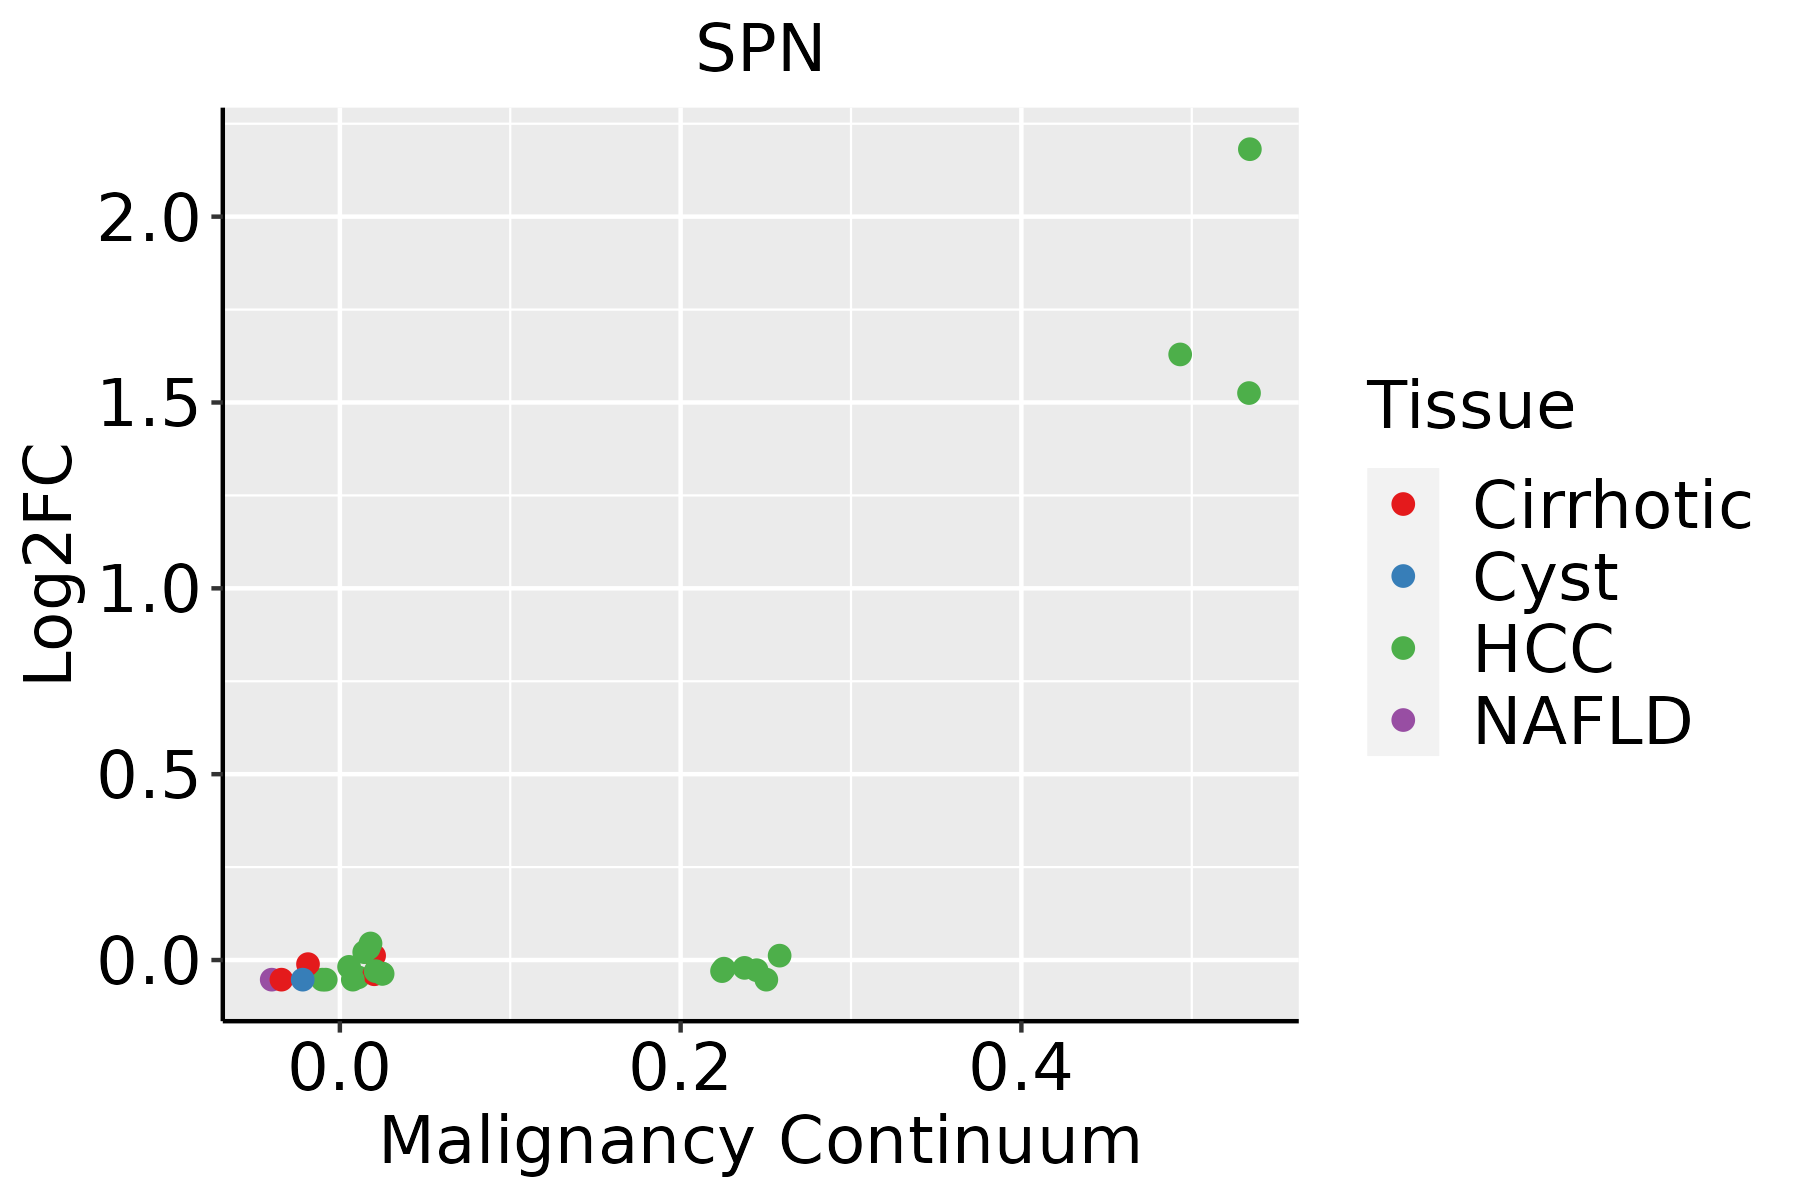 | HCC: Hepatocellular carcinoma |
| NAFLD: Non-alcoholic fatty liver disease |
| ∗log2FC in expression of this searched gene in stem-like cells from each diseased tissue sample relative to stem-like cells in normal samples in each tissue plotted against the malignancy continuum. Samples are colored based on if they are from different disease stage. |
Top |
Malignant transformation related pathway analysis |
| Find out the enriched GO biological processes and KEGG pathways involved in transition from healthy to precancer to cancer |
| Tissue | Disease Stage | Enriched GO biological Processes |
| Colorectum | AD |  |
| Colorectum | SER |  |
| Colorectum | MSS |  |
| Colorectum | MSI-H |  |
| Colorectum | FAP |  |
| ∗Top 15 enriched GO BP terms are showed in the bar plot of each disease state in each tissue. Each row represents a significant GO biological process which is colored according to the -log10(p.adjust). |
| Page: 1 2 3 4 5 6 7 8 9 |
| GO ID | Tissue | Disease Stage | Description | Gene Ratio | Bg Ratio | pvalue | p.adjust | Count |
| GO:00030126 | Endometrium | AEH | muscle system process | 78/2100 | 452/18723 | 6.89e-05 | 1.06e-03 | 78 |
| GO:0006936 | Endometrium | AEH | muscle contraction | 59/2100 | 347/18723 | 7.32e-04 | 6.99e-03 | 59 |
| GO:000301213 | Endometrium | EEC | muscle system process | 79/2168 | 452/18723 | 1.16e-04 | 1.55e-03 | 79 |
| GO:00069361 | Endometrium | EEC | muscle contraction | 59/2168 | 347/18723 | 1.57e-03 | 1.26e-02 | 59 |
| GO:004477216 | Esophagus | ESCC | mitotic cell cycle phase transition | 281/8552 | 424/18723 | 4.63e-18 | 4.45e-16 | 281 |
| GO:000734615 | Esophagus | ESCC | regulation of mitotic cell cycle | 293/8552 | 457/18723 | 8.00e-16 | 5.64e-14 | 293 |
| GO:190198713 | Esophagus | ESCC | regulation of cell cycle phase transition | 242/8552 | 390/18723 | 3.86e-11 | 1.26e-09 | 242 |
| GO:190199013 | Esophagus | ESCC | regulation of mitotic cell cycle phase transition | 191/8552 | 299/18723 | 1.35e-10 | 3.94e-09 | 191 |
| GO:00457865 | Esophagus | ESCC | negative regulation of cell cycle | 236/8552 | 385/18723 | 3.62e-10 | 9.93e-09 | 236 |
| GO:00000754 | Esophagus | ESCC | cell cycle checkpoint | 117/8552 | 169/18723 | 4.47e-10 | 1.17e-08 | 117 |
| GO:004277014 | Esophagus | ESCC | signal transduction in response to DNA damage | 117/8552 | 172/18723 | 2.38e-09 | 5.32e-08 | 117 |
| GO:00448394 | Esophagus | ESCC | cell cycle G2/M phase transition | 103/8552 | 148/18723 | 3.09e-09 | 6.67e-08 | 103 |
| GO:00000864 | Esophagus | ESCC | G2/M transition of mitotic cell cycle | 96/8552 | 137/18723 | 6.00e-09 | 1.23e-07 | 96 |
| GO:000701527 | Esophagus | ESCC | actin filament organization | 259/8552 | 442/18723 | 2.37e-08 | 4.50e-07 | 259 |
| GO:00070934 | Esophagus | ESCC | mitotic cell cycle checkpoint | 90/8552 | 129/18723 | 2.49e-08 | 4.69e-07 | 90 |
| GO:00066433 | Esophagus | ESCC | membrane lipid metabolic process | 130/8552 | 203/18723 | 9.29e-08 | 1.54e-06 | 130 |
| GO:00715599 | Esophagus | ESCC | response to transforming growth factor beta | 157/8552 | 256/18723 | 2.95e-07 | 4.23e-06 | 157 |
| GO:00109484 | Esophagus | ESCC | negative regulation of cell cycle process | 177/8552 | 294/18723 | 3.26e-07 | 4.59e-06 | 177 |
| GO:00315705 | Esophagus | ESCC | DNA integrity checkpoint | 83/8552 | 123/18723 | 8.17e-07 | 1.06e-05 | 83 |
| GO:00000775 | Esophagus | ESCC | DNA damage checkpoint | 78/8552 | 115/18723 | 1.27e-06 | 1.56e-05 | 78 |
| Page: 1 2 3 4 5 6 7 8 9 |
| Pathway ID | Tissue | Disease Stage | Description | Gene Ratio | Bg Ratio | pvalue | p.adjust | qvalue | Count |
| Page: 1 |
Top |
Cell-cell communication analysis |
| Identification of potential cell-cell interactions between two cell types and their ligand-receptor pairs for different disease states |
| Ligand | Receptor | LRpair | Pathway | Tissue | Disease Stage |
| ICAM1 | SPN | ICAM1_SPN | ICAM | Breast | ADJ |
| ICAM1 | SPN | ICAM1_SPN | ICAM | Breast | DCIS |
| SIGLEC1 | SPN | SIGLEC1_SPN | SN | Breast | DCIS |
| ICAM1 | SPN | ICAM1_SPN | ICAM | Breast | Healthy |
| SIGLEC1 | SPN | SIGLEC1_SPN | SN | Breast | Healthy |
| ICAM1 | SPN | ICAM1_SPN | ICAM | Breast | IDC |
| SIGLEC1 | SPN | SIGLEC1_SPN | SN | Breast | IDC |
| ICAM1 | SPN | ICAM1_SPN | ICAM | Cervix | ADJ |
| ICAM1 | SPN | ICAM1_SPN | ICAM | Cervix | CC |
| SIGLEC1 | SPN | SIGLEC1_SPN | SN | Cervix | CC |
| ICAM1 | SPN | ICAM1_SPN | ICAM | Cervix | Precancer |
| ICAM1 | SPN | ICAM1_SPN | ICAM | Endometrium | ADJ |
| ICAM1 | SPN | ICAM1_SPN | ICAM | Endometrium | AEH |
| ICAM1 | SPN | ICAM1_SPN | ICAM | Endometrium | Healthy |
| ICAM1 | SPN | ICAM1_SPN | ICAM | Esophagus | ESCC |
| ICAM1 | SPN | ICAM1_SPN | ICAM | HNSCC | ADJ |
| SIGLEC1 | SPN | SIGLEC1_SPN | SN | HNSCC | ADJ |
| ICAM1 | SPN | ICAM1_SPN | ICAM | HNSCC | Healthy |
| ICAM1 | SPN | ICAM1_SPN | ICAM | HNSCC | OSCC |
| SIGLEC1 | SPN | SIGLEC1_SPN | SN | HNSCC | OSCC |
| Page: 1 |
Top |
Single-cell gene regulatory network inference analysis |
| Find out the significant the regulons (TFs) and the target genes of each regulon across cell types for different disease states |
| TF | Cell Type | Tissue | Disease Stage | Target Gene | RSS | Regulon Activity |
| ∗The dot plots of a searched regulon are shown for all cell subpopulations in each disease state of each tissue based on the regulon specific score inferred using pySCENIC and by calculating the average expression. |
| Page: 1 |
Top |
Somatic mutation of malignant transformation related genes |
| Annotation of somatic variants for genes involved in malignant transformation |
| Hugo Symbol | Variant Class | Variant Classification | dbSNP RS | HGVSc | HGVSp | HGVSp Short | SWISSPROT | BIOTYPE | SIFT | PolyPhen | Tumor Sample Barcode | Tissue | Histology | Sex | Age | Stage | Therapy Types | Drugs | Outcome |
| SPN | SNV | Missense_Mutation | c.475N>C | p.Glu159Gln | p.E159Q | P16150 | protein_coding | deleterious(0.04) | benign(0.144) | TCGA-A8-A08L-01 | Breast | breast invasive carcinoma | Female | >=65 | III/IV | Unknown | Unknown | SD | |
| SPN | SNV | Missense_Mutation | c.745G>C | p.Asp249His | p.D249H | P16150 | protein_coding | tolerated(0.19) | benign(0.017) | TCGA-Q1-A73O-01 | Cervix | cervical & endocervical cancer | Female | <65 | I/II | Chemotherapy | cisplatin | CR | |
| SPN | SNV | Missense_Mutation | c.230N>A | p.Leu77His | p.L77H | P16150 | protein_coding | tolerated(0.55) | benign(0.275) | TCGA-A6-5661-01 | Colorectum | colon adenocarcinoma | Female | >=65 | I/II | Unknown | Unknown | SD | |
| SPN | SNV | Missense_Mutation | rs756568331 | c.419C>T | p.Pro140Leu | p.P140L | P16150 | protein_coding | tolerated(1) | benign(0) | TCGA-AD-6895-01 | Colorectum | colon adenocarcinoma | Male | >=65 | III/IV | Unknown | Unknown | SD |
| SPN | SNV | Missense_Mutation | rs868529835 | c.736C>T | p.Arg246Trp | p.R246W | P16150 | protein_coding | deleterious(0.02) | possibly_damaging(0.533) | TCGA-CA-6717-01 | Colorectum | colon adenocarcinoma | Male | <65 | I/II | Chemotherapy | oxaliplatin | CR |
| SPN | SNV | Missense_Mutation | rs779631820 | c.833N>A | p.Arg278His | p.R278H | P16150 | protein_coding | tolerated(0.08) | benign(0.061) | TCGA-D5-6928-01 | Colorectum | colon adenocarcinoma | Male | >=65 | I/II | Unknown | Unknown | SD |
| SPN | SNV | Missense_Mutation | rs181483014 | c.737G>A | p.Arg246Gln | p.R246Q | P16150 | protein_coding | tolerated(0.62) | benign(0.006) | TCGA-NH-A5IV-01 | Colorectum | colon adenocarcinoma | Female | >=65 | I/II | Unknown | Unknown | SD |
| SPN | SNV | Missense_Mutation | c.49G>A | p.Ala17Thr | p.A17T | P16150 | protein_coding | tolerated(0.15) | benign(0.003) | TCGA-AH-6643-01 | Colorectum | rectum adenocarcinoma | Male | <65 | III/IV | Chemotherapy | oxaliplatin | PD | |
| SPN | SNV | Missense_Mutation | novel | c.610N>T | p.Pro204Ser | p.P204S | P16150 | protein_coding | tolerated(0.14) | benign(0.013) | TCGA-A5-A0G1-01 | Endometrium | uterine corpus endometrioid carcinoma | Female | >=65 | I/II | Unknown | Unknown | SD |
| SPN | SNV | Missense_Mutation | c.742C>A | p.Pro248Thr | p.P248T | P16150 | protein_coding | deleterious(0.04) | possibly_damaging(0.496) | TCGA-A5-A0GB-01 | Endometrium | uterine corpus endometrioid carcinoma | Female | >=65 | I/II | Unknown | Unknown | SD |
| Page: 1 2 3 4 |
Top |
Related drugs of malignant transformation related genes |
| Identification of chemicals and drugs interact with genes involved in malignant transfromation |
| (DGIdb 4.0) |
| Entrez ID | Symbol | Category | Interaction Types | Drug Claim Name | Drug Name | PMIDs |
| Page: 1 |

Copyright 2023-Present -The University of Texas Health Science Center at Houston |