Schematic overview of the cellular and molecular mechanisms involved in the cancer progression, including the proposed cellular and molecular mechanisms in cancer cells trajectory. AT1: alveolar type 1 cells; AT2: alveolar type 2 cells; AAH: atypical adenomatous hyperplasia; AIS: adenocarcinoma in situ; MIA: minimally invasive adenocarcinoma; IA: invasive adenocarcinoma; EMT: epithelial-mesenchymal transition

Home

Download

Statistics

Help

Contact

Center for Computational Systems Medicine
leaf

Gene summary

leaf

Malignant transformation analysis

leaf

Malignant transformation related pathway analysis

leaf

Cell-cell communication analysis

leaf

Single-cell gene regulatory network inference analysis

leaf

Somatic mutation of malignant transformation related genes

leaf

Related drugs of malignant transformation related genes

Gene: SPIRE1

Gene summary for SPIRE1

check button Gene summary.

Gene informationSpeciesHuman
Gene symbol

SPIRE1

Gene ID

56907

Gene namespire type actin nucleation factor 1
Gene AliasSpir-1
Cytomap18p11.21
Gene Typeprotein-coding
GO ID

GO:0000003

UniProtAcc

Q08AE8


Top

Malignant transformation analysis

check button Identification of the aberrant gene expression in precancerous and cancerous lesions by comparing the gene expression of stem-like cells in diseased tissues with normal stem cells
check button Malignant transformation involving gene list.
Entrez IDSymbolReplicatesSpeciesOrganTissueAdj P-valueLog2FCMalignancy
56907SPIRE1P2T-EHumanEsophagusESCC1.10e-091.71e-010.1177
56907SPIRE1P5T-EHumanEsophagusESCC4.18e-038.16e-020.1327
56907SPIRE1P9T-EHumanEsophagusESCC2.10e-038.62e-020.1131
56907SPIRE1P11T-EHumanEsophagusESCC2.88e-051.94e-010.1426
56907SPIRE1P12T-EHumanEsophagusESCC1.83e-071.06e-010.1122
56907SPIRE1P16T-EHumanEsophagusESCC1.82e-051.33e-010.1153
56907SPIRE1P20T-EHumanEsophagusESCC5.17e-071.67e-010.1124
56907SPIRE1P21T-EHumanEsophagusESCC1.27e-031.20e-010.1617
56907SPIRE1P22T-EHumanEsophagusESCC1.42e-059.07e-020.1236
56907SPIRE1P23T-EHumanEsophagusESCC7.09e-049.75e-020.108
56907SPIRE1P24T-EHumanEsophagusESCC1.21e-048.74e-020.1287
56907SPIRE1P26T-EHumanEsophagusESCC3.28e-051.54e-010.1276
56907SPIRE1P28T-EHumanEsophagusESCC3.25e-162.35e-010.1149
56907SPIRE1P31T-EHumanEsophagusESCC4.68e-102.99e-010.1251
56907SPIRE1P32T-EHumanEsophagusESCC3.34e-112.29e-010.1666
56907SPIRE1P36T-EHumanEsophagusESCC3.78e-032.82e-010.1187
56907SPIRE1P37T-EHumanEsophagusESCC5.59e-102.14e-010.1371
56907SPIRE1P38T-EHumanEsophagusESCC7.68e-105.73e-010.127
56907SPIRE1P40T-EHumanEsophagusESCC3.22e-061.84e-010.109
56907SPIRE1P42T-EHumanEsophagusESCC5.63e-071.23e-010.1175
Page: 1 2 3 4 

check button Transcriptomic changes along malignancy continuum.
TissueExpression DynamicsAbbreviation
EsophagusThe image shows the transcriptomic changes along malignancy continuum.log2FC in expression of this searched gene in stem-like cells from each diseased tissue sample relative to stem-like cells in normal samples in each tissue plotted against the malignancy continuum. Samples are colored based on if they are from different disease stage.ESCC: Esophageal squamous cell carcinoma
HGIN: High-grade intraepithelial neoplasias
LGIN: Low-grade intraepithelial neoplasias
LungThe image shows the transcriptomic changes along malignancy continuum.log2FC in expression of this searched gene in stem-like cells from each diseased tissue sample relative to stem-like cells in normal samples in each tissue plotted against the malignancy continuum. Samples are colored based on if they are from different disease stage.
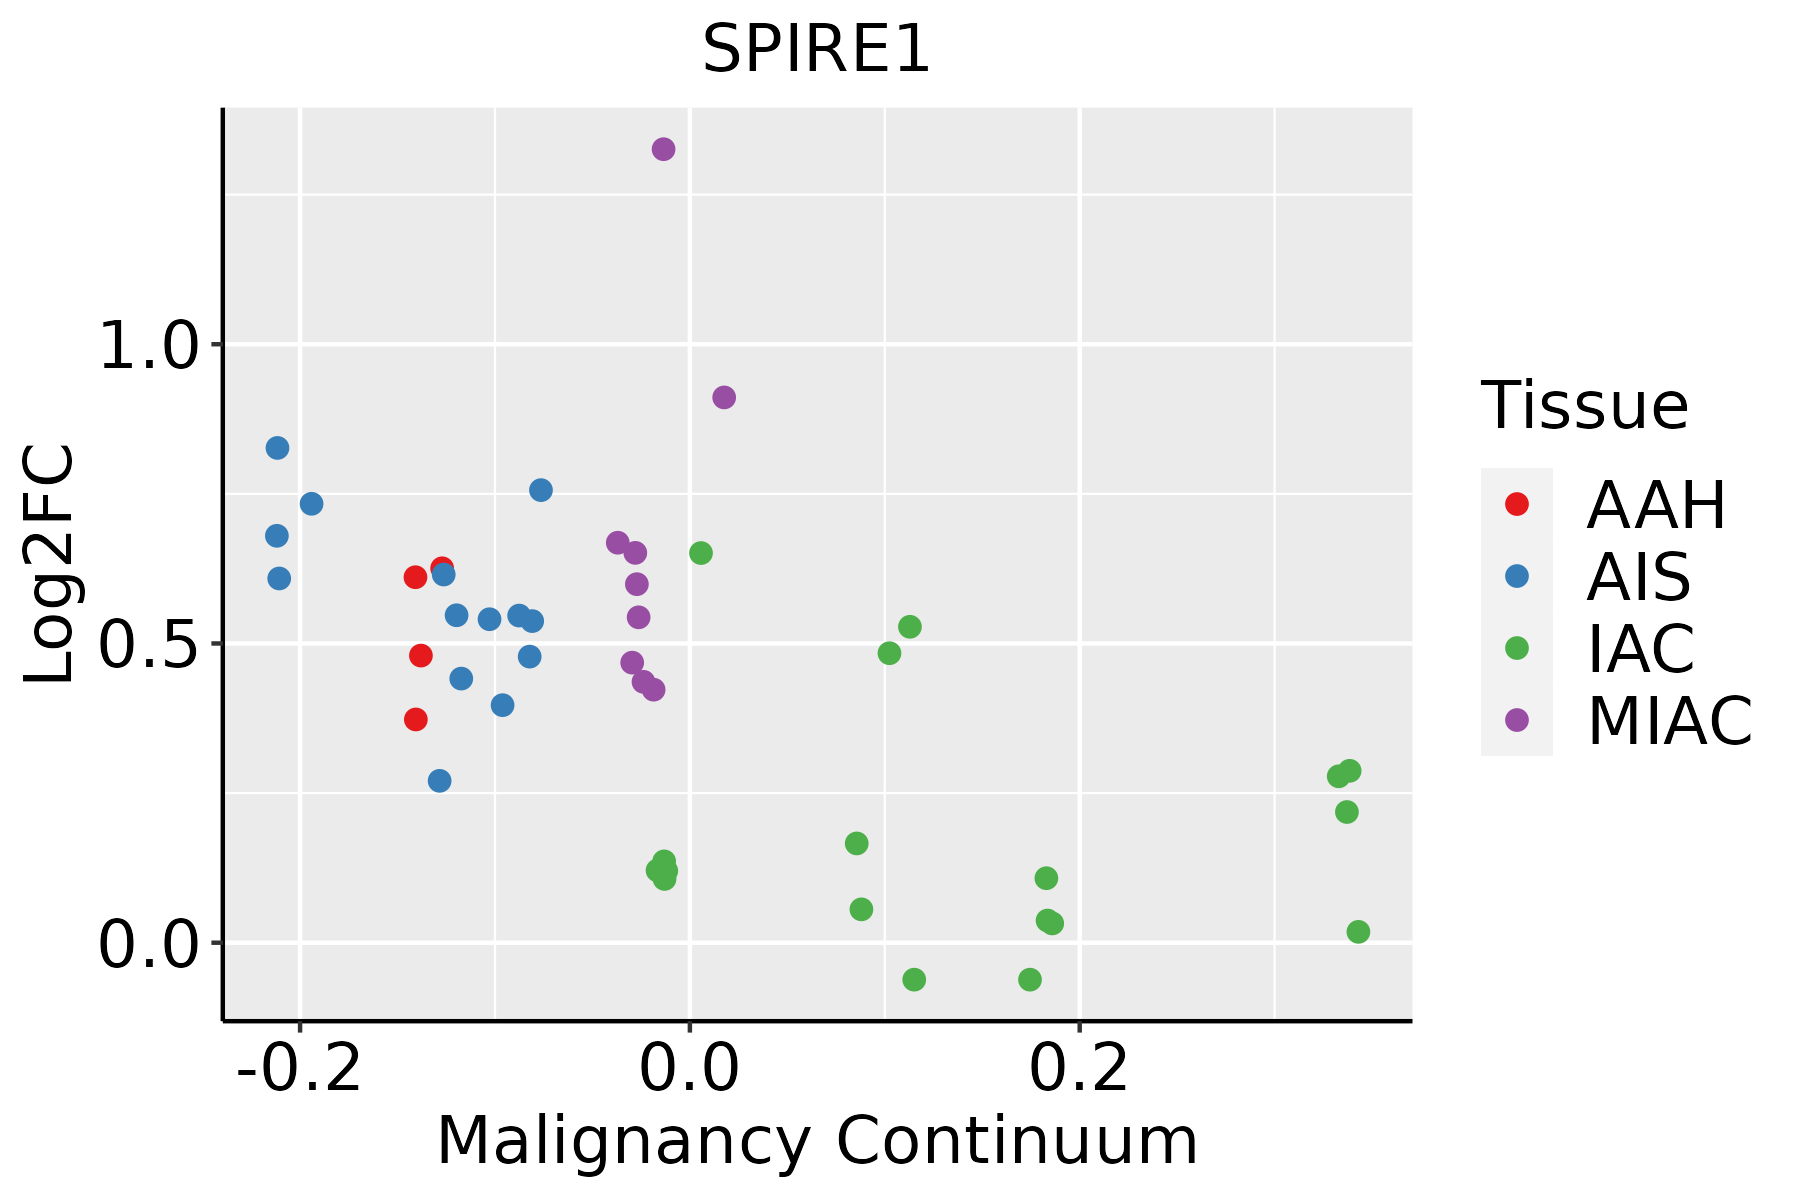
AAH: Atypical adenomatous hyperplasia
AIS: Adenocarcinoma in situ
IAC: Invasive lung adenocarcinoma
MIA: Minimally invasive adenocarcinoma
ProstateThe image shows the transcriptomic changes along malignancy continuum.log2FC in expression of this searched gene in stem-like cells from each diseased tissue sample relative to stem-like cells in normal samples in each tissue plotted against the malignancy continuum. Samples are colored based on if they are from different disease stage.
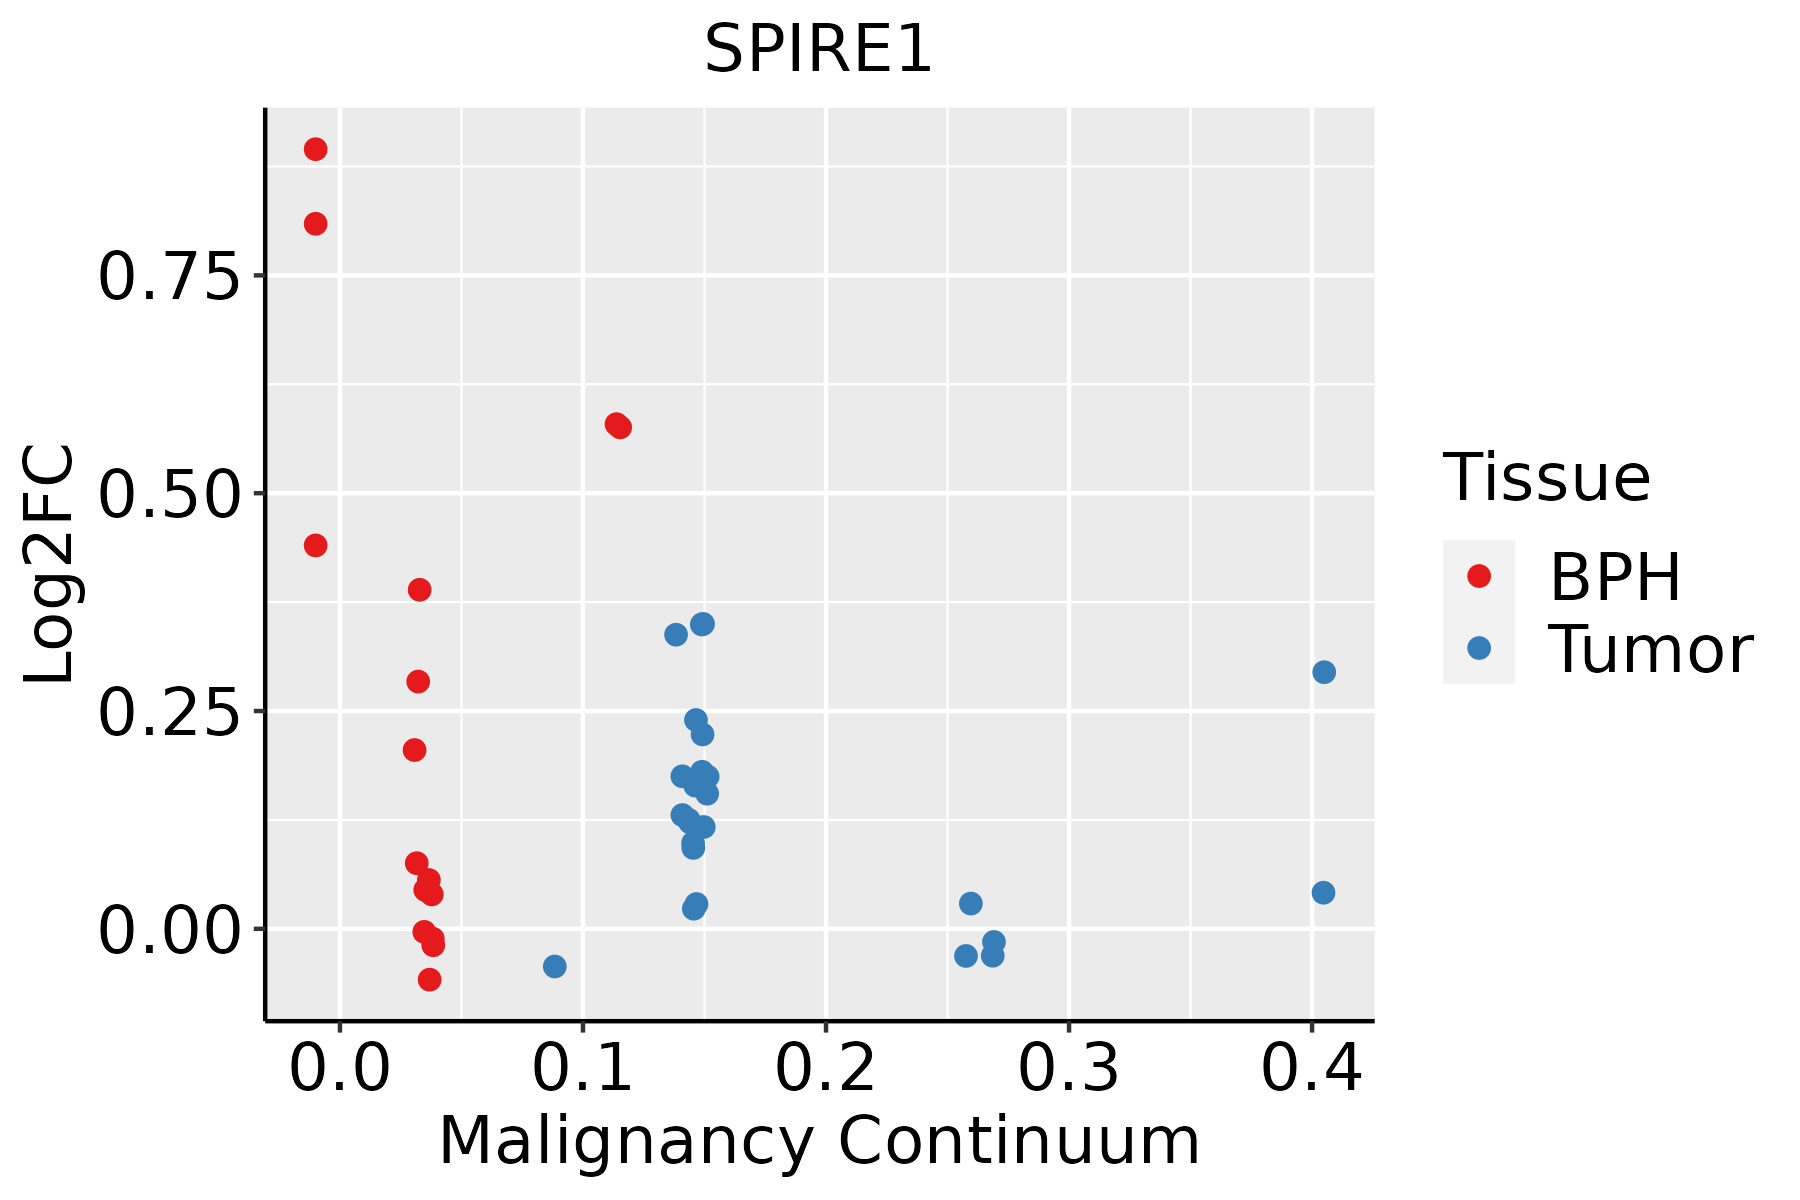
BPH: Benign Prostatic Hyperplasia
ThyroidThe image shows the transcriptomic changes along malignancy continuum.log2FC in expression of this searched gene in stem-like cells from each diseased tissue sample relative to stem-like cells in normal samples in each tissue plotted against the malignancy continuum. Samples are colored based on if they are from different disease stage.
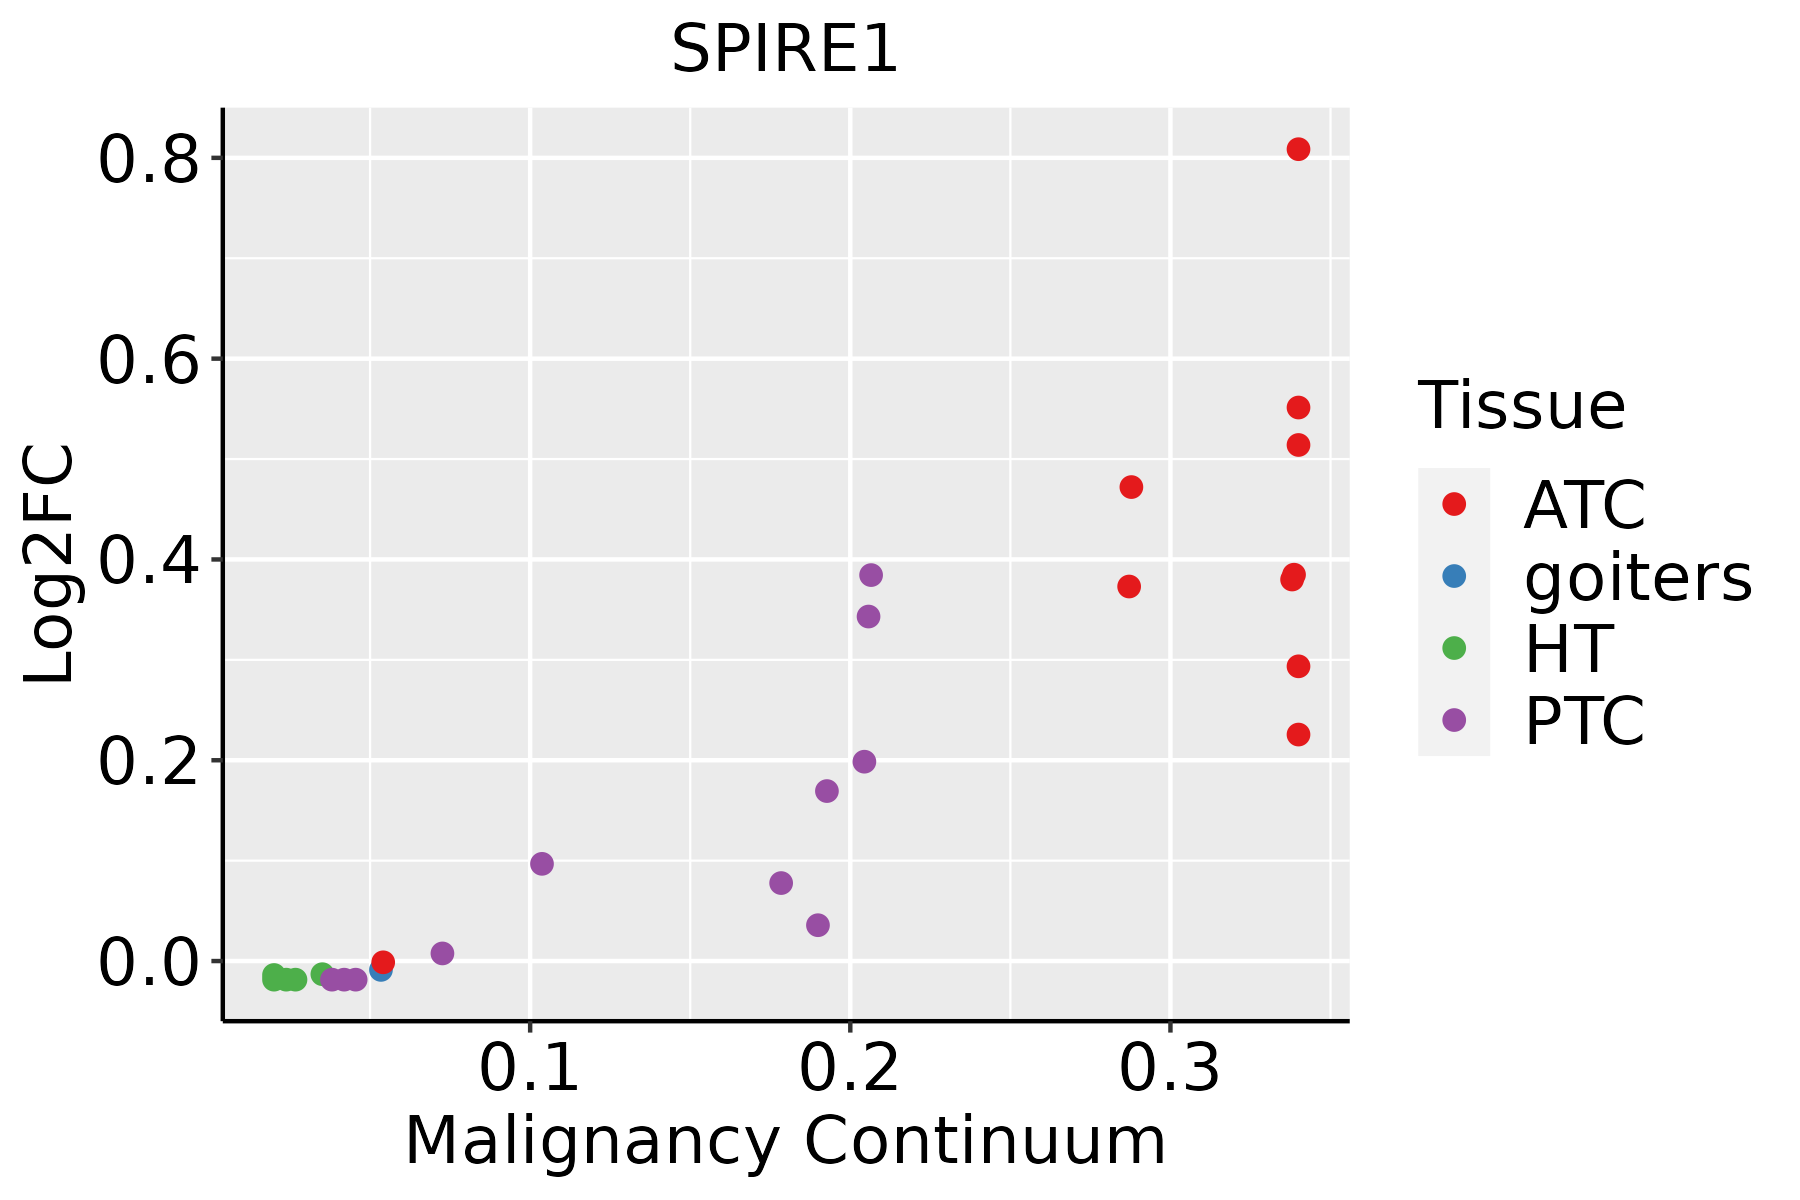
ATC: Anaplastic thyroid cancer
HT: Hashimoto's thyroiditis
PTC: Papillary thyroid cancer
∗log2FC in expression of this searched gene in stem-like cells from each diseased tissue sample relative to stem-like cells in normal samples in each tissue plotted against the malignancy continuum. Samples are colored based on if they are from different disease stage.

Top

Malignant transformation related pathway analysis

check buttonFind out the enriched GO biological processes and KEGG pathways involved in transition from healthy to precancer to cancer
check button Figure of enriched GO biological processes.
TissueDisease StageEnriched GO biological Processes
ColorectumADGO analysis - Figure of enriched GO biological processes: Top 15 enriched GO BP terms are showed in the bar plot of each disease state in each tissue. Each row represents a significant GO biological process which is colored according to the -log10(p.adjust).
ColorectumSERGO analysis - Figure of enriched GO biological processes: Top 15 enriched GO BP terms are showed in the bar plot of each disease state in each tissue. Each row represents a significant GO biological process which is colored according to the -log10(p.adjust).
ColorectumMSSGO analysis - Figure of enriched GO biological processes: Top 15 enriched GO BP terms are showed in the bar plot of each disease state in each tissue. Each row represents a significant GO biological process which is colored according to the -log10(p.adjust).
ColorectumMSI-HGO analysis - Figure of enriched GO biological processes: Top 15 enriched GO BP terms are showed in the bar plot of each disease state in each tissue. Each row represents a significant GO biological process which is colored according to the -log10(p.adjust).
ColorectumFAPGO analysis - Figure of enriched GO biological processes: Top 15 enriched GO BP terms are showed in the bar plot of each disease state in each tissue. Each row represents a significant GO biological process which is colored according to the -log10(p.adjust).
∗Top 15 enriched GO BP terms are showed in the bar plot of each disease state in each tissue. Each row represents a significant GO biological process which is colored according to the -log10(p.adjust).
Page: 1 2 3 4 5 6 7 8 9 

check button Enriched GO biological processes.
GO IDTissueDisease StageDescriptionGene RatioBg Ratiopvaluep.adjustCount
GO:004819318EsophagusESCCGolgi vesicle transport231/8552296/187231.82e-309.63e-28231
GO:005165617EsophagusESCCestablishment of organelle localization273/8552390/187239.13e-231.81e-20273
GO:0043254111EsophagusESCCregulation of protein-containing complex assembly278/8552428/187233.81e-162.77e-14278
GO:0031334111EsophagusESCCpositive regulation of protein-containing complex assembly166/8552237/187232.06e-141.07e-12166
GO:005105215EsophagusESCCregulation of DNA metabolic process232/8552359/187232.40e-131.13e-11232
GO:00482853EsophagusESCCorganelle fission301/8552488/187234.64e-132.12e-11301
GO:0010821110EsophagusESCCregulation of mitochondrion organization107/8552144/187232.31e-129.41e-11107
GO:00002802EsophagusESCCnuclear division270/8552439/187231.17e-114.24e-10270
GO:005105417EsophagusESCCpositive regulation of DNA metabolic process139/8552201/187231.20e-114.33e-10139
GO:1902905111EsophagusESCCpositive regulation of supramolecular fiber organization142/8552209/187235.51e-111.76e-09142
GO:1902903111EsophagusESCCregulation of supramolecular fiber organization237/8552383/187239.06e-112.75e-09237
GO:2001020110EsophagusESCCregulation of response to DNA damage stimulus145/8552219/187235.97e-101.50e-08145
GO:005149520EsophagusESCCpositive regulation of cytoskeleton organization147/8552226/187232.93e-096.38e-08147
GO:001082215EsophagusESCCpositive regulation of mitochondrion organization58/855274/187238.55e-091.73e-0758
GO:003250614EsophagusESCCcytokinetic process35/855239/187239.38e-091.90e-0735
GO:0051258111EsophagusESCCprotein polymerization183/8552297/187231.94e-083.75e-07183
GO:000701527EsophagusESCCactin filament organization259/8552442/187232.37e-084.50e-07259
GO:000091016EsophagusESCCcytokinesis115/8552173/187232.48e-084.68e-07115
GO:0032273111EsophagusESCCpositive regulation of protein polymerization95/8552138/187232.97e-085.57e-0795
GO:003253520EsophagusESCCregulation of cellular component size227/8552383/187234.77e-088.60e-07227
Page: 1 2 3 4 5 6 7 8 9 10 11 12 

check button Enriched KEGG pathways.
Pathway IDTissueDisease StageDescriptionGene RatioBg Ratiopvaluep.adjustqvalueCount
Page: 1 

Top

Cell-cell communication analysis

check buttonIdentification of potential cell-cell interactions between two cell types and their ligand-receptor pairs for different disease states
LigandReceptorLRpairPathwayTissueDisease Stage
Page: 1 

Top

Single-cell gene regulatory network inference analysis

check buttonFind out the significant the regulons (TFs) and the target genes of each regulon across cell types for different disease states
TFCell TypeTissueDisease StageTarget GeneRSSRegulon Activity
∗The dot plots of a searched regulon are shown for all cell subpopulations in each disease state of each tissue based on the regulon specific score inferred using pySCENIC and by calculating the average expression.
Page: 1 

Top

Somatic mutation of malignant transformation related genes

check buttonAnnotation of somatic variants for genes involved in malignant transformation
Hugo SymbolVariant ClassVariant ClassificationdbSNP RSHGVScHGVSpHGVSp ShortSWISSPROTBIOTYPESIFTPolyPhenTumor Sample BarcodeTissueHistologySexAgeStageTherapy TypesDrugsOutcome
SPIRE1SNVMissense_Mutationrs753346539c.1094N>Ap.Arg365Glnp.R365QQ08AE8protein_codingtolerated(0.25)benign(0.116)TCGA-AR-A250-01Breastbreast invasive carcinomaFemale<65I/IIChemotherapydoxorubicinSD
SPIRE1SNVMissense_Mutationrs769420628c.1912N>Gp.Ile638Valp.I638VQ08AE8protein_codingtolerated(1)benign(0.203)TCGA-BH-A18Q-01Breastbreast invasive carcinomaFemale<65I/IIUnknownUnknownSD
SPIRE1deletionFrame_Shift_Delnovelc.2134delNp.Ile712SerfsTer18p.I712Sfs*18Q08AE8protein_codingTCGA-D8-A27V-01Breastbreast invasive carcinomaFemale<65I/IIHormone TherapytamoxiphenSD
SPIRE1SNVMissense_Mutationnovelc.833N>Tp.Arg278Metp.R278MQ08AE8protein_codingdeleterious(0)probably_damaging(0.998)TCGA-2W-A8YY-01Cervixcervical & endocervical cancerFemale<65I/IIChemotherapycisplatinCR
SPIRE1SNVMissense_Mutationnovelc.655N>Ap.Ala219Thrp.A219TQ08AE8protein_codingdeleterious(0)probably_damaging(0.998)TCGA-2W-A8YY-01Cervixcervical & endocervical cancerFemale<65I/IIChemotherapycisplatinCR
SPIRE1SNVMissense_Mutationnovelc.545N>Ap.Gly182Glup.G182EQ08AE8protein_codingtolerated(1)benign(0)TCGA-2W-A8YY-01Cervixcervical & endocervical cancerFemale<65I/IIChemotherapycisplatinCR
SPIRE1SNVMissense_Mutationnovelc.516N>Tp.Glu172Aspp.E172DQ08AE8protein_codingtolerated(0.11)probably_damaging(0.99)TCGA-DS-A1OD-01Cervixcervical & endocervical cancerFemale<65I/IIChemotherapycisplatinSD
SPIRE1SNVMissense_Mutationrs764517052c.643A>Tp.Asn215Tyrp.N215YQ08AE8protein_codingdeleterious(0.03)probably_damaging(0.964)TCGA-VS-A8EJ-01Cervixcervical & endocervical cancerFemale<65I/IIChemotherapycisplatinPD
SPIRE1insertionFrame_Shift_Insnovelc.517_518insCCCTCATCTTTp.Gly173AlafsTer32p.G173Afs*32Q08AE8protein_codingTCGA-DS-A1OD-01Cervixcervical & endocervical cancerFemale<65I/IIChemotherapycisplatinSD
SPIRE1SNVMissense_Mutationrs754818224c.722N>Tp.Ala241Valp.A241VQ08AE8protein_codingdeleterious(0)probably_damaging(0.997)TCGA-AA-3984-01Colorectumcolon adenocarcinomaFemale<65I/IIUnknownUnknownSD
Page: 1 2 3 4 5 6 7 8 

Top

Related drugs of malignant transformation related genes

check buttonIdentification of chemicals and drugs interact with genes involved in malignant transfromation
(DGIdb 4.0)
Entrez IDSymbolCategoryInteraction TypesDrug Claim NameDrug NamePMIDs
Page: 1