
|
|||||
|
 | |
| |
| |
| |
| |
| |
|
Gene: SPINT1 |
Gene summary for SPINT1 |
| Gene information | Species | Human | Gene symbol | SPINT1 | Gene ID | 6692 |
| Gene name | serine peptidase inhibitor, Kunitz type 1 | |
| Gene Alias | HAI | |
| Cytomap | 15q15.1 | |
| Gene Type | protein-coding | GO ID | GO:0000003 | UniProtAcc | O43278 |
Top |
Malignant transformation analysis |
| Identification of the aberrant gene expression in precancerous and cancerous lesions by comparing the gene expression of stem-like cells in diseased tissues with normal stem cells |
| Entrez ID | Symbol | Replicates | Species | Organ | Tissue | Adj P-value | Log2FC | Malignancy |
| 6692 | SPINT1 | CA_HPV_1 | Human | Cervix | CC | 1.02e-04 | -2.44e-01 | 0.0264 |
| 6692 | SPINT1 | Tumor | Human | Cervix | CC | 2.16e-15 | 4.79e-01 | 0.1241 |
| 6692 | SPINT1 | sample3 | Human | Cervix | CC | 9.66e-25 | 5.62e-01 | 0.1387 |
| 6692 | SPINT1 | H2 | Human | Cervix | HSIL_HPV | 5.32e-16 | 5.76e-01 | 0.0632 |
| 6692 | SPINT1 | T3 | Human | Cervix | CC | 5.30e-22 | 5.53e-01 | 0.1389 |
| 6692 | SPINT1 | HTA11_3410_2000001011 | Human | Colorectum | AD | 4.60e-04 | 3.19e-01 | 0.0155 |
| 6692 | SPINT1 | HTA11_2487_2000001011 | Human | Colorectum | SER | 6.83e-23 | 1.15e+00 | -0.1808 |
| 6692 | SPINT1 | HTA11_1938_2000001011 | Human | Colorectum | AD | 1.73e-11 | 6.90e-01 | -0.0811 |
| 6692 | SPINT1 | HTA11_78_2000001011 | Human | Colorectum | AD | 3.54e-09 | 6.01e-01 | -0.1088 |
| 6692 | SPINT1 | HTA11_347_2000001011 | Human | Colorectum | AD | 4.26e-35 | 1.07e+00 | -0.1954 |
| 6692 | SPINT1 | HTA11_411_2000001011 | Human | Colorectum | SER | 5.45e-11 | 1.92e+00 | -0.2602 |
| 6692 | SPINT1 | HTA11_2112_2000001011 | Human | Colorectum | SER | 3.89e-05 | 1.02e+00 | -0.2196 |
| 6692 | SPINT1 | HTA11_3361_2000001011 | Human | Colorectum | AD | 1.55e-09 | 7.84e-01 | -0.1207 |
| 6692 | SPINT1 | HTA11_83_2000001011 | Human | Colorectum | SER | 9.97e-11 | 6.83e-01 | -0.1526 |
| 6692 | SPINT1 | HTA11_696_2000001011 | Human | Colorectum | AD | 6.78e-26 | 7.96e-01 | -0.1464 |
| 6692 | SPINT1 | HTA11_866_2000001011 | Human | Colorectum | AD | 2.63e-15 | 5.71e-01 | -0.1001 |
| 6692 | SPINT1 | HTA11_1391_2000001011 | Human | Colorectum | AD | 1.24e-17 | 8.62e-01 | -0.059 |
| 6692 | SPINT1 | HTA11_5212_2000001011 | Human | Colorectum | AD | 3.70e-13 | 1.09e+00 | -0.2061 |
| 6692 | SPINT1 | HTA11_5216_2000001011 | Human | Colorectum | SER | 9.98e-05 | 7.89e-01 | -0.1462 |
| 6692 | SPINT1 | HTA11_546_2000001011 | Human | Colorectum | AD | 1.05e-08 | 7.17e-01 | -0.0842 |
| Page: 1 2 3 4 5 6 7 8 9 10 |
| Tissue | Expression Dynamics | Abbreviation |
| Cervix | 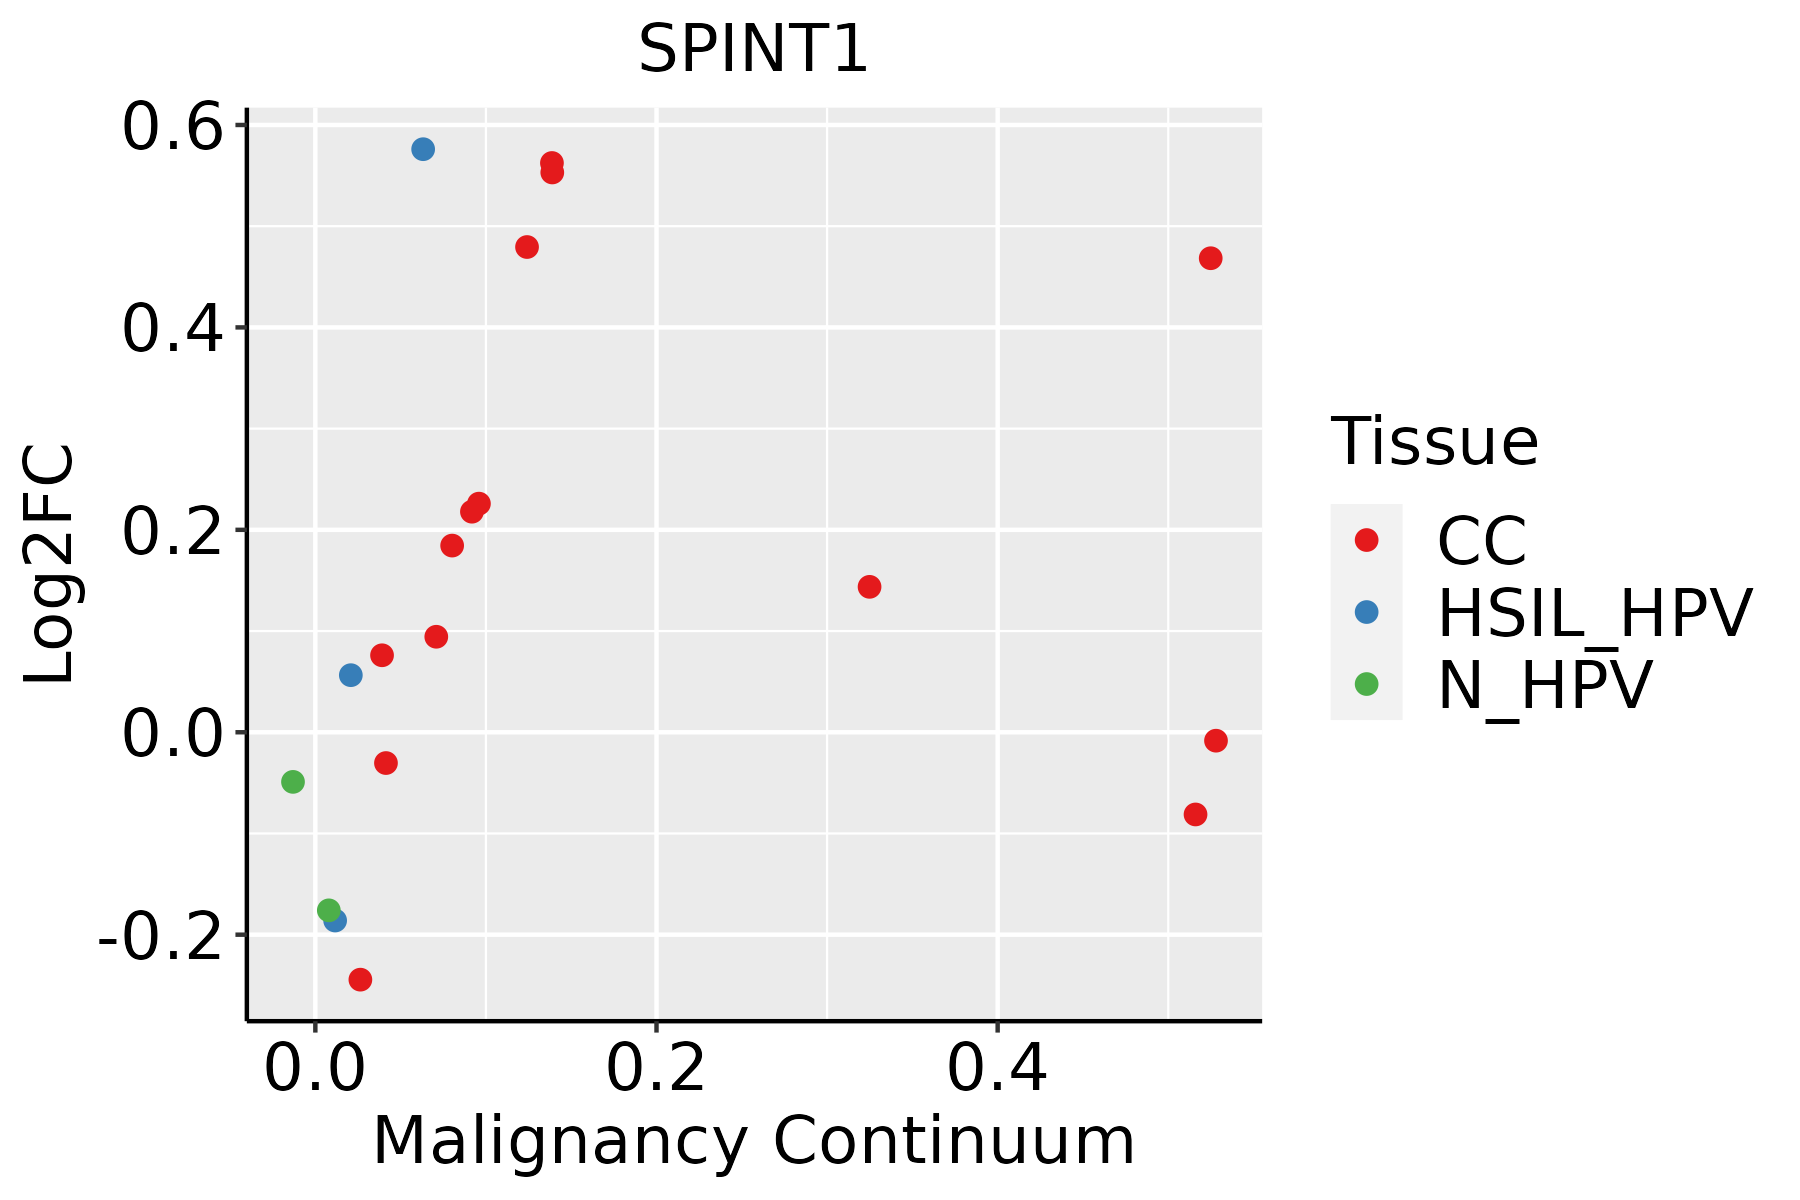 | CC: Cervix cancer |
| HSIL_HPV: HPV-infected high-grade squamous intraepithelial lesions | ||
| N_HPV: HPV-infected normal cervix | ||
| Colorectum (GSE201348) |  | FAP: Familial adenomatous polyposis |
| CRC: Colorectal cancer | ||
| Colorectum (HTA11) |  | AD: Adenomas |
| SER: Sessile serrated lesions | ||
| MSI-H: Microsatellite-high colorectal cancer | ||
| MSS: Microsatellite stable colorectal cancer | ||
| Esophagus |  | ESCC: Esophageal squamous cell carcinoma |
| HGIN: High-grade intraepithelial neoplasias | ||
| LGIN: Low-grade intraepithelial neoplasias | ||
| GC |  | CAG: Chronic atrophic gastritis |
| CAG with IM: Chronic atrophic gastritis with intestinal metaplasia | ||
| CSG: Chronic superficial gastritis | ||
| GC: Gastric cancer | ||
| SIM: Severe intestinal metaplasia | ||
| WIM: Wild intestinal metaplasia | ||
| Liver | 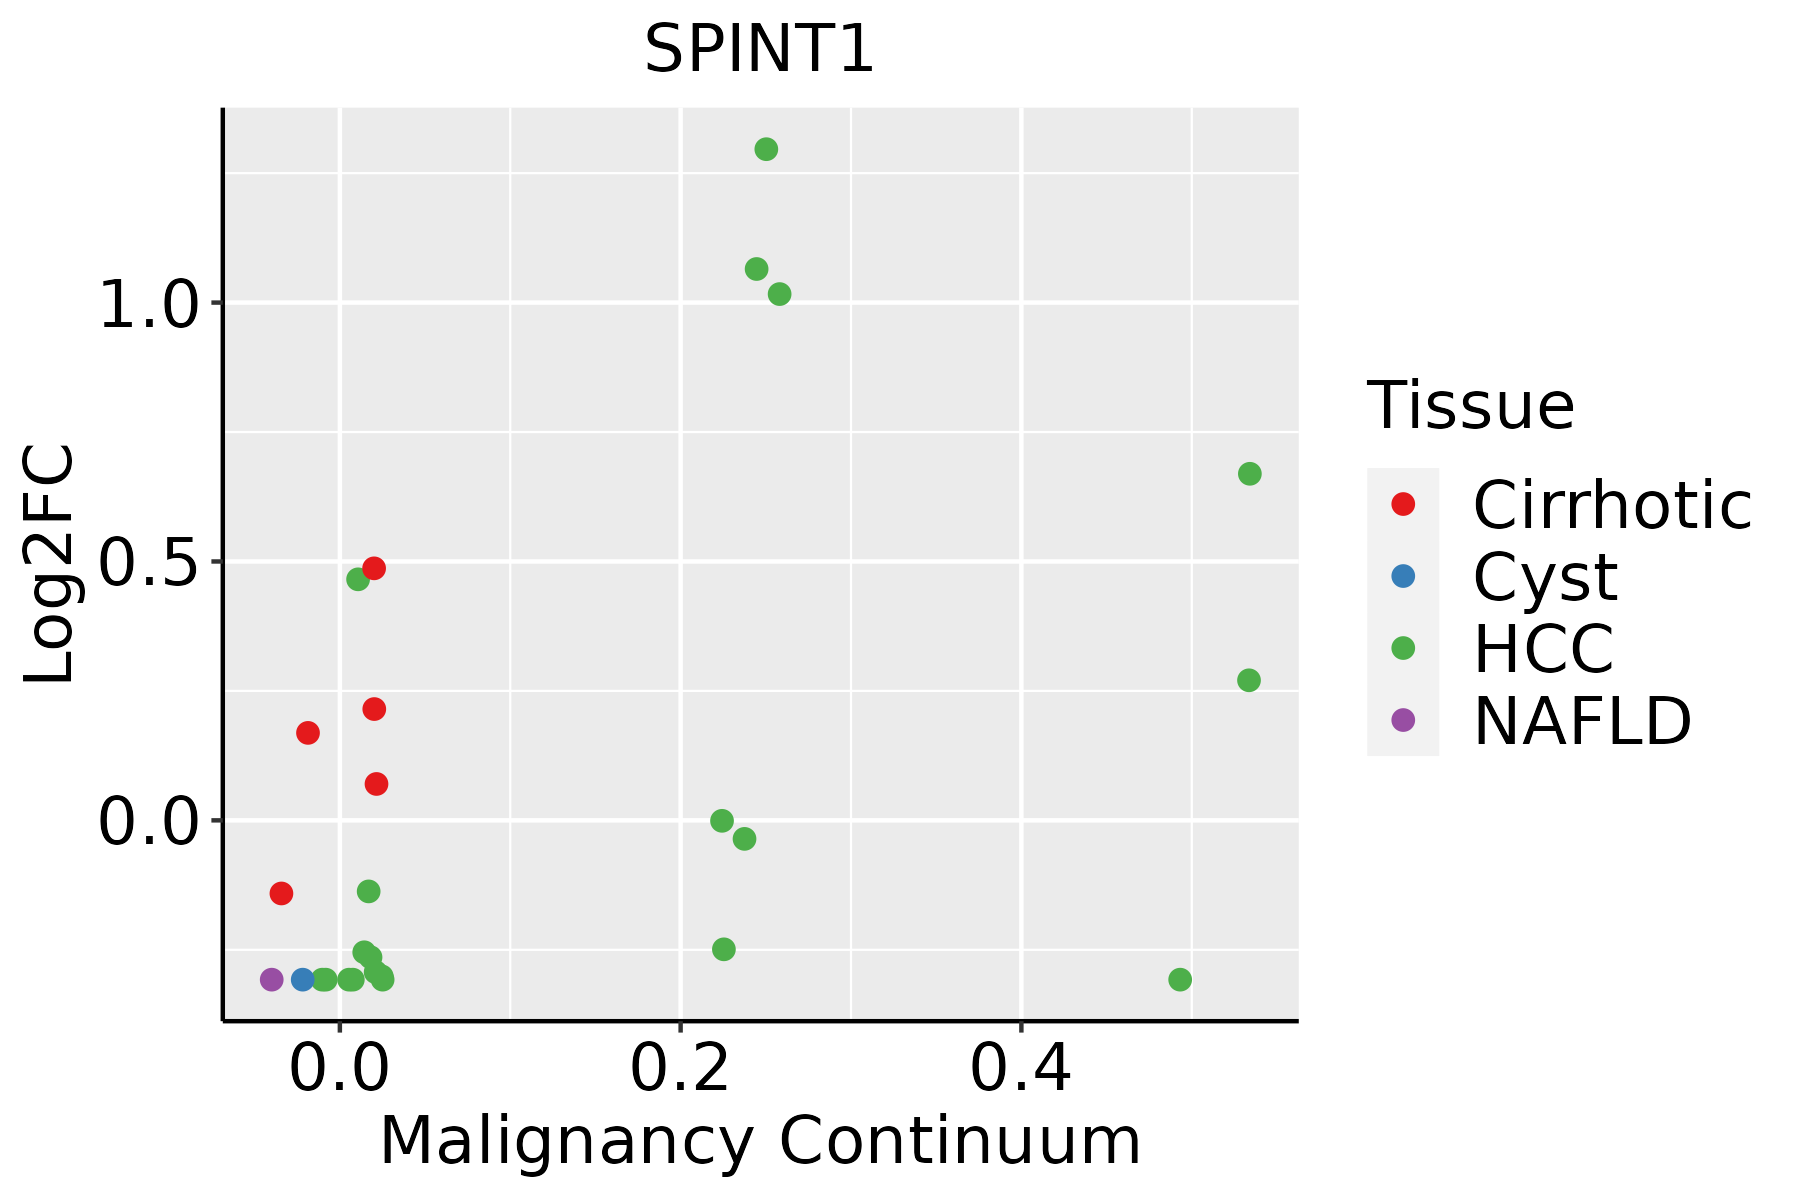 | HCC: Hepatocellular carcinoma |
| NAFLD: Non-alcoholic fatty liver disease | ||
| Oral Cavity | 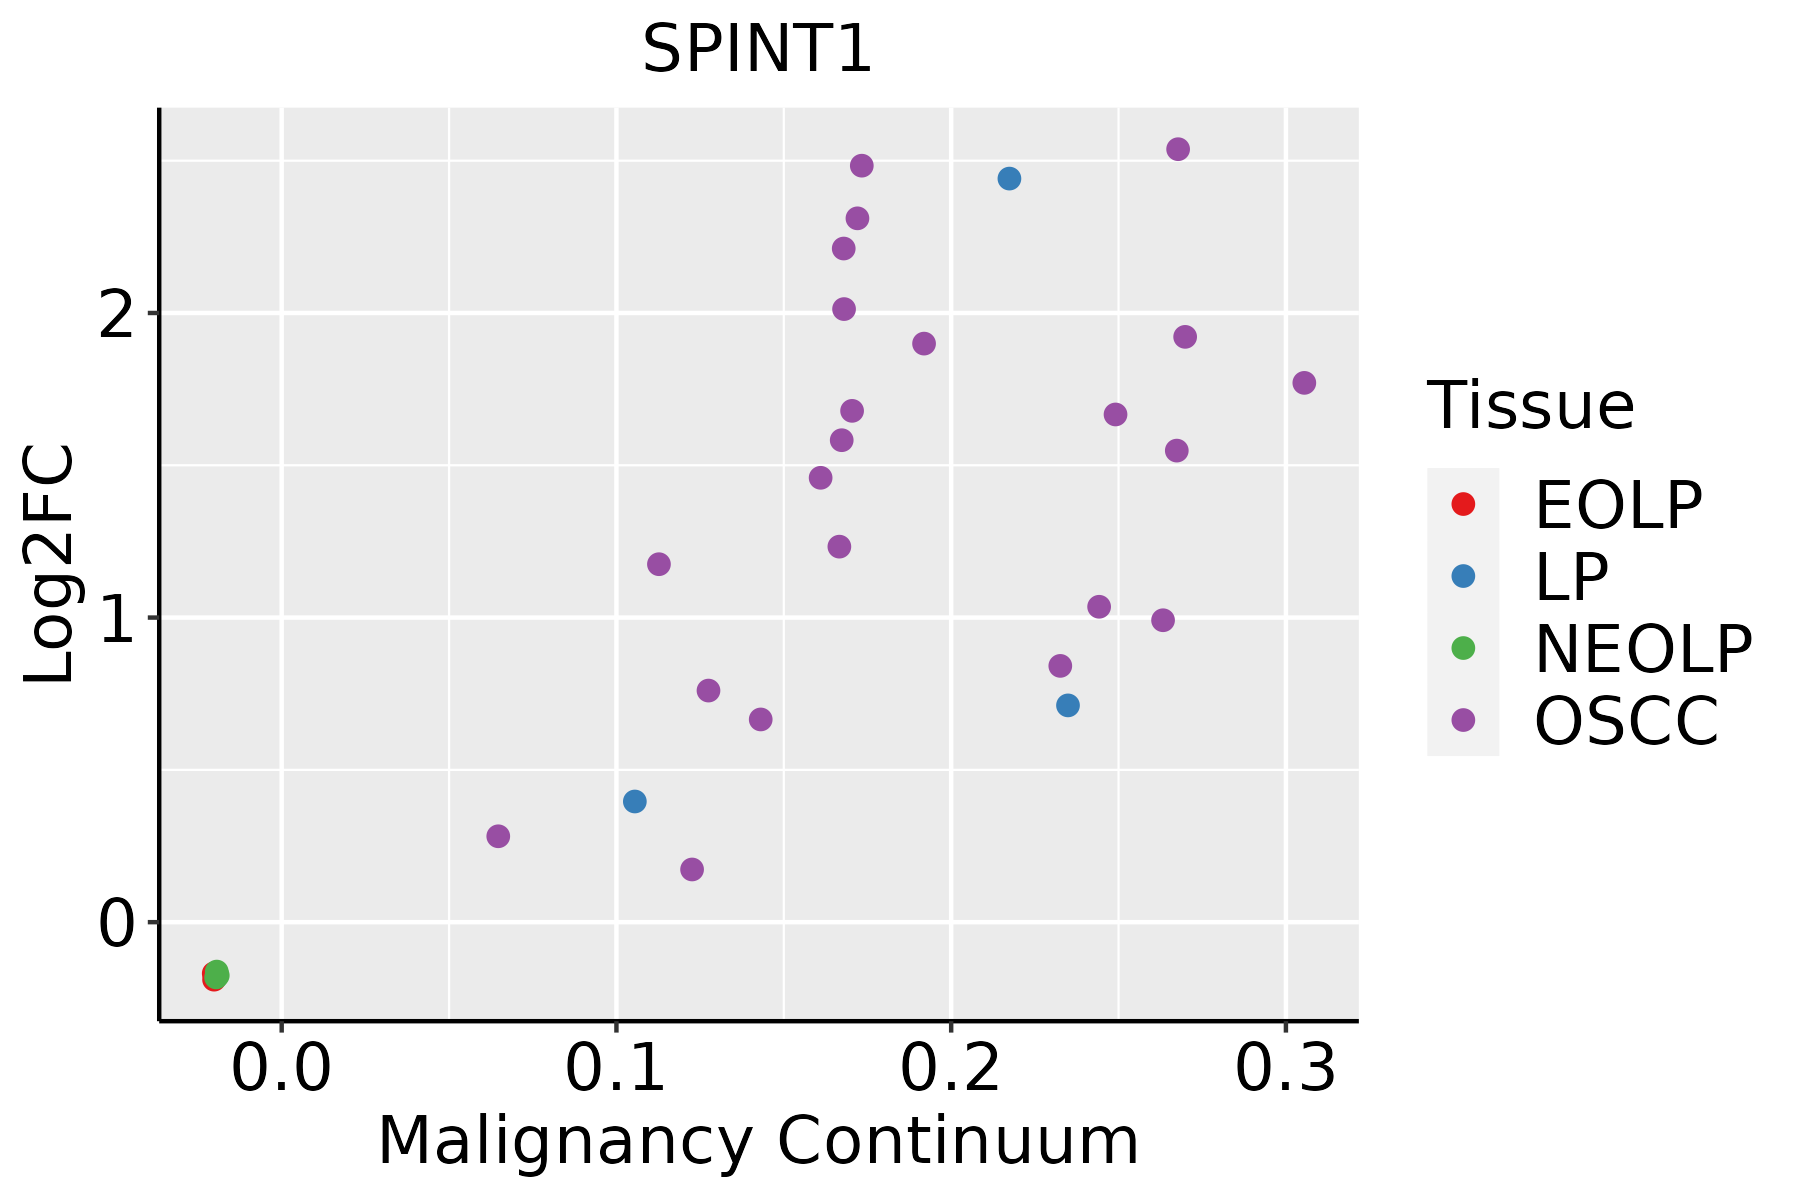 | EOLP: Erosive Oral lichen planus |
| LP: leukoplakia | ||
| NEOLP: Non-erosive oral lichen planus | ||
| OSCC: Oral squamous cell carcinoma | ||
| Prostate | 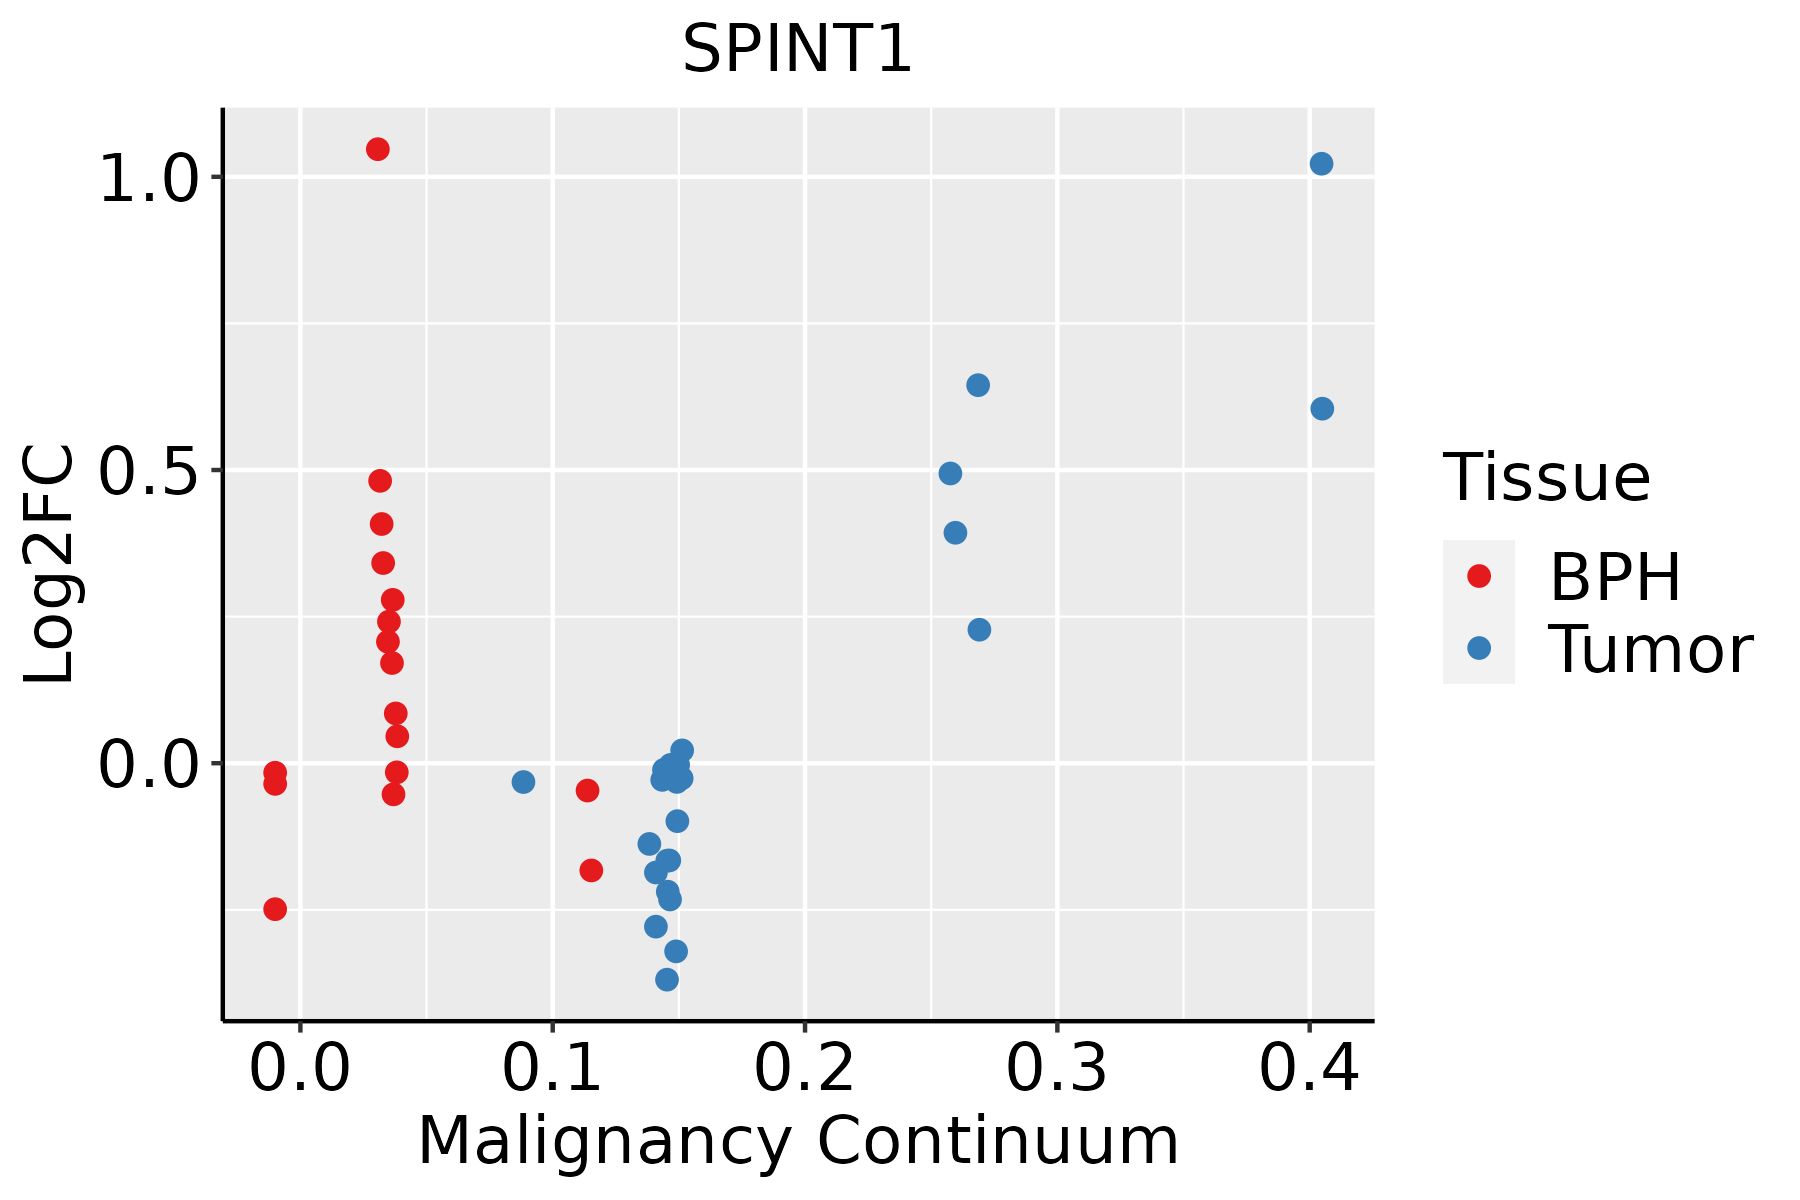 | BPH: Benign Prostatic Hyperplasia |
| Skin |  | AK: Actinic keratosis |
| cSCC: Cutaneous squamous cell carcinoma | ||
| SCCIS:squamous cell carcinoma in situ | ||
| Thyroid | 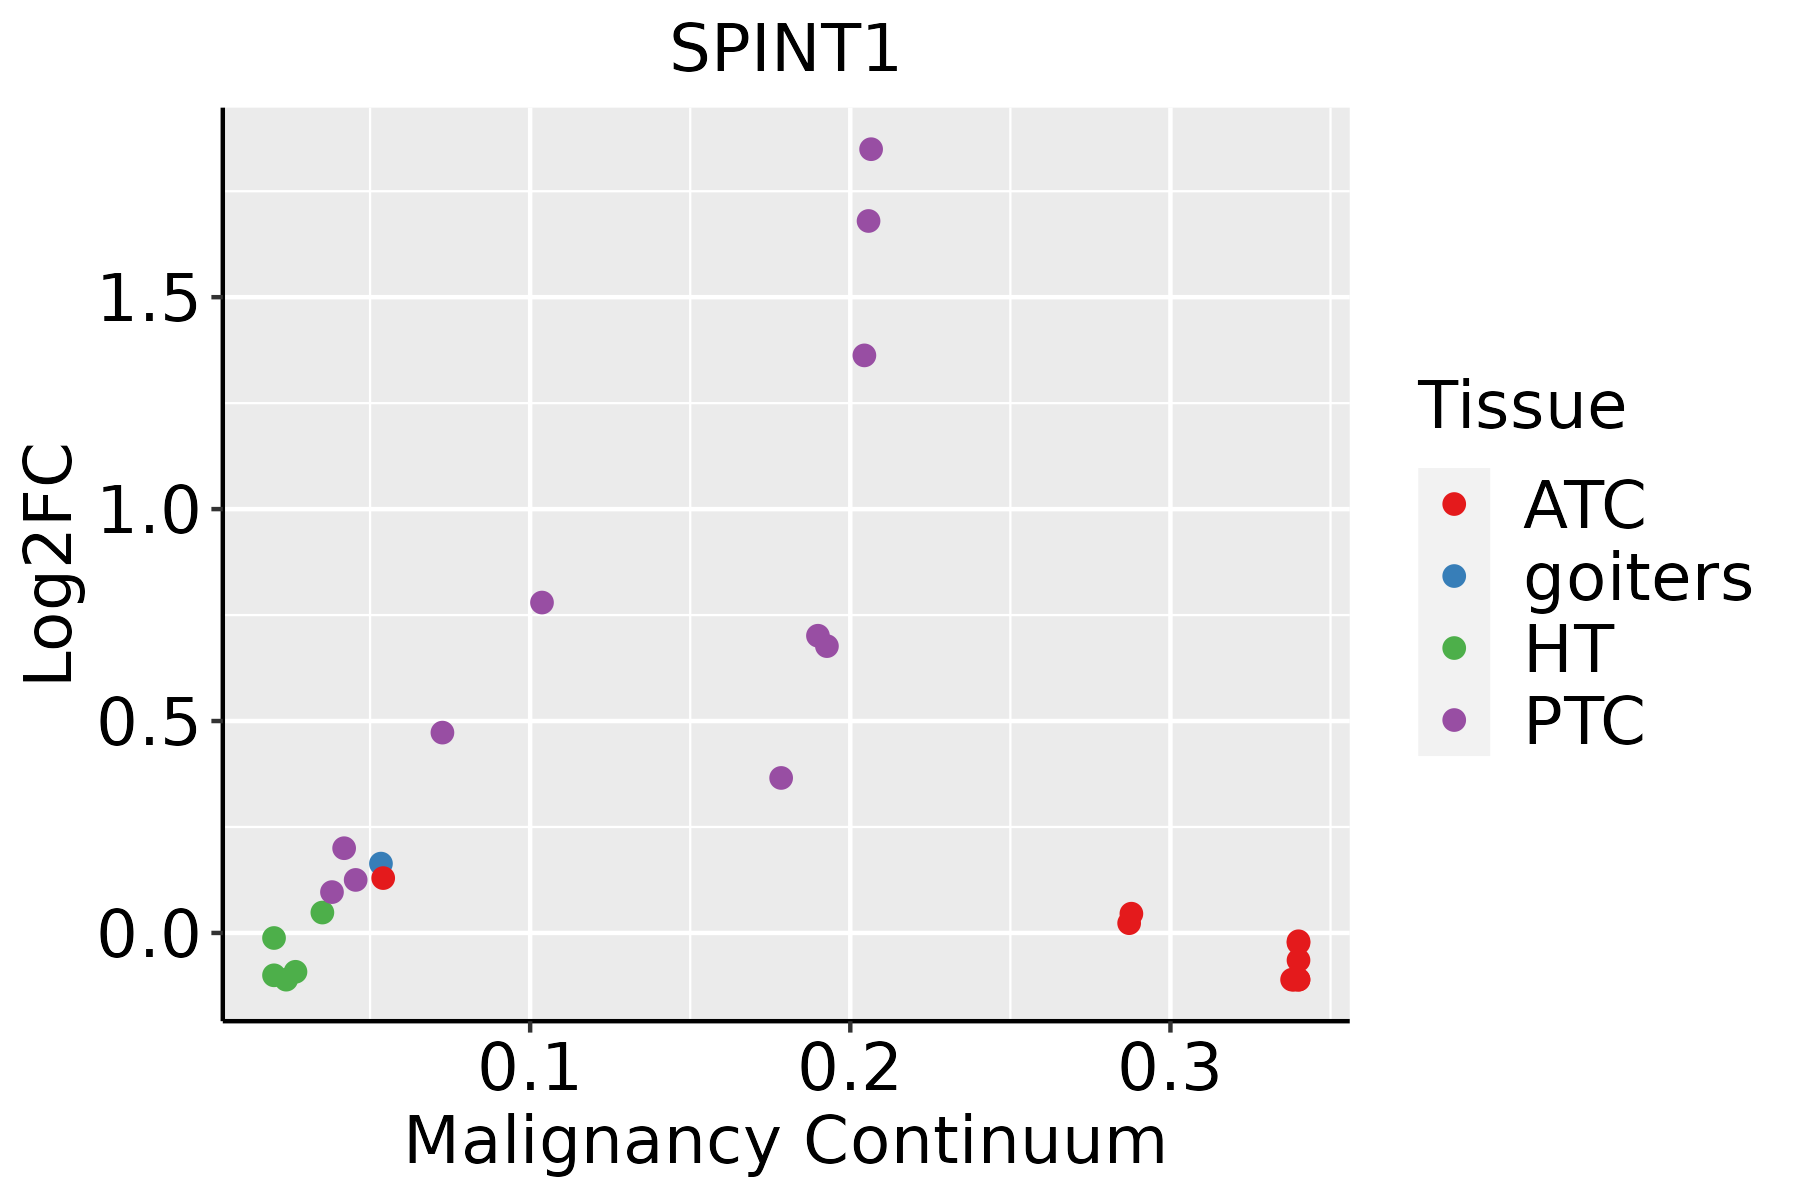 | ATC: Anaplastic thyroid cancer |
| HT: Hashimoto's thyroiditis | ||
| PTC: Papillary thyroid cancer |
| ∗log2FC in expression of this searched gene in stem-like cells from each diseased tissue sample relative to stem-like cells in normal samples in each tissue plotted against the malignancy continuum. Samples are colored based on if they are from different disease stage. |
Top |
Malignant transformation related pathway analysis |
| Find out the enriched GO biological processes and KEGG pathways involved in transition from healthy to precancer to cancer |
| Tissue | Disease Stage | Enriched GO biological Processes |
| Colorectum | AD |  |
| Colorectum | SER |  |
| Colorectum | MSS |  |
| Colorectum | MSI-H |  |
| Colorectum | FAP |  |
| ∗Top 15 enriched GO BP terms are showed in the bar plot of each disease state in each tissue. Each row represents a significant GO biological process which is colored according to the -log10(p.adjust). |
| Page: 1 2 3 4 5 6 7 8 9 |
| GO ID | Tissue | Disease Stage | Description | Gene Ratio | Bg Ratio | pvalue | p.adjust | Count |
| GO:005254710 | Cervix | CC | regulation of peptidase activity | 112/2311 | 461/18723 | 6.70e-13 | 3.08e-10 | 112 |
| GO:005254810 | Cervix | CC | regulation of endopeptidase activity | 103/2311 | 432/18723 | 1.89e-11 | 5.14e-09 | 103 |
| GO:004586110 | Cervix | CC | negative regulation of proteolysis | 80/2311 | 351/18723 | 2.88e-08 | 1.98e-06 | 80 |
| GO:00513469 | Cervix | CC | negative regulation of hydrolase activity | 81/2311 | 379/18723 | 4.27e-07 | 1.67e-05 | 81 |
| GO:00018908 | Cervix | CC | placenta development | 40/2311 | 144/18723 | 4.59e-07 | 1.77e-05 | 40 |
| GO:00104669 | Cervix | CC | negative regulation of peptidase activity | 60/2311 | 262/18723 | 1.27e-06 | 4.34e-05 | 60 |
| GO:00614588 | Cervix | CC | reproductive system development | 87/2311 | 427/18723 | 1.37e-06 | 4.55e-05 | 87 |
| GO:00486088 | Cervix | CC | reproductive structure development | 86/2311 | 424/18723 | 1.90e-06 | 5.97e-05 | 86 |
| GO:00107206 | Cervix | CC | positive regulation of cell development | 64/2311 | 298/18723 | 5.69e-06 | 1.41e-04 | 64 |
| GO:001095110 | Cervix | CC | negative regulation of endopeptidase activity | 56/2311 | 252/18723 | 7.43e-06 | 1.74e-04 | 56 |
| GO:00017018 | Cervix | CC | in utero embryonic development | 71/2311 | 367/18723 | 7.21e-05 | 1.00e-03 | 71 |
| GO:00018928 | Cervix | CC | embryonic placenta development | 22/2311 | 82/18723 | 2.89e-04 | 3.12e-03 | 22 |
| GO:00519603 | Cervix | CC | regulation of nervous system development | 77/2311 | 443/18723 | 1.13e-03 | 9.30e-03 | 77 |
| GO:00507676 | Cervix | CC | regulation of neurogenesis | 65/2311 | 364/18723 | 1.33e-03 | 1.05e-02 | 65 |
| GO:00351487 | Cervix | CC | tube formation | 31/2311 | 148/18723 | 2.07e-03 | 1.51e-02 | 31 |
| GO:00507694 | Cervix | CC | positive regulation of neurogenesis | 43/2311 | 225/18723 | 2.25e-03 | 1.61e-02 | 43 |
| GO:00018417 | Cervix | CC | neural tube formation | 23/2311 | 102/18723 | 2.80e-03 | 1.87e-02 | 23 |
| GO:00606696 | Cervix | CC | embryonic placenta morphogenesis | 9/2311 | 26/18723 | 2.85e-03 | 1.90e-02 | 9 |
| GO:00607136 | Cervix | CC | labyrinthine layer morphogenesis | 8/2311 | 22/18723 | 3.43e-03 | 2.22e-02 | 8 |
| GO:00605626 | Cervix | CC | epithelial tube morphogenesis | 57/2311 | 325/18723 | 3.79e-03 | 2.41e-02 | 57 |
| Page: 1 2 3 4 5 6 7 8 9 10 11 12 13 14 15 16 17 18 19 20 21 22 23 24 25 26 27 |
| Pathway ID | Tissue | Disease Stage | Description | Gene Ratio | Bg Ratio | pvalue | p.adjust | qvalue | Count |
| hsa052157 | Cervix | CC | Prostate cancer | 27/1267 | 97/8465 | 7.54e-04 | 3.39e-03 | 2.01e-03 | 27 |
| hsa0521512 | Cervix | CC | Prostate cancer | 27/1267 | 97/8465 | 7.54e-04 | 3.39e-03 | 2.01e-03 | 27 |
| hsa05215 | Colorectum | AD | Prostate cancer | 35/2092 | 97/8465 | 7.95e-03 | 3.13e-02 | 2.00e-02 | 35 |
| hsa052151 | Colorectum | AD | Prostate cancer | 35/2092 | 97/8465 | 7.95e-03 | 3.13e-02 | 2.00e-02 | 35 |
| hsa052152 | Colorectum | FAP | Prostate cancer | 28/1404 | 97/8465 | 1.67e-03 | 8.57e-03 | 5.21e-03 | 28 |
| hsa05202 | Colorectum | FAP | Transcriptional misregulation in cancer | 45/1404 | 193/8465 | 9.19e-03 | 3.33e-02 | 2.03e-02 | 45 |
| hsa052153 | Colorectum | FAP | Prostate cancer | 28/1404 | 97/8465 | 1.67e-03 | 8.57e-03 | 5.21e-03 | 28 |
| hsa052021 | Colorectum | FAP | Transcriptional misregulation in cancer | 45/1404 | 193/8465 | 9.19e-03 | 3.33e-02 | 2.03e-02 | 45 |
| hsa0521516 | Esophagus | ESCC | Prostate cancer | 72/4205 | 97/8465 | 6.12e-07 | 4.10e-06 | 2.10e-06 | 72 |
| hsa052028 | Esophagus | ESCC | Transcriptional misregulation in cancer | 116/4205 | 193/8465 | 2.08e-03 | 5.95e-03 | 3.05e-03 | 116 |
| hsa0521517 | Esophagus | ESCC | Prostate cancer | 72/4205 | 97/8465 | 6.12e-07 | 4.10e-06 | 2.10e-06 | 72 |
| hsa0520213 | Esophagus | ESCC | Transcriptional misregulation in cancer | 116/4205 | 193/8465 | 2.08e-03 | 5.95e-03 | 3.05e-03 | 116 |
| hsa0521510 | Oral cavity | OSCC | Prostate cancer | 66/3704 | 97/8465 | 1.05e-06 | 5.89e-06 | 3.00e-06 | 66 |
| hsa0521515 | Oral cavity | OSCC | Prostate cancer | 66/3704 | 97/8465 | 1.05e-06 | 5.89e-06 | 3.00e-06 | 66 |
| hsa0521524 | Oral cavity | EOLP | Prostate cancer | 31/1218 | 97/8465 | 7.90e-06 | 4.73e-05 | 2.79e-05 | 31 |
| hsa0521534 | Oral cavity | EOLP | Prostate cancer | 31/1218 | 97/8465 | 7.90e-06 | 4.73e-05 | 2.79e-05 | 31 |
| hsa0521542 | Oral cavity | NEOLP | Prostate cancer | 28/1112 | 97/8465 | 3.15e-05 | 2.57e-04 | 1.62e-04 | 28 |
| hsa0521552 | Oral cavity | NEOLP | Prostate cancer | 28/1112 | 97/8465 | 3.15e-05 | 2.57e-04 | 1.62e-04 | 28 |
| hsa052159 | Prostate | BPH | Prostate cancer | 48/1718 | 97/8465 | 1.08e-10 | 1.87e-09 | 1.16e-09 | 48 |
| hsa052027 | Prostate | BPH | Transcriptional misregulation in cancer | 53/1718 | 193/8465 | 9.56e-03 | 2.92e-02 | 1.81e-02 | 53 |
| Page: 1 2 |
Top |
Cell-cell communication analysis |
| Identification of potential cell-cell interactions between two cell types and their ligand-receptor pairs for different disease states |
| Ligand | Receptor | LRpair | Pathway | Tissue | Disease Stage |
| Page: 1 |
Top |
Single-cell gene regulatory network inference analysis |
| Find out the significant the regulons (TFs) and the target genes of each regulon across cell types for different disease states |
| TF | Cell Type | Tissue | Disease Stage | Target Gene | RSS | Regulon Activity |
| ∗The dot plots of a searched regulon are shown for all cell subpopulations in each disease state of each tissue based on the regulon specific score inferred using pySCENIC and by calculating the average expression. |
| Page: 1 |
Top |
Somatic mutation of malignant transformation related genes |
| Annotation of somatic variants for genes involved in malignant transformation |
| Hugo Symbol | Variant Class | Variant Classification | dbSNP RS | HGVSc | HGVSp | HGVSp Short | SWISSPROT | BIOTYPE | SIFT | PolyPhen | Tumor Sample Barcode | Tissue | Histology | Sex | Age | Stage | Therapy Types | Drugs | Outcome |
| SPINT1 | SNV | Missense_Mutation | novel | c.529G>A | p.Glu177Lys | p.E177K | O43278 | protein_coding | deleterious(0.03) | benign(0.038) | TCGA-AN-A046-01 | Breast | breast invasive carcinoma | Female | >=65 | I/II | Unknown | Unknown | SD |
| SPINT1 | SNV | Missense_Mutation | c.562N>T | p.Asp188Tyr | p.D188Y | O43278 | protein_coding | deleterious(0.02) | probably_damaging(0.915) | TCGA-E2-A1LA-01 | Breast | breast invasive carcinoma | Female | <65 | I/II | Hormone Therapy | arimidex | SD | |
| SPINT1 | insertion | Nonsense_Mutation | novel | c.1318_1319insAGTTTA | p.Ser440delinsTer | p.S440delins* | O43278 | protein_coding | TCGA-AN-A03X-01 | Breast | breast invasive carcinoma | Female | >=65 | I/II | Unknown | Unknown | SD | ||
| SPINT1 | insertion | Frame_Shift_Ins | novel | c.1321_1322insTTGTGCCTACAGTTATT | p.Cys441PhefsTer18 | p.C441Ffs*18 | O43278 | protein_coding | TCGA-AN-A03X-01 | Breast | breast invasive carcinoma | Female | >=65 | I/II | Unknown | Unknown | SD | ||
| SPINT1 | deletion | Frame_Shift_Del | novel | c.1547delN | p.Asp516AlafsTer155 | p.D516Afs*155 | O43278 | protein_coding | TCGA-D8-A27V-01 | Breast | breast invasive carcinoma | Female | <65 | I/II | Hormone Therapy | tamoxiphen | SD | ||
| SPINT1 | SNV | Missense_Mutation | c.1552N>A | p.Glu518Lys | p.E518K | O43278 | protein_coding | deleterious(0.04) | probably_damaging(0.994) | TCGA-UC-A7PF-01 | Cervix | cervical & endocervical cancer | Female | <65 | I/II | Unknown | Unknown | SD | |
| SPINT1 | SNV | Missense_Mutation | novel | c.1004N>A | p.Cys335Tyr | p.C335Y | O43278 | protein_coding | deleterious(0) | probably_damaging(0.993) | TCGA-VS-A8EL-01 | Cervix | cervical & endocervical cancer | Female | <65 | I/II | Chemotherapy | cisplatin | CR |
| SPINT1 | SNV | Missense_Mutation | rs751324782 | c.1103N>T | p.Ala368Val | p.A368V | O43278 | protein_coding | tolerated(0.43) | benign(0.031) | TCGA-AZ-4315-01 | Colorectum | colon adenocarcinoma | Male | <65 | I/II | Unknown | Unknown | SD |
| SPINT1 | SNV | Missense_Mutation | c.1525T>A | p.Ser509Thr | p.S509T | O43278 | protein_coding | tolerated(0.19) | possibly_damaging(0.452) | TCGA-AZ-6598-01 | Colorectum | colon adenocarcinoma | Female | >=65 | I/II | Unknown | Unknown | SD | |
| SPINT1 | SNV | Missense_Mutation | c.1310G>A | p.Cys437Tyr | p.C437Y | O43278 | protein_coding | deleterious(0) | probably_damaging(1) | TCGA-CK-4951-01 | Colorectum | colon adenocarcinoma | Female | >=65 | I/II | Unknown | Unknown | PD |
| Page: 1 2 3 4 |
Top |
Related drugs of malignant transformation related genes |
| Identification of chemicals and drugs interact with genes involved in malignant transfromation |
| (DGIdb 4.0) |
| Entrez ID | Symbol | Category | Interaction Types | Drug Claim Name | Drug Name | PMIDs |
| 6692 | SPINT1 | PROTEASE INHIBITOR, DRUGGABLE GENOME | SURAMIN | SURAMIN | 15590895 |
| Page: 1 |

Copyright 2023-Present -The University of Texas Health Science Center at Houston |