
|
|||||
|
 | |
| |
| |
| |
| |
| |
|
Gene: SPINK6 |
Gene summary for SPINK6 |
| Gene information | Species | Human | Gene symbol | SPINK6 | Gene ID | 404203 |
| Gene name | serine peptidase inhibitor Kazal type 6 | |
| Gene Alias | BUSI2 | |
| Cytomap | 5q32 | |
| Gene Type | protein-coding | GO ID | GO:0006508 | UniProtAcc | Q6UWN8 |
Top |
Malignant transformation analysis |
| Identification of the aberrant gene expression in precancerous and cancerous lesions by comparing the gene expression of stem-like cells in diseased tissues with normal stem cells |
| Entrez ID | Symbol | Replicates | Species | Organ | Tissue | Adj P-value | Log2FC | Malignancy |
| 404203 | SPINK6 | C04 | Human | Oral cavity | OSCC | 1.49e-14 | 1.03e+00 | 0.2633 |
| 404203 | SPINK6 | C06 | Human | Oral cavity | OSCC | 2.06e-09 | 3.38e+00 | 0.2699 |
| 404203 | SPINK6 | LP17 | Human | Oral cavity | LP | 4.44e-03 | 4.83e-01 | 0.2349 |
| 404203 | SPINK6 | SYSMH2 | Human | Oral cavity | OSCC | 8.35e-04 | 6.48e-01 | 0.2326 |
| 404203 | SPINK6 | SYSMH3 | Human | Oral cavity | OSCC | 1.77e-03 | 2.90e-01 | 0.2442 |
| 404203 | SPINK6 | P5_S10_cSCC | Human | Skin | cSCC | 1.08e-12 | 3.04e-01 | -0.299 |
| 404203 | SPINK6 | P1_cSCC | Human | Skin | cSCC | 5.99e-12 | 8.52e-01 | 0.0292 |
| 404203 | SPINK6 | P2_cSCC | Human | Skin | cSCC | 6.33e-06 | 7.26e-01 | -0.024 |
| 404203 | SPINK6 | P4_cSCC | Human | Skin | cSCC | 7.47e-09 | 9.58e-01 | -0.00290000000000005 |
| 404203 | SPINK6 | P10_cSCC | Human | Skin | cSCC | 1.79e-28 | 2.03e+00 | 0.1017 |
| Page: 1 |
| Tissue | Expression Dynamics | Abbreviation |
| Oral Cavity | 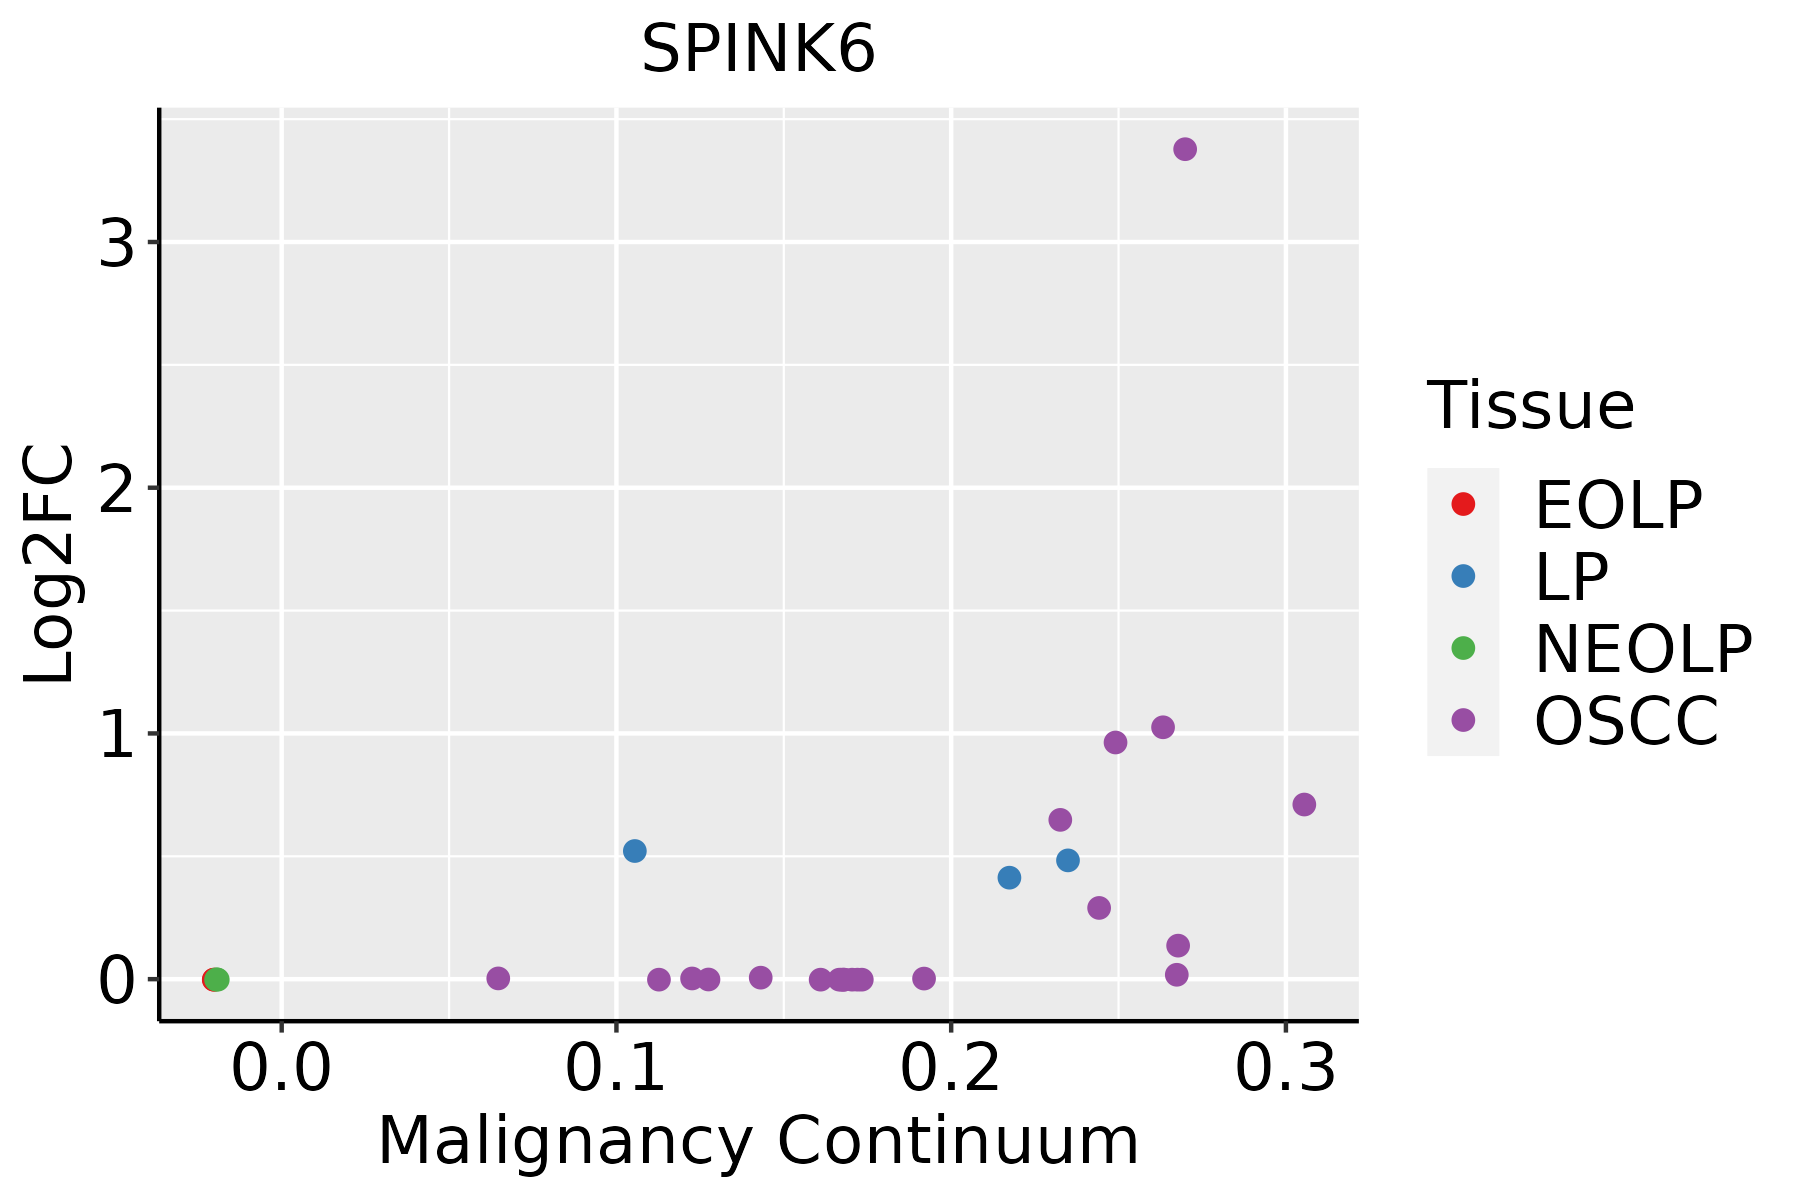 | EOLP: Erosive Oral lichen planus |
| LP: leukoplakia | ||
| NEOLP: Non-erosive oral lichen planus | ||
| OSCC: Oral squamous cell carcinoma | ||
| Skin |  | AK: Actinic keratosis |
| cSCC: Cutaneous squamous cell carcinoma | ||
| SCCIS:squamous cell carcinoma in situ |
| ∗log2FC in expression of this searched gene in stem-like cells from each diseased tissue sample relative to stem-like cells in normal samples in each tissue plotted against the malignancy continuum. Samples are colored based on if they are from different disease stage. |
Top |
Malignant transformation related pathway analysis |
| Find out the enriched GO biological processes and KEGG pathways involved in transition from healthy to precancer to cancer |
| Tissue | Disease Stage | Enriched GO biological Processes |
| Colorectum | AD |  |
| Colorectum | SER |  |
| Colorectum | MSS |  |
| Colorectum | MSI-H |  |
| Colorectum | FAP |  |
| ∗Top 15 enriched GO BP terms are showed in the bar plot of each disease state in each tissue. Each row represents a significant GO biological process which is colored according to the -log10(p.adjust). |
| Page: 1 2 3 4 5 6 7 8 9 |
| GO ID | Tissue | Disease Stage | Description | Gene Ratio | Bg Ratio | pvalue | p.adjust | Count |
| GO:005254720 | Oral cavity | OSCC | regulation of peptidase activity | 255/7305 | 461/18723 | 5.78e-13 | 2.75e-11 | 255 |
| GO:005254820 | Oral cavity | OSCC | regulation of endopeptidase activity | 235/7305 | 432/18723 | 4.35e-11 | 1.40e-09 | 235 |
| GO:004586120 | Oral cavity | OSCC | negative regulation of proteolysis | 181/7305 | 351/18723 | 1.01e-06 | 1.37e-05 | 181 |
| GO:005134618 | Oral cavity | OSCC | negative regulation of hydrolase activity | 182/7305 | 379/18723 | 1.98e-04 | 1.32e-03 | 182 |
| GO:001095117 | Oral cavity | OSCC | negative regulation of endopeptidase activity | 126/7305 | 252/18723 | 2.37e-04 | 1.54e-03 | 126 |
| GO:001046618 | Oral cavity | OSCC | negative regulation of peptidase activity | 130/7305 | 262/18723 | 2.89e-04 | 1.82e-03 | 130 |
| GO:0052547110 | Oral cavity | LP | regulation of peptidase activity | 177/4623 | 461/18723 | 3.01e-11 | 2.00e-09 | 177 |
| GO:0052548110 | Oral cavity | LP | regulation of endopeptidase activity | 164/4623 | 432/18723 | 4.33e-10 | 2.20e-08 | 164 |
| GO:0045861110 | Oral cavity | LP | negative regulation of proteolysis | 122/4623 | 351/18723 | 1.32e-05 | 2.34e-04 | 122 |
| GO:001046619 | Oral cavity | LP | negative regulation of peptidase activity | 87/4623 | 262/18723 | 1.12e-03 | 9.19e-03 | 87 |
| GO:005134619 | Oral cavity | LP | negative regulation of hydrolase activity | 120/4623 | 379/18723 | 1.16e-03 | 9.48e-03 | 120 |
| GO:001095118 | Oral cavity | LP | negative regulation of endopeptidase activity | 83/4623 | 252/18723 | 1.86e-03 | 1.39e-02 | 83 |
| GO:005254728 | Skin | cSCC | regulation of peptidase activity | 177/4864 | 461/18723 | 2.21e-09 | 8.02e-08 | 177 |
| GO:005254828 | Skin | cSCC | regulation of endopeptidase activity | 165/4864 | 432/18723 | 1.18e-08 | 3.63e-07 | 165 |
| GO:004586128 | Skin | cSCC | negative regulation of proteolysis | 128/4864 | 351/18723 | 7.95e-06 | 1.09e-04 | 128 |
| GO:005134627 | Skin | cSCC | negative regulation of hydrolase activity | 130/4864 | 379/18723 | 1.74e-04 | 1.49e-03 | 130 |
| GO:001095125 | Skin | cSCC | negative regulation of endopeptidase activity | 89/4864 | 252/18723 | 6.05e-04 | 4.38e-03 | 89 |
| GO:001046626 | Skin | cSCC | negative regulation of peptidase activity | 91/4864 | 262/18723 | 9.73e-04 | 6.58e-03 | 91 |
| Page: 1 |
| Pathway ID | Tissue | Disease Stage | Description | Gene Ratio | Bg Ratio | pvalue | p.adjust | qvalue | Count |
| Page: 1 |
Top |
Cell-cell communication analysis |
| Identification of potential cell-cell interactions between two cell types and their ligand-receptor pairs for different disease states |
| Ligand | Receptor | LRpair | Pathway | Tissue | Disease Stage |
| Page: 1 |
Top |
Single-cell gene regulatory network inference analysis |
| Find out the significant the regulons (TFs) and the target genes of each regulon across cell types for different disease states |
| TF | Cell Type | Tissue | Disease Stage | Target Gene | RSS | Regulon Activity |
| ∗The dot plots of a searched regulon are shown for all cell subpopulations in each disease state of each tissue based on the regulon specific score inferred using pySCENIC and by calculating the average expression. |
| Page: 1 |
Top |
Somatic mutation of malignant transformation related genes |
| Annotation of somatic variants for genes involved in malignant transformation |
| Hugo Symbol | Variant Class | Variant Classification | dbSNP RS | HGVSc | HGVSp | HGVSp Short | SWISSPROT | BIOTYPE | SIFT | PolyPhen | Tumor Sample Barcode | Tissue | Histology | Sex | Age | Stage | Therapy Types | Drugs | Outcome |
| SPINK6 | SNV | Missense_Mutation | novel | c.134N>G | p.Asn45Ser | p.N45S | Q6UWN8 | protein_coding | deleterious(0.03) | benign(0.396) | TCGA-CA-6717-01 | Colorectum | colon adenocarcinoma | Male | <65 | I/II | Chemotherapy | oxaliplatin | CR |
| SPINK6 | SNV | Missense_Mutation | rs201811749 | c.212N>G | p.Lys71Arg | p.K71R | Q6UWN8 | protein_coding | tolerated(0.09) | probably_damaging(0.994) | TCGA-CA-6717-01 | Colorectum | colon adenocarcinoma | Male | <65 | I/II | Chemotherapy | oxaliplatin | CR |
| SPINK6 | SNV | Missense_Mutation | c.160A>G | p.Thr54Ala | p.T54A | Q6UWN8 | protein_coding | deleterious(0) | probably_damaging(0.994) | TCGA-CM-4747-01 | Colorectum | colon adenocarcinoma | Male | <65 | I/II | Chemotherapy | fluorouracil | SD | |
| SPINK6 | SNV | Missense_Mutation | rs190006161 | c.173N>C | p.Lys58Thr | p.K58T | Q6UWN8 | protein_coding | deleterious(0) | possibly_damaging(0.874) | TCGA-AJ-A5DW-01 | Endometrium | uterine corpus endometrioid carcinoma | Female | <65 | I/II | Unknown | Unknown | SD |
| SPINK6 | SNV | Missense_Mutation | c.62N>C | p.Val21Ala | p.V21A | Q6UWN8 | protein_coding | tolerated(0.64) | benign(0.001) | TCGA-AX-A05Z-01 | Endometrium | uterine corpus endometrioid carcinoma | Female | <65 | III/IV | Chemotherapy | adriamycin | SD | |
| SPINK6 | SNV | Missense_Mutation | c.179N>T | p.Ala60Val | p.A60V | Q6UWN8 | protein_coding | deleterious(0.01) | benign(0.259) | TCGA-DD-A3A9-01 | Liver | liver hepatocellular carcinoma | Female | <65 | I/II | Unknown | Unknown | PD | |
| SPINK6 | SNV | Missense_Mutation | c.184N>C | p.Cys62Arg | p.C62R | Q6UWN8 | protein_coding | deleterious(0) | probably_damaging(0.998) | TCGA-DD-A73B-01 | Liver | liver hepatocellular carcinoma | Female | >=65 | I/II | Unknown | Unknown | PD | |
| SPINK6 | SNV | Missense_Mutation | novel | c.121N>T | p.Thr41Ser | p.T41S | Q6UWN8 | protein_coding | deleterious(0.04) | probably_damaging(0.994) | TCGA-43-2581-01 | Lung | lung squamous cell carcinoma | Female | <65 | III/IV | Chemotherapy | cisplatin | SD |
| SPINK6 | SNV | Missense_Mutation | rs760970575 | c.208N>A | p.Gly70Arg | p.G70R | Q6UWN8 | protein_coding | deleterious(0) | probably_damaging(1) | TCGA-56-A49D-01 | Lung | lung squamous cell carcinoma | Male | >=65 | III/IV | Unknown | Unknown | SD |
| Page: 1 |
Top |
Related drugs of malignant transformation related genes |
| Identification of chemicals and drugs interact with genes involved in malignant transfromation |
| (DGIdb 4.0) |
| Entrez ID | Symbol | Category | Interaction Types | Drug Claim Name | Drug Name | PMIDs |
| Page: 1 |

Copyright 2023-Present -The University of Texas Health Science Center at Houston |