Schematic overview of the cellular and molecular mechanisms involved in the cancer progression, including the proposed cellular and molecular mechanisms in cancer cells trajectory. AT1: alveolar type 1 cells; AT2: alveolar type 2 cells; AAH: atypical adenomatous hyperplasia; AIS: adenocarcinoma in situ; MIA: minimally invasive adenocarcinoma; IA: invasive adenocarcinoma; EMT: epithelial-mesenchymal transition

Home

Download

Statistics

Help

Contact

Center for Computational Systems Medicine
leaf

Gene summary

leaf

Malignant transformation analysis

leaf

Malignant transformation related pathway analysis

leaf

Cell-cell communication analysis

leaf

Single-cell gene regulatory network inference analysis

leaf

Somatic mutation of malignant transformation related genes

leaf

Related drugs of malignant transformation related genes

Gene: SPINK5

Gene summary for SPINK5

check button Gene summary.

Gene informationSpeciesHuman
Gene symbol

SPINK5

Gene ID

11005

Gene nameserine peptidase inhibitor Kazal type 5
Gene AliasLEKTI
Cytomap5q32
Gene Typeprotein-coding
GO ID

GO:0001525

UniProtAcc

Q9NQ38


Top

Malignant transformation analysis

check button Identification of the aberrant gene expression in precancerous and cancerous lesions by comparing the gene expression of stem-like cells in diseased tissues with normal stem cells
check button Malignant transformation involving gene list.
Entrez IDSymbolReplicatesSpeciesOrganTissueAdj P-valueLog2FCMalignancy
11005SPINK5HTA11_2487_2000001011HumanColorectumSER7.07e-032.48e-01-0.1808
11005SPINK5HTA11_347_2000001011HumanColorectumAD5.12e-032.15e-01-0.1954
11005SPINK5HTA11_411_2000001011HumanColorectumSER8.77e-049.01e-01-0.2602
11005SPINK5HTA11_2112_2000001011HumanColorectumSER2.95e-071.03e+00-0.2196
11005SPINK5HTA11_696_2000001011HumanColorectumAD5.72e-033.26e-01-0.1464
11005SPINK5HTA11_2992_2000001011HumanColorectumSER1.94e-047.88e-01-0.1706
11005SPINK5HTA11_5212_2000001011HumanColorectumAD6.75e-131.13e+00-0.2061
11005SPINK5A002-C-016HumanColorectumFAP3.61e-02-7.30e-020.0521
11005SPINK5LZE4THumanEsophagusESCC6.25e-041.04e-010.0811
11005SPINK5P2T-EHumanEsophagusESCC8.19e-181.07e-010.1177
11005SPINK5P4T-EHumanEsophagusESCC1.11e-022.51e-020.1323
11005SPINK5P8T-EHumanEsophagusESCC7.58e-036.02e-020.0889
11005SPINK5P9T-EHumanEsophagusESCC1.75e-044.59e-020.1131
11005SPINK5P12T-EHumanEsophagusESCC1.04e-073.19e-010.1122
11005SPINK5P15T-EHumanEsophagusESCC6.33e-053.89e-020.1149
11005SPINK5P26T-EHumanEsophagusESCC9.32e-054.63e-020.1276
11005SPINK5P27T-EHumanEsophagusESCC1.21e-064.48e-020.1055
11005SPINK5P28T-EHumanEsophagusESCC1.83e-032.62e-010.1149
11005SPINK5P30T-EHumanEsophagusESCC7.21e-032.33e-010.137
11005SPINK5P48T-EHumanEsophagusESCC9.49e-075.92e-020.0959
Page: 1 2 3 

check button Transcriptomic changes along malignancy continuum.
TissueExpression DynamicsAbbreviation
Colorectum (GSE201348)The image shows the transcriptomic changes along malignancy continuum.log2FC in expression of this searched gene in stem-like cells from each diseased tissue sample relative to stem-like cells in normal samples in each tissue plotted against the malignancy continuum. Samples are colored based on if they are from different disease stage.FAP: Familial adenomatous polyposis
CRC: Colorectal cancer
Colorectum (HTA11)The image shows the transcriptomic changes along malignancy continuum.log2FC in expression of this searched gene in stem-like cells from each diseased tissue sample relative to stem-like cells in normal samples in each tissue plotted against the malignancy continuum. Samples are colored based on if they are from different disease stage.AD: Adenomas
SER: Sessile serrated lesions
MSI-H: Microsatellite-high colorectal cancer
MSS: Microsatellite stable colorectal cancer
EsophagusThe image shows the transcriptomic changes along malignancy continuum.log2FC in expression of this searched gene in stem-like cells from each diseased tissue sample relative to stem-like cells in normal samples in each tissue plotted against the malignancy continuum. Samples are colored based on if they are from different disease stage.
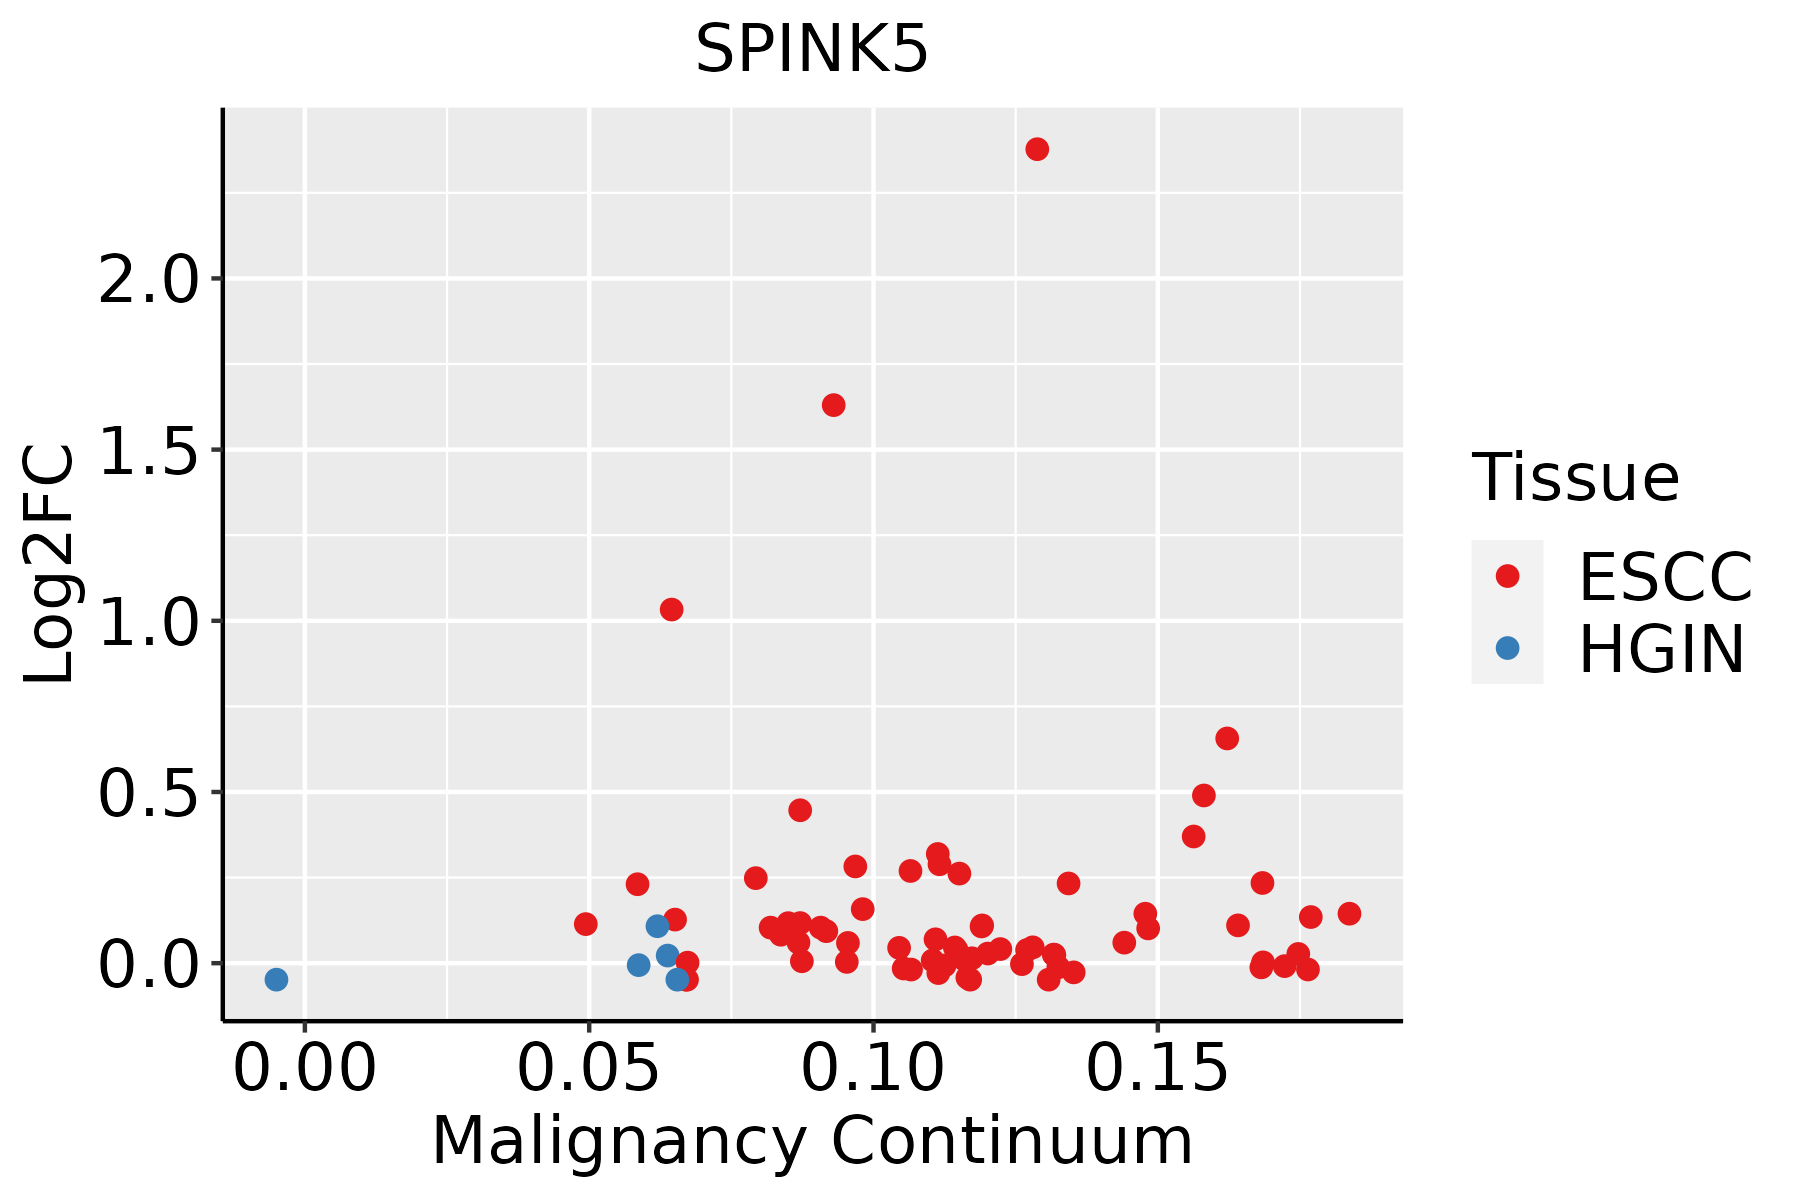
ESCC: Esophageal squamous cell carcinoma
HGIN: High-grade intraepithelial neoplasias
LGIN: Low-grade intraepithelial neoplasias
LiverThe image shows the transcriptomic changes along malignancy continuum.log2FC in expression of this searched gene in stem-like cells from each diseased tissue sample relative to stem-like cells in normal samples in each tissue plotted against the malignancy continuum. Samples are colored based on if they are from different disease stage.
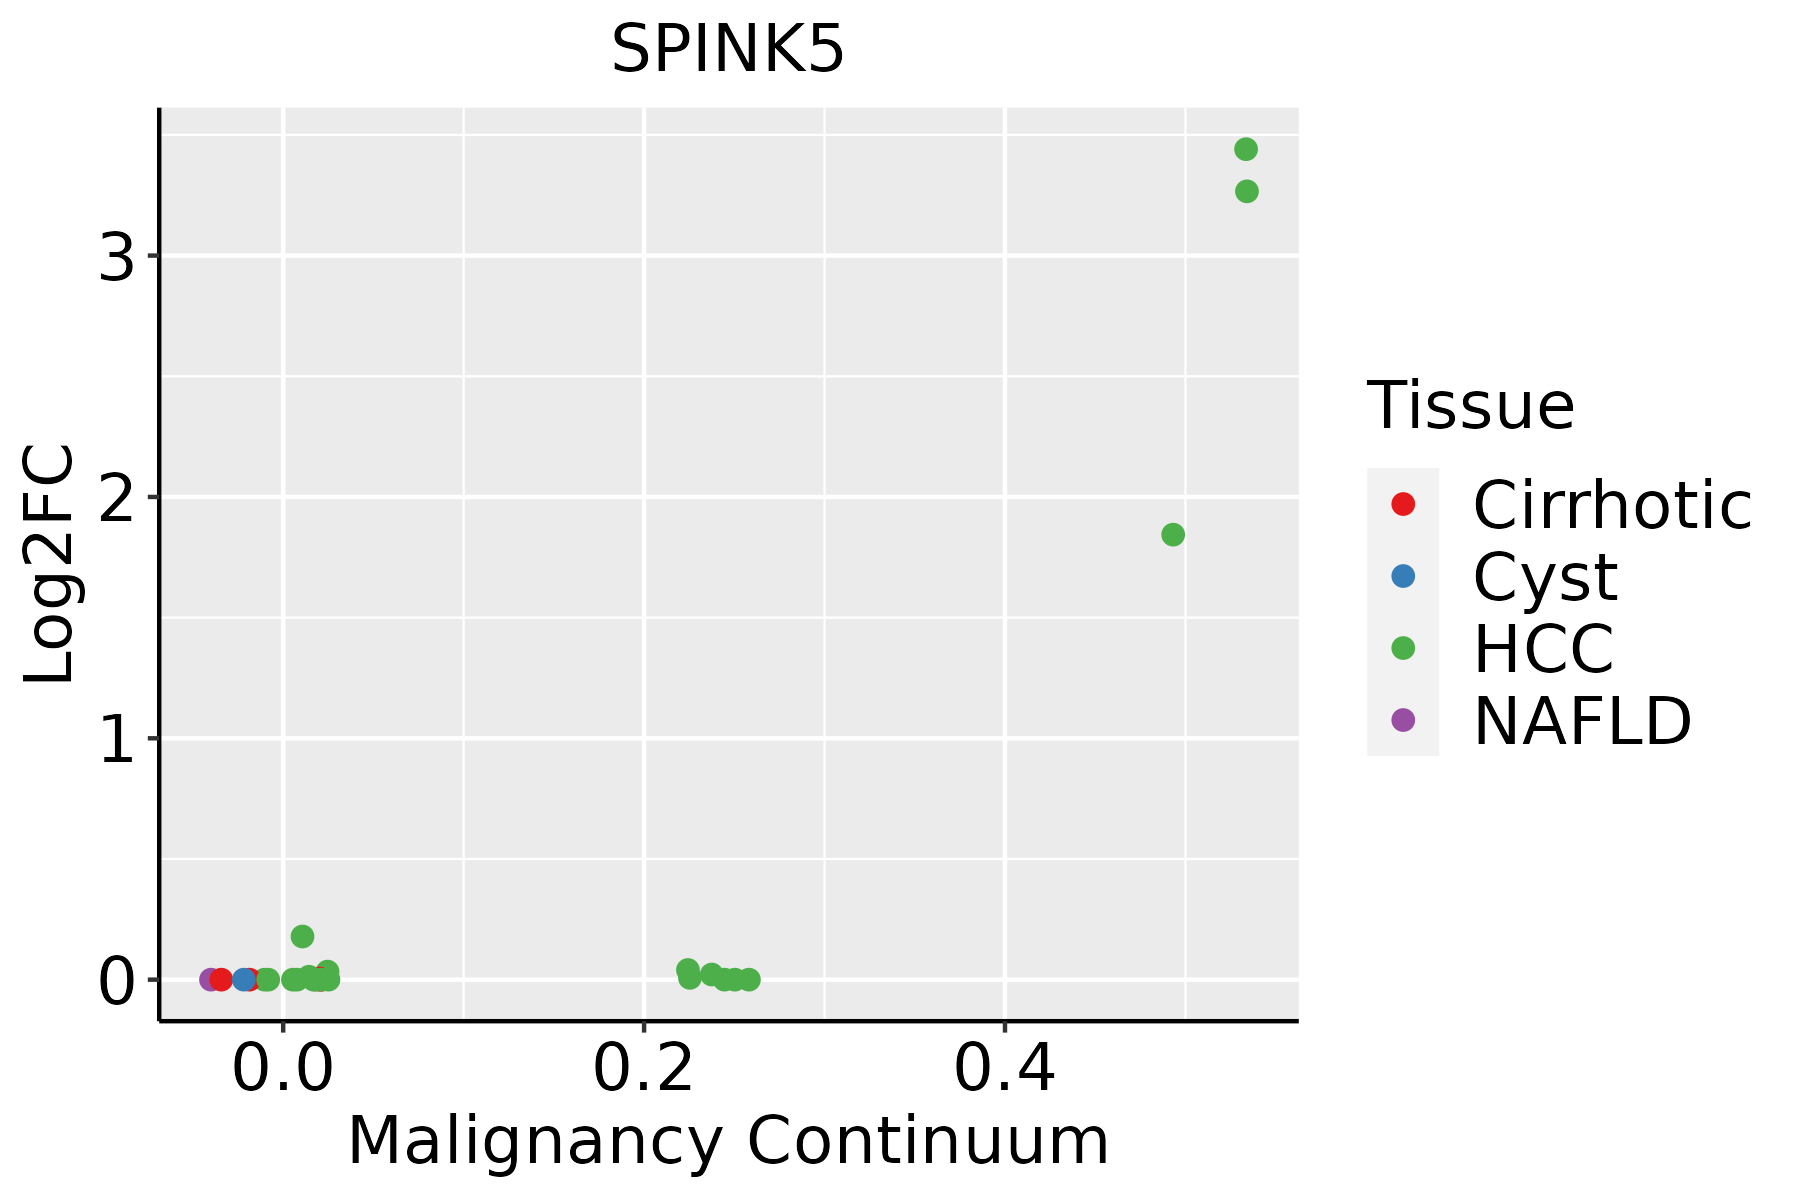
HCC: Hepatocellular carcinoma
NAFLD: Non-alcoholic fatty liver disease
Oral CavityThe image shows the transcriptomic changes along malignancy continuum.log2FC in expression of this searched gene in stem-like cells from each diseased tissue sample relative to stem-like cells in normal samples in each tissue plotted against the malignancy continuum. Samples are colored based on if they are from different disease stage.
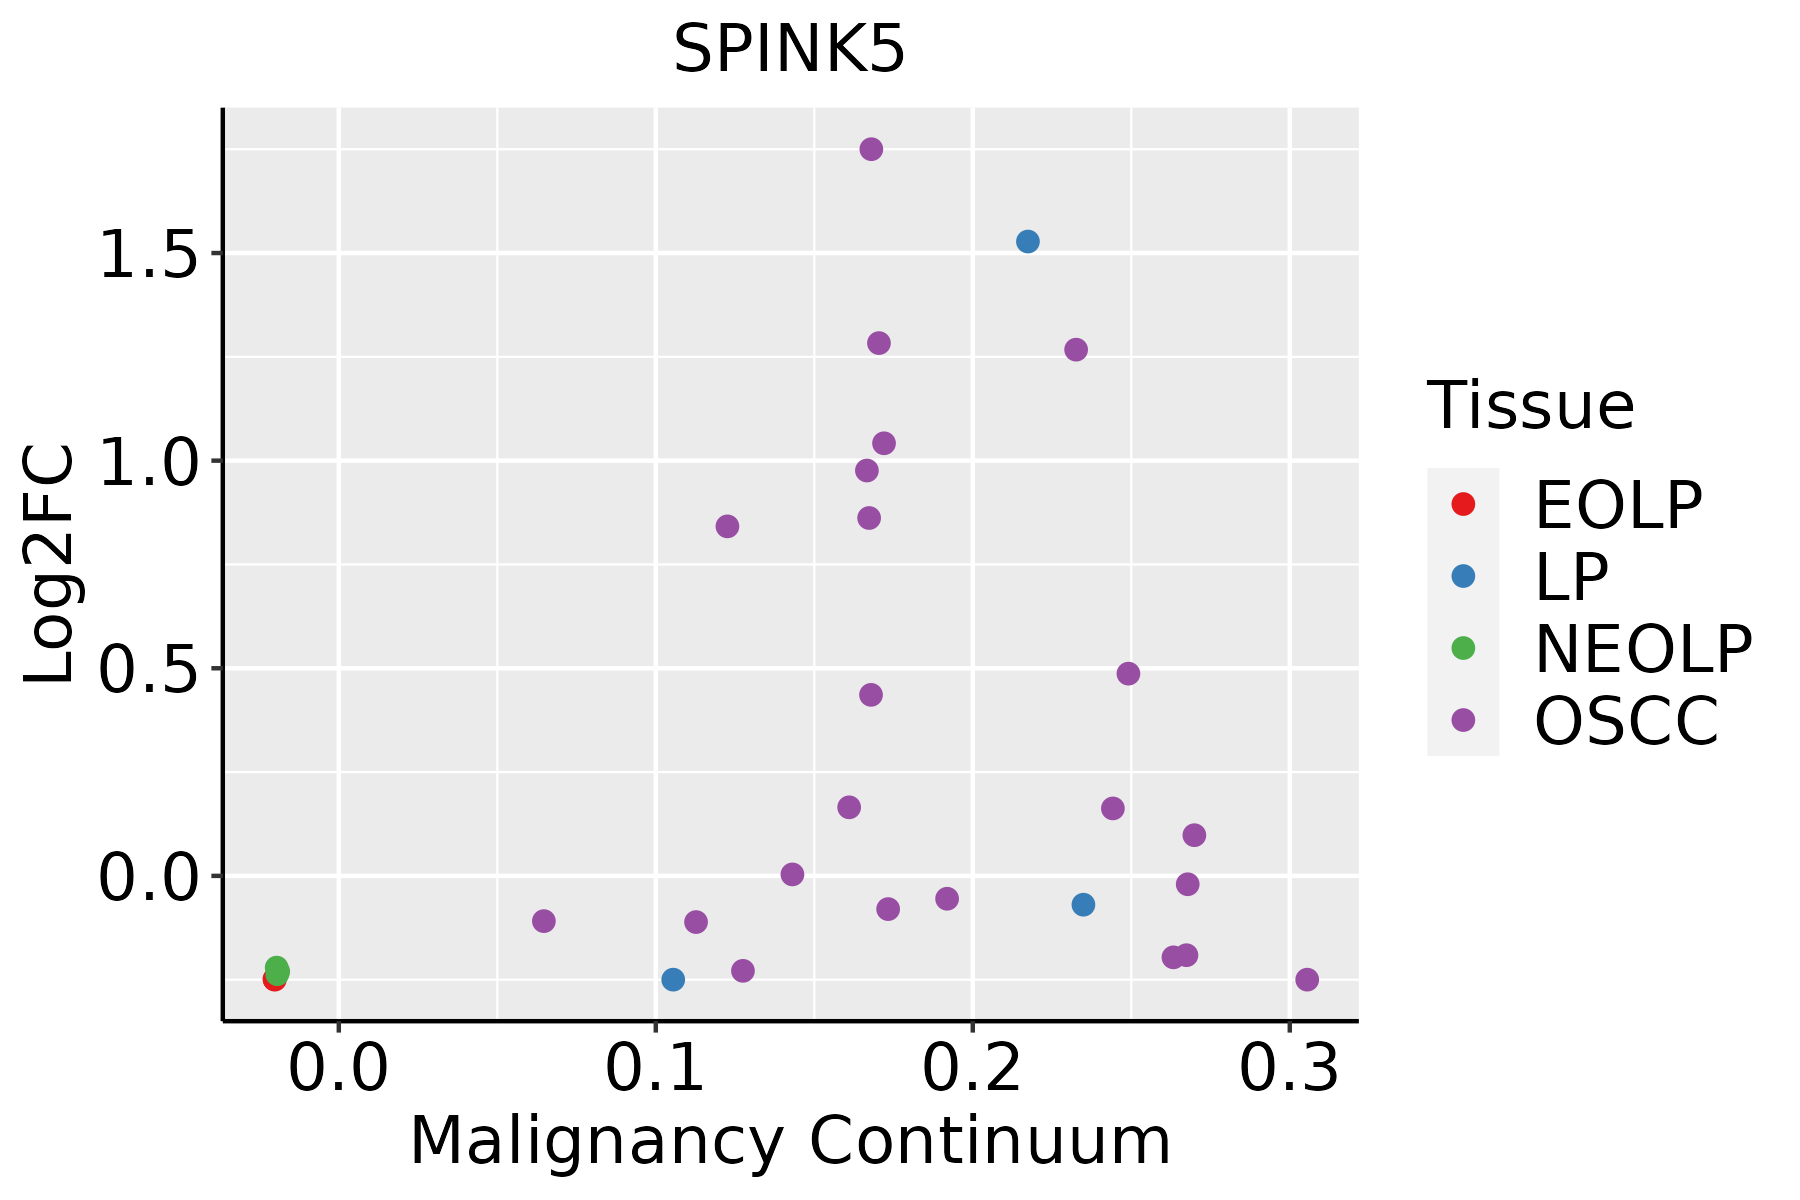
EOLP: Erosive Oral lichen planus
LP: leukoplakia
NEOLP: Non-erosive oral lichen planus
OSCC: Oral squamous cell carcinoma
SkinThe image shows the transcriptomic changes along malignancy continuum.log2FC in expression of this searched gene in stem-like cells from each diseased tissue sample relative to stem-like cells in normal samples in each tissue plotted against the malignancy continuum. Samples are colored based on if they are from different disease stage.
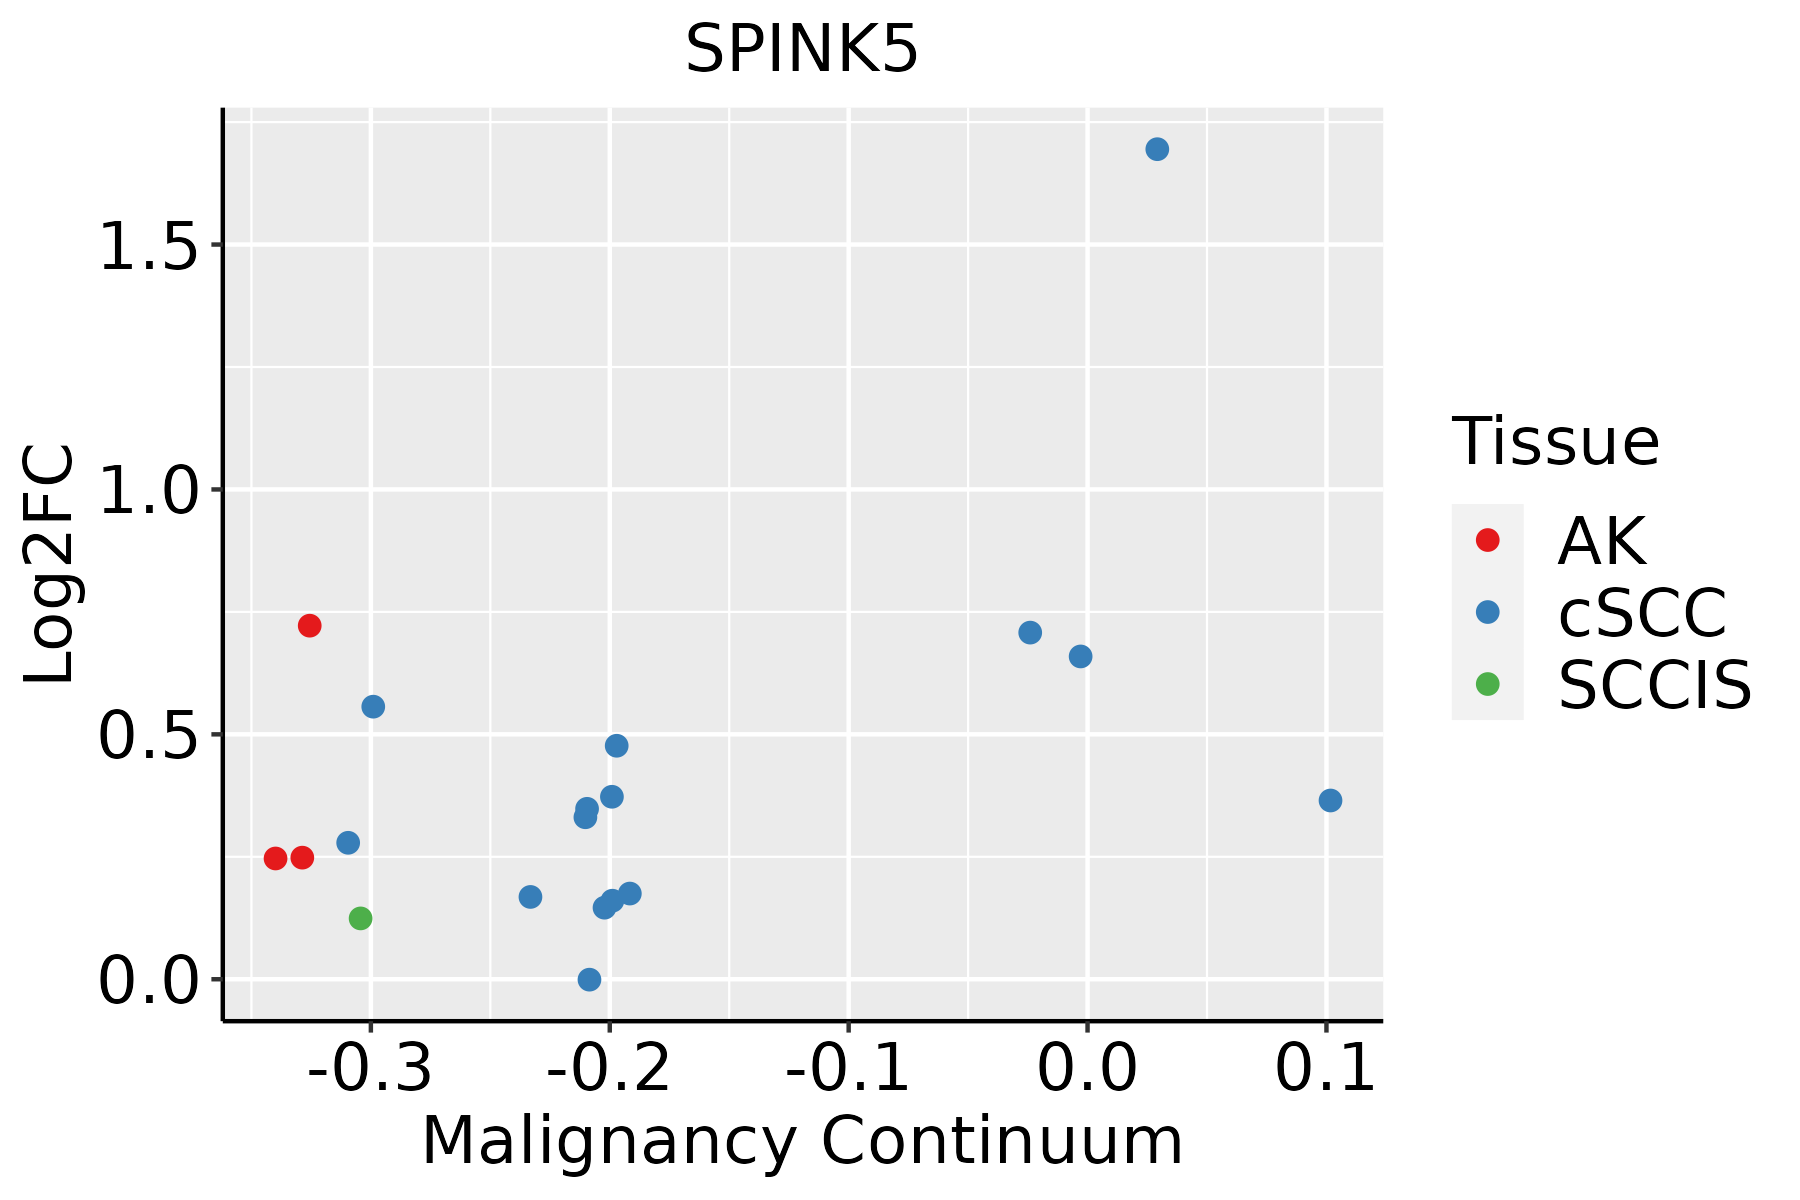
AK: Actinic keratosis
cSCC: Cutaneous squamous cell carcinoma
SCCIS:squamous cell carcinoma in situ
∗log2FC in expression of this searched gene in stem-like cells from each diseased tissue sample relative to stem-like cells in normal samples in each tissue plotted against the malignancy continuum. Samples are colored based on if they are from different disease stage.

Top

Malignant transformation related pathway analysis

check buttonFind out the enriched GO biological processes and KEGG pathways involved in transition from healthy to precancer to cancer
check button Figure of enriched GO biological processes.
TissueDisease StageEnriched GO biological Processes
ColorectumADGO analysis - Figure of enriched GO biological processes: Top 15 enriched GO BP terms are showed in the bar plot of each disease state in each tissue. Each row represents a significant GO biological process which is colored according to the -log10(p.adjust).
ColorectumSERGO analysis - Figure of enriched GO biological processes: Top 15 enriched GO BP terms are showed in the bar plot of each disease state in each tissue. Each row represents a significant GO biological process which is colored according to the -log10(p.adjust).
ColorectumMSSGO analysis - Figure of enriched GO biological processes: Top 15 enriched GO BP terms are showed in the bar plot of each disease state in each tissue. Each row represents a significant GO biological process which is colored according to the -log10(p.adjust).
ColorectumMSI-HGO analysis - Figure of enriched GO biological processes: Top 15 enriched GO BP terms are showed in the bar plot of each disease state in each tissue. Each row represents a significant GO biological process which is colored according to the -log10(p.adjust).
ColorectumFAPGO analysis - Figure of enriched GO biological processes: Top 15 enriched GO BP terms are showed in the bar plot of each disease state in each tissue. Each row represents a significant GO biological process which is colored according to the -log10(p.adjust).
∗Top 15 enriched GO BP terms are showed in the bar plot of each disease state in each tissue. Each row represents a significant GO biological process which is colored according to the -log10(p.adjust).
Page: 1 2 3 4 5 6 7 8 9 

check button Enriched GO biological processes.
GO IDTissueDisease StageDescriptionGene RatioBg Ratiopvaluep.adjustCount
GO:0052547ColorectumADregulation of peptidase activity137/3918461/187234.12e-061.12e-04137
GO:0045861ColorectumADnegative regulation of proteolysis106/3918351/187232.33e-054.57e-04106
GO:0052548ColorectumADregulation of endopeptidase activity124/3918432/187236.58e-051.07e-03124
GO:0035315ColorectumADhair cell differentiation21/391847/187232.14e-042.82e-0321
GO:1903706ColorectumADregulation of hemopoiesis99/3918367/187233.08e-032.28e-0299
GO:0009913ColorectumADepidermal cell differentiation58/3918202/187235.16e-033.42e-0258
GO:0008544ColorectumADepidermis development87/3918324/187235.99e-033.76e-0287
GO:00525471ColorectumSERregulation of peptidase activity114/2897461/187231.18e-077.17e-06114
GO:00458611ColorectumSERnegative regulation of proteolysis88/2897351/187231.74e-067.50e-0588
GO:00525481ColorectumSERregulation of endopeptidase activity103/2897432/187232.86e-061.16e-04103
GO:0051346ColorectumSERnegative regulation of hydrolase activity82/2897379/187238.19e-041.01e-0282
GO:00353151ColorectumSERhair cell differentiation15/289747/187233.68e-033.07e-0215
GO:0010466ColorectumSERnegative regulation of peptidase activity57/2897262/187234.15e-033.38e-0257
GO:0043588ColorectumFAPskin development58/2622263/187232.44e-043.39e-0358
GO:00085441ColorectumFAPepidermis development66/2622324/187239.63e-049.51e-0366
GO:0021700ColorectumFAPdevelopmental maturation57/2622280/187232.08e-031.72e-0257
GO:00525474ColorectumFAPregulation of peptidase activity86/2622461/187232.98e-032.27e-0286
GO:00458614ColorectumFAPnegative regulation of proteolysis68/2622351/187233.07e-032.31e-0268
GO:00353153ColorectumFAPhair cell differentiation14/262247/187233.95e-032.75e-0214
GO:1903131ColorectumFAPmononuclear cell differentiation79/2622426/187235.00e-033.33e-0279
Page: 1 2 3 4 5 6 7 8 9 10 

check button Enriched KEGG pathways.
Pathway IDTissueDisease StageDescriptionGene RatioBg Ratiopvaluep.adjustqvalueCount
Page: 1 

Top

Cell-cell communication analysis

check buttonIdentification of potential cell-cell interactions between two cell types and their ligand-receptor pairs for different disease states
LigandReceptorLRpairPathwayTissueDisease Stage
Page: 1 

Top

Single-cell gene regulatory network inference analysis

check buttonFind out the significant the regulons (TFs) and the target genes of each regulon across cell types for different disease states
TFCell TypeTissueDisease StageTarget GeneRSSRegulon Activity
∗The dot plots of a searched regulon are shown for all cell subpopulations in each disease state of each tissue based on the regulon specific score inferred using pySCENIC and by calculating the average expression.
Page: 1 

Top

Somatic mutation of malignant transformation related genes

check buttonAnnotation of somatic variants for genes involved in malignant transformation
Hugo SymbolVariant ClassVariant ClassificationdbSNP RSHGVScHGVSpHGVSp ShortSWISSPROTBIOTYPESIFTPolyPhenTumor Sample BarcodeTissueHistologySexAgeStageTherapy TypesDrugsOutcome
SPINK5SNVMissense_Mutationrs371134163c.2849G>Ap.Arg950Glnp.R950QQ9NQ38protein_codingtolerated(0.25)possibly_damaging(0.511)TCGA-A2-A0T1-01Breastbreast invasive carcinomaFemale<65III/IVTargeted Molecular therapyherceptinSD
SPINK5SNVMissense_Mutationnovelc.2058N>Gp.Asp686Glup.D686EQ9NQ38protein_codingtolerated(0.14)benign(0.281)TCGA-AO-A128-01Breastbreast invasive carcinomaFemale<65I/IIChemotherapydoxorubicinSD
SPINK5SNVMissense_Mutationnovelc.2687G>Cp.Arg896Thrp.R896TQ9NQ38protein_codingdeleterious(0)probably_damaging(0.999)TCGA-AR-A1AJ-01Breastbreast invasive carcinomaFemale>=65I/IIUnknownUnknownSD
SPINK5SNVMissense_Mutationc.2403N>Cp.Lys801Asnp.K801NQ9NQ38protein_codingdeleterious(0)probably_damaging(0.931)TCGA-BH-A0B5-01Breastbreast invasive carcinomaFemale<65III/IVChemotherapyadriamycinCR
SPINK5SNVMissense_Mutationnovelc.1436N>Tp.Gln479Leup.Q479LQ9NQ38protein_codingtolerated(0.22)possibly_damaging(0.661)TCGA-BH-A0BO-01Breastbreast invasive carcinomaFemale<65I/IIUnknownUnknownSD
SPINK5SNVMissense_Mutationnovelc.1890N>Tp.Glu630Aspp.E630DQ9NQ38protein_codingtolerated(1)benign(0)TCGA-C8-A1HM-01Breastbreast invasive carcinomaFemale>=65I/IIChemotherapydoxorubicinCR
SPINK5SNVMissense_Mutationc.538N>Cp.Asp180Hisp.D180HQ9NQ38protein_codingtolerated(0.08)probably_damaging(0.969)TCGA-E2-A1LH-01Breastbreast invasive carcinomaFemale<65I/IIChemotherapyadriamycinSD
SPINK5SNVMissense_Mutationc.901N>Gp.Gln301Glup.Q301EQ9NQ38protein_codingtolerated(0.56)benign(0.205)TCGA-GM-A2DF-01Breastbreast invasive carcinomaFemale<65I/IIChemotherapytaxolCR
SPINK5insertionNonsense_Mutationnovelc.1874_1875insCTATATATTAACATAAACATTATATGATACAAATAATATCATATp.Arg625SerfsTer6p.R625Sfs*6Q9NQ38protein_codingTCGA-A2-A0CP-01Breastbreast invasive carcinomaFemale<65I/IIChemotherapycytoxanSD
SPINK5insertionFrame_Shift_Insnovelc.1956_1957insAGCAAGTGGTGGTTTTCTTGCACCCAATTAAGATTATTAAp.Val653SerfsTer30p.V653Sfs*30Q9NQ38protein_codingTCGA-A8-A07J-01Breastbreast invasive carcinomaFemale<65I/IIChemotherapy5-fluorouracilCR
Page: 1 2 3 4 5 6 7 8 9 10 11 12 13 

Top

Related drugs of malignant transformation related genes

check buttonIdentification of chemicals and drugs interact with genes involved in malignant transfromation
(DGIdb 4.0)
Entrez IDSymbolCategoryInteraction TypesDrug Claim NameDrug NamePMIDs
Page: 1