| Tissue | Expression Dynamics | Abbreviation |
| Colorectum (GSE201348) | 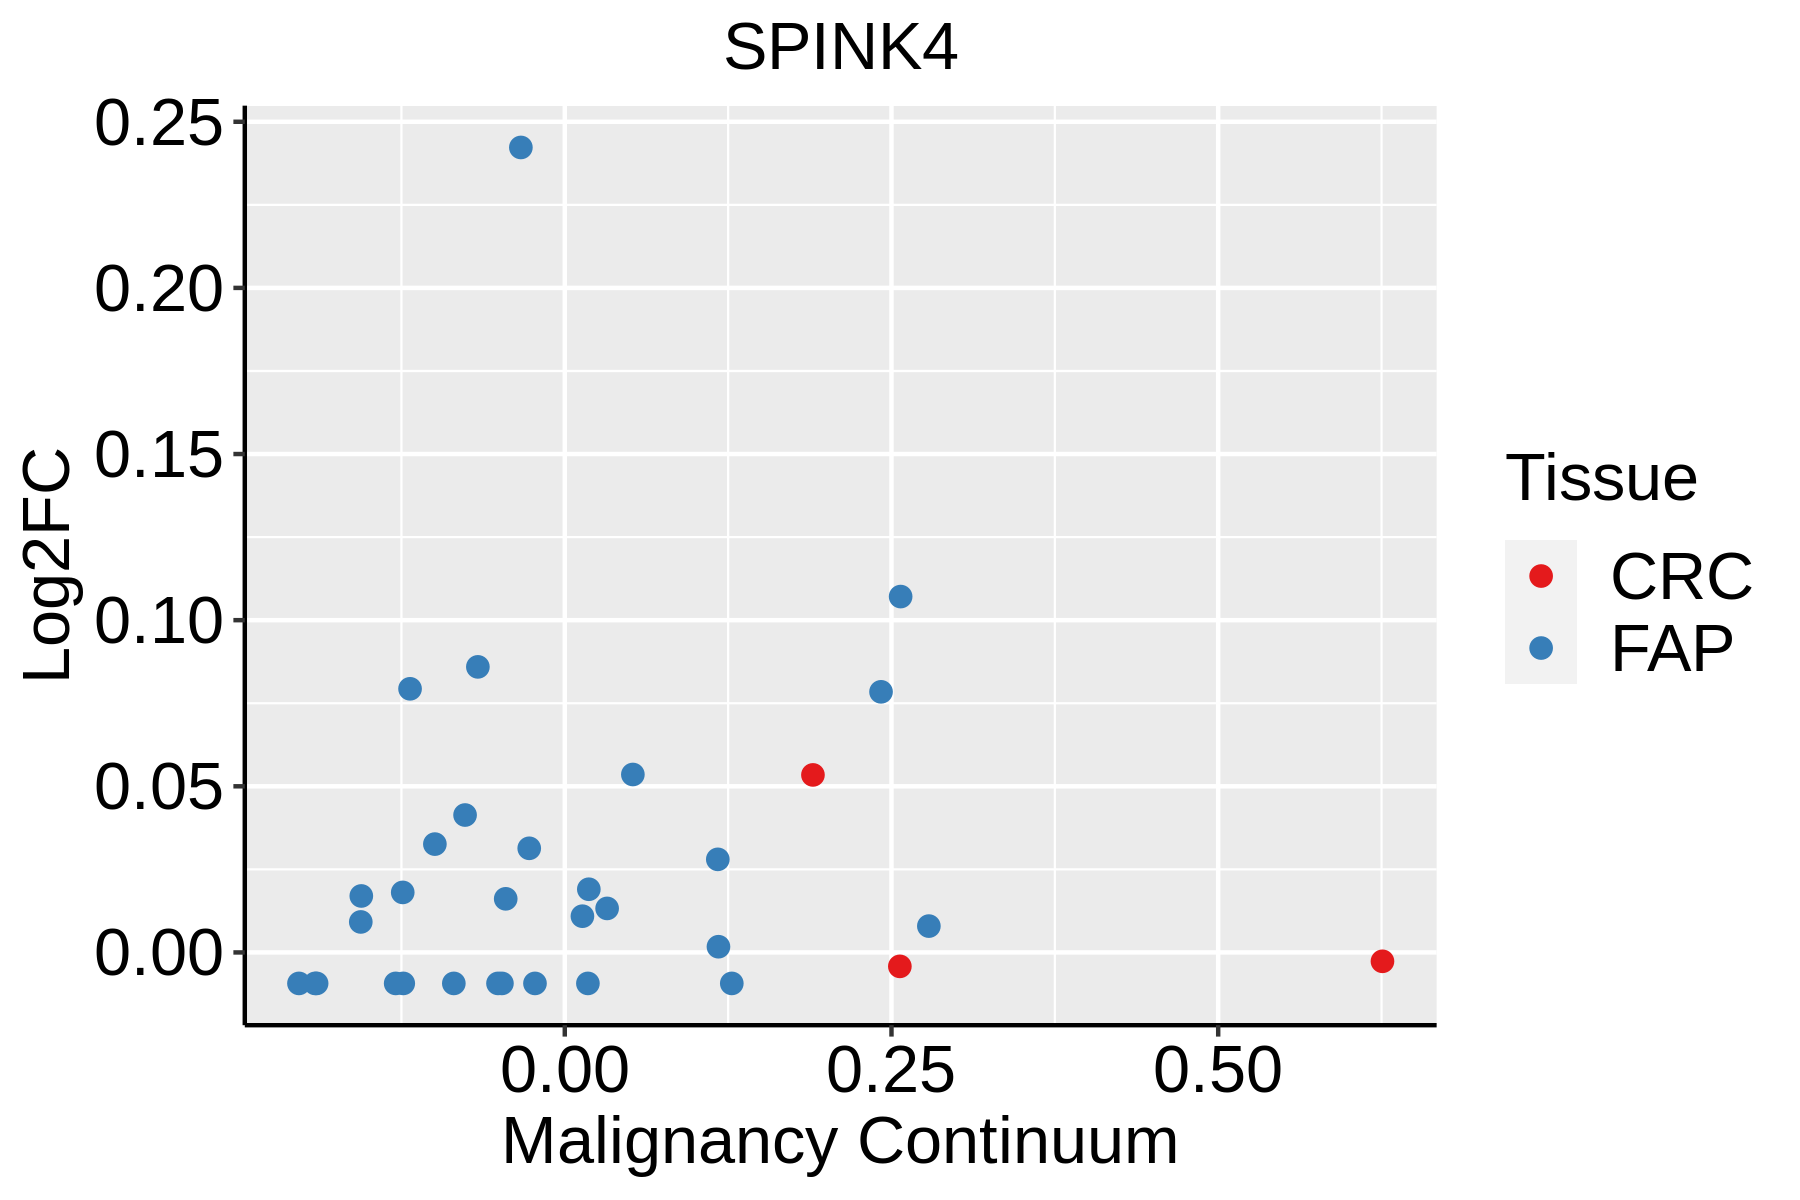 | FAP: Familial adenomatous polyposis |
| CRC: Colorectal cancer |
| Colorectum (HTA11) |  | AD: Adenomas |
| SER: Sessile serrated lesions |
| MSI-H: Microsatellite-high colorectal cancer |
| MSS: Microsatellite stable colorectal cancer |
| GC | 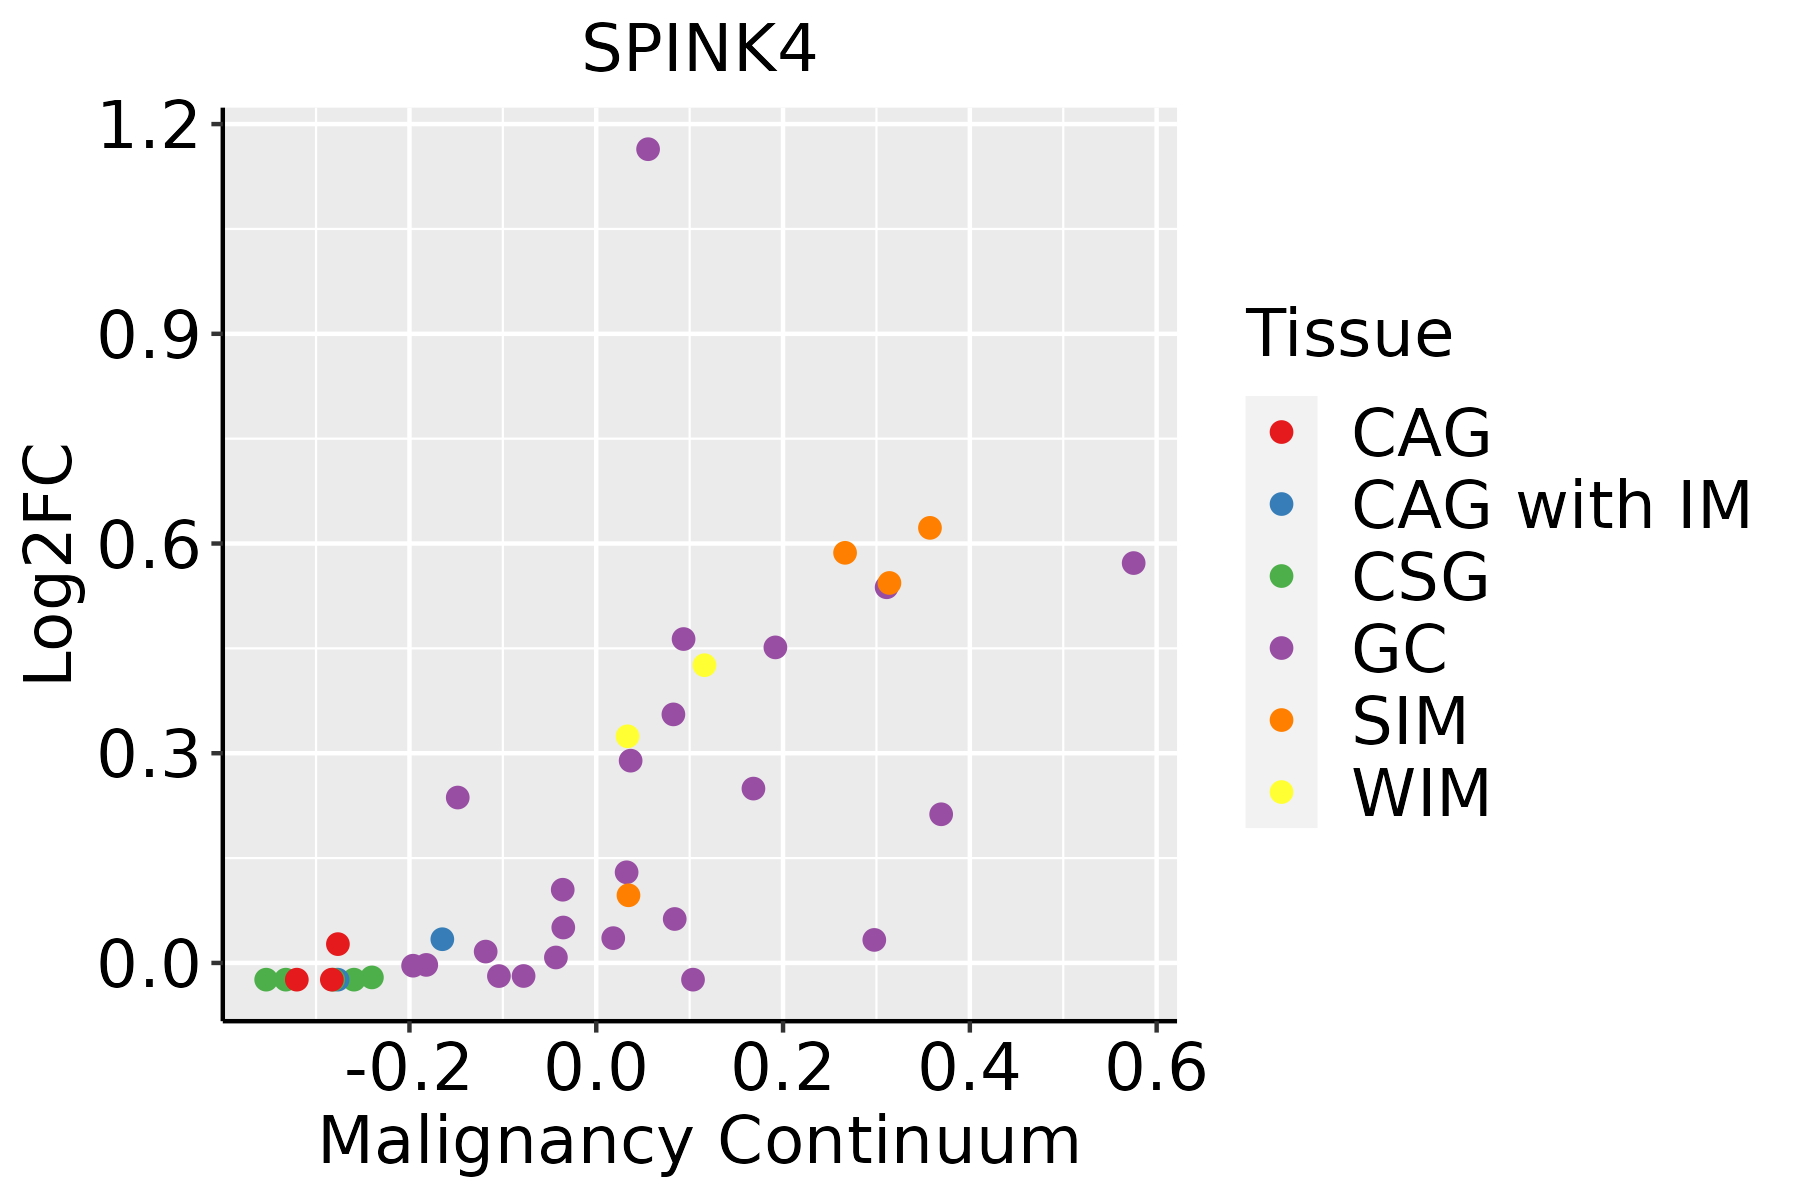 | CAG: Chronic atrophic gastritis |
| CAG with IM: Chronic atrophic gastritis with intestinal metaplasia |
| CSG: Chronic superficial gastritis |
| GC: Gastric cancer |
| SIM: Severe intestinal metaplasia |
| WIM: Wild intestinal metaplasia |
| GO ID | Tissue | Disease Stage | Description | Gene Ratio | Bg Ratio | pvalue | p.adjust | Count |
| GO:0052547 | Colorectum | AD | regulation of peptidase activity | 137/3918 | 461/18723 | 4.12e-06 | 1.12e-04 | 137 |
| GO:0045861 | Colorectum | AD | negative regulation of proteolysis | 106/3918 | 351/18723 | 2.33e-05 | 4.57e-04 | 106 |
| GO:0052548 | Colorectum | AD | regulation of endopeptidase activity | 124/3918 | 432/18723 | 6.58e-05 | 1.07e-03 | 124 |
| GO:0009410 | Colorectum | AD | response to xenobiotic stimulus | 128/3918 | 462/18723 | 2.69e-04 | 3.31e-03 | 128 |
| GO:00525471 | Colorectum | SER | regulation of peptidase activity | 114/2897 | 461/18723 | 1.18e-07 | 7.17e-06 | 114 |
| GO:00458611 | Colorectum | SER | negative regulation of proteolysis | 88/2897 | 351/18723 | 1.74e-06 | 7.50e-05 | 88 |
| GO:00525481 | Colorectum | SER | regulation of endopeptidase activity | 103/2897 | 432/18723 | 2.86e-06 | 1.16e-04 | 103 |
| GO:0051346 | Colorectum | SER | negative regulation of hydrolase activity | 82/2897 | 379/18723 | 8.19e-04 | 1.01e-02 | 82 |
| GO:0010466 | Colorectum | SER | negative regulation of peptidase activity | 57/2897 | 262/18723 | 4.15e-03 | 3.38e-02 | 57 |
| GO:00525476 | Stomach | GC | regulation of peptidase activity | 67/1159 | 461/18723 | 5.35e-11 | 1.10e-08 | 67 |
| GO:00525486 | Stomach | GC | regulation of endopeptidase activity | 63/1159 | 432/18723 | 1.76e-10 | 2.82e-08 | 63 |
| GO:00094106 | Stomach | GC | response to xenobiotic stimulus | 61/1159 | 462/18723 | 1.68e-08 | 1.43e-06 | 61 |
| GO:00458616 | Stomach | GC | negative regulation of proteolysis | 50/1159 | 351/18723 | 2.96e-08 | 2.33e-06 | 50 |
| GO:00513466 | Stomach | GC | negative regulation of hydrolase activity | 51/1159 | 379/18723 | 1.38e-07 | 8.14e-06 | 51 |
| GO:00104666 | Stomach | GC | negative regulation of peptidase activity | 38/1159 | 262/18723 | 8.47e-07 | 4.18e-05 | 38 |
| GO:00109516 | Stomach | GC | negative regulation of endopeptidase activity | 37/1159 | 252/18723 | 8.69e-07 | 4.26e-05 | 37 |
| GO:00525475 | Stomach | SIM | regulation of peptidase activity | 54/708 | 461/18723 | 1.46e-13 | 6.25e-11 | 54 |
| GO:00525485 | Stomach | SIM | regulation of endopeptidase activity | 51/708 | 432/18723 | 5.26e-13 | 2.07e-10 | 51 |
| GO:00513465 | Stomach | SIM | negative regulation of hydrolase activity | 42/708 | 379/18723 | 4.58e-10 | 8.00e-08 | 42 |
| GO:00104665 | Stomach | SIM | negative regulation of peptidase activity | 33/708 | 262/18723 | 1.39e-09 | 2.26e-07 | 33 |
| Hugo Symbol | Variant Class | Variant Classification | dbSNP RS | HGVSc | HGVSp | HGVSp Short | SWISSPROT | BIOTYPE | SIFT | PolyPhen | Tumor Sample Barcode | Tissue | Histology | Sex | Age | Stage | Therapy Types | Drugs | Outcome |
| SPINK4 | insertion | Frame_Shift_Ins | novel | c.199_200insCTTATGATGTCCCCCACCTGGTGTCCAAGGCCCCT | p.Leu67ProfsTer18 | p.L67Pfs*18 | O60575 | protein_coding | | | TCGA-AN-A0AL-01 | Breast | breast invasive carcinoma | Female | <65 | III/IV | Unknown | Unknown | SD |
| SPINK4 | SNV | Missense_Mutation | | c.76N>A | p.Asp26Asn | p.D26N | | protein_coding | tolerated_low_confidence(0.43) | benign(0) | TCGA-EK-A3GJ-01 | Cervix | cervical & endocervical cancer | Female | <65 | I/II | Unknown | Unknown | SD |
| SPINK4 | SNV | Missense_Mutation | novel | c.206N>C | p.Leu69Ser | p.L69S | O60575 | protein_coding | deleterious(0.03) | benign(0.2) | TCGA-AA-3949-01 | Colorectum | colon adenocarcinoma | Female | >=65 | III/IV | Unknown | Unknown | SD |
| SPINK4 | SNV | Missense_Mutation | | c.251G>A | p.Gly84Asp | p.G84D | O60575 | protein_coding | deleterious(0) | probably_damaging(1) | TCGA-CM-4743-01 | Colorectum | colon adenocarcinoma | Male | >=65 | I/II | Chemotherapy | capecitabine | SD |
| SPINK4 | SNV | Missense_Mutation | novel | c.41N>T | p.Ala14Val | p.A14V | O60575 | protein_coding | tolerated(0.17) | benign(0.005) | TCGA-AP-A0LM-01 | Endometrium | uterine corpus endometrioid carcinoma | Female | <65 | III/IV | Chemotherapy | cisplatin | SD |
| SPINK4 | SNV | Missense_Mutation | novel | c.164N>A | p.Gly55Asp | p.G55D | O60575 | protein_coding | deleterious(0) | probably_damaging(1) | TCGA-AP-A1DK-01 | Endometrium | uterine corpus endometrioid carcinoma | Female | <65 | I/II | Unknown | Unknown | SD |
| SPINK4 | SNV | Missense_Mutation | | c.82N>C | p.Lys28Gln | p.K28Q | O60575 | protein_coding | tolerated(0.06) | possibly_damaging(0.559) | TCGA-D1-A16Y-01 | Endometrium | uterine corpus endometrioid carcinoma | Female | <65 | I/II | Unknown | Unknown | SD |
| SPINK4 | SNV | Missense_Mutation | novel | c.247N>T | p.Asp83Tyr | p.D83Y | O60575 | protein_coding | deleterious(0.01) | probably_damaging(0.999) | TCGA-EY-A1G8-01 | Endometrium | uterine corpus endometrioid carcinoma | Female | >=65 | I/II | Unknown | Unknown | SD |
| SPINK4 | SNV | Missense_Mutation | novel | c.155N>C | p.Leu52Pro | p.L52P | O60575 | protein_coding | tolerated(0.51) | benign(0.001) | TCGA-2Y-A9HA-01 | Liver | liver hepatocellular carcinoma | Male | >=65 | I/II | Unknown | Unknown | PD |
| SPINK4 | SNV | Missense_Mutation | novel | c.142N>A | p.Gln48Lys | p.Q48K | O60575 | protein_coding | tolerated(1) | benign(0.011) | TCGA-46-3766-01 | Lung | lung squamous cell carcinoma | Female | <65 | I/II | Unknown | Unknown | SD |


