
|
|||||
|
 | |
| |
| |
| |
| |
| |
|
Gene: SPINK2 |
Gene summary for SPINK2 |
| Gene information | Species | Human | Gene symbol | SPINK2 | Gene ID | 6691 |
| Gene name | serine peptidase inhibitor Kazal type 2 | |
| Gene Alias | HUSI-II | |
| Cytomap | 4q12 | |
| Gene Type | protein-coding | GO ID | GO:0000003 | UniProtAcc | D6RI10 |
Top |
Malignant transformation analysis |
| Identification of the aberrant gene expression in precancerous and cancerous lesions by comparing the gene expression of stem-like cells in diseased tissues with normal stem cells |
| Entrez ID | Symbol | Replicates | Species | Organ | Tissue | Adj P-value | Log2FC | Malignancy |
| 6691 | SPINK2 | C46 | Human | Oral cavity | OSCC | 3.39e-02 | 1.38e-01 | 0.1673 |
| 6691 | SPINK2 | C06 | Human | Oral cavity | OSCC | 5.42e-04 | 7.25e-01 | 0.2699 |
| 6691 | SPINK2 | LP15 | Human | Oral cavity | LP | 3.00e-08 | 9.40e-01 | 0.2174 |
| 6691 | SPINK2 | SYSMH6 | Human | Oral cavity | OSCC | 1.63e-02 | 8.80e-02 | 0.1275 |
| Page: 1 |
| Tissue | Expression Dynamics | Abbreviation |
| Oral Cavity | 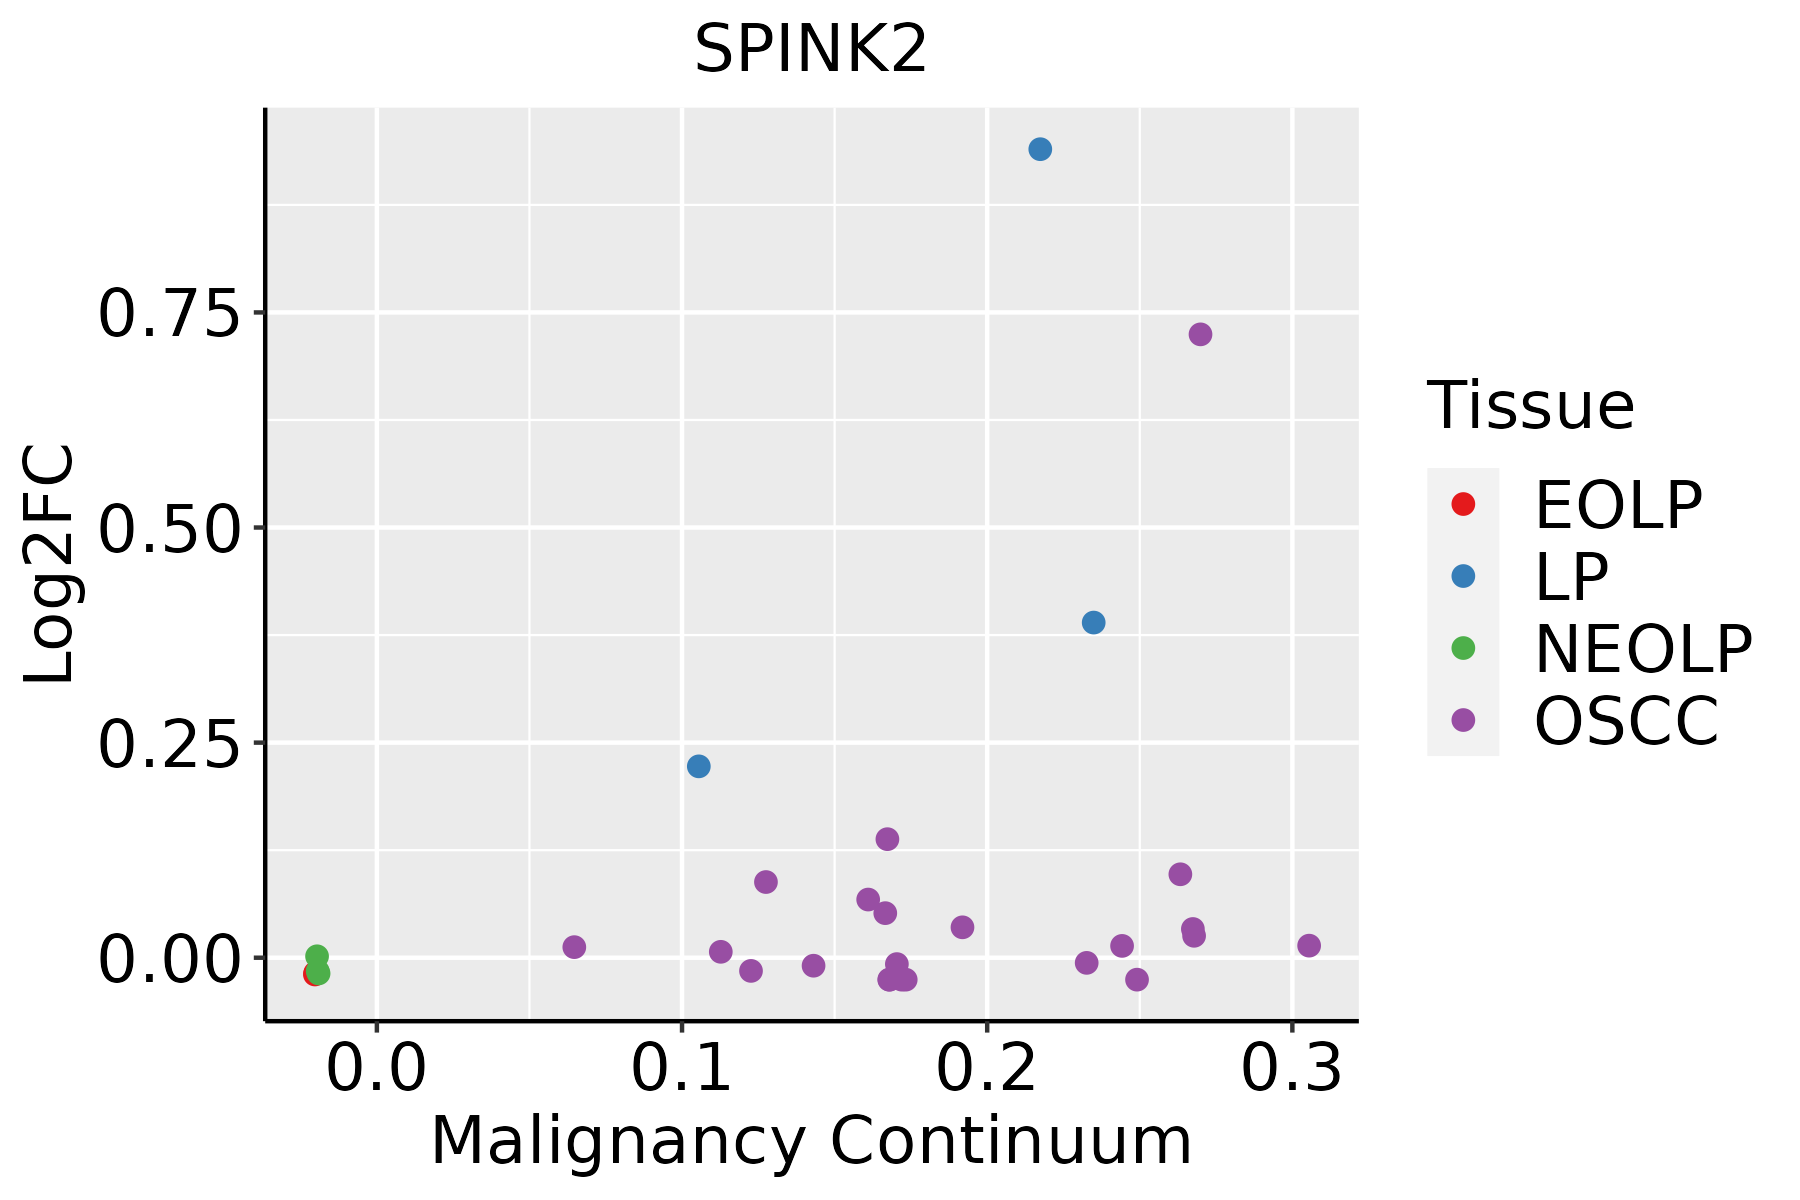 | EOLP: Erosive Oral lichen planus |
| LP: leukoplakia | ||
| NEOLP: Non-erosive oral lichen planus | ||
| OSCC: Oral squamous cell carcinoma |
| ∗log2FC in expression of this searched gene in stem-like cells from each diseased tissue sample relative to stem-like cells in normal samples in each tissue plotted against the malignancy continuum. Samples are colored based on if they are from different disease stage. |
Top |
Malignant transformation related pathway analysis |
| Find out the enriched GO biological processes and KEGG pathways involved in transition from healthy to precancer to cancer |
| Tissue | Disease Stage | Enriched GO biological Processes |
| Colorectum | AD |  |
| Colorectum | SER |  |
| Colorectum | MSS |  |
| Colorectum | MSI-H |  |
| Colorectum | FAP |  |
| ∗Top 15 enriched GO BP terms are showed in the bar plot of each disease state in each tissue. Each row represents a significant GO biological process which is colored according to the -log10(p.adjust). |
| Page: 1 2 3 4 5 6 7 8 9 |
| GO ID | Tissue | Disease Stage | Description | Gene Ratio | Bg Ratio | pvalue | p.adjust | Count |
| GO:00160508 | Oral cavity | OSCC | vesicle organization | 189/7305 | 300/18723 | 2.40e-17 | 2.14e-15 | 189 |
| GO:005254720 | Oral cavity | OSCC | regulation of peptidase activity | 255/7305 | 461/18723 | 5.78e-13 | 2.75e-11 | 255 |
| GO:005254820 | Oral cavity | OSCC | regulation of endopeptidase activity | 235/7305 | 432/18723 | 4.35e-11 | 1.40e-09 | 235 |
| GO:004586120 | Oral cavity | OSCC | negative regulation of proteolysis | 181/7305 | 351/18723 | 1.01e-06 | 1.37e-05 | 181 |
| GO:005134618 | Oral cavity | OSCC | negative regulation of hydrolase activity | 182/7305 | 379/18723 | 1.98e-04 | 1.32e-03 | 182 |
| GO:001095117 | Oral cavity | OSCC | negative regulation of endopeptidase activity | 126/7305 | 252/18723 | 2.37e-04 | 1.54e-03 | 126 |
| GO:001046618 | Oral cavity | OSCC | negative regulation of peptidase activity | 130/7305 | 262/18723 | 2.89e-04 | 1.82e-03 | 130 |
| GO:001605013 | Oral cavity | LP | vesicle organization | 128/4623 | 300/18723 | 4.96e-12 | 3.98e-10 | 128 |
| GO:0052547110 | Oral cavity | LP | regulation of peptidase activity | 177/4623 | 461/18723 | 3.01e-11 | 2.00e-09 | 177 |
| GO:0052548110 | Oral cavity | LP | regulation of endopeptidase activity | 164/4623 | 432/18723 | 4.33e-10 | 2.20e-08 | 164 |
| GO:0045861110 | Oral cavity | LP | negative regulation of proteolysis | 122/4623 | 351/18723 | 1.32e-05 | 2.34e-04 | 122 |
| GO:001046619 | Oral cavity | LP | negative regulation of peptidase activity | 87/4623 | 262/18723 | 1.12e-03 | 9.19e-03 | 87 |
| GO:005134619 | Oral cavity | LP | negative regulation of hydrolase activity | 120/4623 | 379/18723 | 1.16e-03 | 9.48e-03 | 120 |
| GO:001095118 | Oral cavity | LP | negative regulation of endopeptidase activity | 83/4623 | 252/18723 | 1.86e-03 | 1.39e-02 | 83 |
| Page: 1 |
| Pathway ID | Tissue | Disease Stage | Description | Gene Ratio | Bg Ratio | pvalue | p.adjust | qvalue | Count |
| Page: 1 |
Top |
Cell-cell communication analysis |
| Identification of potential cell-cell interactions between two cell types and their ligand-receptor pairs for different disease states |
| Ligand | Receptor | LRpair | Pathway | Tissue | Disease Stage |
| Page: 1 |
Top |
Single-cell gene regulatory network inference analysis |
| Find out the significant the regulons (TFs) and the target genes of each regulon across cell types for different disease states |
| TF | Cell Type | Tissue | Disease Stage | Target Gene | RSS | Regulon Activity |
| ∗The dot plots of a searched regulon are shown for all cell subpopulations in each disease state of each tissue based on the regulon specific score inferred using pySCENIC and by calculating the average expression. |
| Page: 1 |
Top |
Somatic mutation of malignant transformation related genes |
| Annotation of somatic variants for genes involved in malignant transformation |
| Hugo Symbol | Variant Class | Variant Classification | dbSNP RS | HGVSc | HGVSp | HGVSp Short | SWISSPROT | BIOTYPE | SIFT | PolyPhen | Tumor Sample Barcode | Tissue | Histology | Sex | Age | Stage | Therapy Types | Drugs | Outcome |
| SPINK2 | SNV | Missense_Mutation | c.301N>C | p.Val101Leu | p.V101L | protein_coding | deleterious(0.02) | possibly_damaging(0.821) | TCGA-A2-A04W-01 | Breast | breast invasive carcinoma | Female | <65 | I/II | Chemotherapy | cytoxan | SD | ||
| SPINK2 | SNV | Missense_Mutation | c.211C>A | p.Leu71Met | p.L71M | protein_coding | tolerated(0.09) | benign(0.003) | TCGA-BH-A18G-01 | Breast | breast invasive carcinoma | Female | >=65 | I/II | Unknown | Unknown | SD | ||
| SPINK2 | SNV | Missense_Mutation | novel | c.306N>G | p.Cys102Trp | p.C102W | protein_coding | deleterious(0) | probably_damaging(0.989) | TCGA-SS-A7HO-01 | Colorectum | colon adenocarcinoma | Female | <65 | I/II | Chemotherapy | oxaliplatin | PD | |
| SPINK2 | SNV | Missense_Mutation | c.341N>A | p.Thr114Asn | p.T114N | protein_coding | deleterious(0.03) | possibly_damaging(0.906) | TCGA-CL-5918-01 | Colorectum | rectum adenocarcinoma | Female | >=65 | I/II | Unknown | Unknown | SD | ||
| SPINK2 | SNV | Missense_Mutation | novel | c.209C>G | p.Ser70Cys | p.S70C | protein_coding | tolerated(0.13) | possibly_damaging(0.667) | TCGA-P3-A6T4-01 | Oral cavity | head & neck squamous cell carcinoma | Male | <65 | I/II | Unknown | Unknown | PD |
| Page: 1 |
Top |
Related drugs of malignant transformation related genes |
| Identification of chemicals and drugs interact with genes involved in malignant transfromation |
| (DGIdb 4.0) |
| Entrez ID | Symbol | Category | Interaction Types | Drug Claim Name | Drug Name | PMIDs |
| Page: 1 |

Copyright 2023-Present -The University of Texas Health Science Center at Houston |