
|
|||||
|
 | |
| |
| |
| |
| |
| |
|
Gene: SPIN1 |
Gene summary for SPIN1 |
| Gene information | Species | Human | Gene symbol | SPIN1 | Gene ID | 10927 |
| Gene name | spindlin 1 | |
| Gene Alias | SPIN | |
| Cytomap | 9q22.1 | |
| Gene Type | protein-coding | GO ID | GO:0000003 | UniProtAcc | A0A024R297 |
Top |
Malignant transformation analysis |
| Identification of the aberrant gene expression in precancerous and cancerous lesions by comparing the gene expression of stem-like cells in diseased tissues with normal stem cells |
| Entrez ID | Symbol | Replicates | Species | Organ | Tissue | Adj P-value | Log2FC | Malignancy |
| 10927 | SPIN1 | CA_HPV_1 | Human | Cervix | CC | 3.19e-03 | -1.39e-01 | 0.0264 |
| 10927 | SPIN1 | CCI_2 | Human | Cervix | CC | 6.73e-06 | 7.95e-01 | 0.5249 |
| 10927 | SPIN1 | CCI_3 | Human | Cervix | CC | 6.32e-06 | 6.27e-01 | 0.516 |
| 10927 | SPIN1 | HTA11_3410_2000001011 | Human | Colorectum | AD | 6.38e-08 | -4.25e-01 | 0.0155 |
| 10927 | SPIN1 | HTA11_99999974143_84620 | Human | Colorectum | MSS | 1.51e-07 | -3.61e-01 | 0.3005 |
| 10927 | SPIN1 | A002-C-010 | Human | Colorectum | FAP | 6.44e-03 | -1.51e-01 | 0.242 |
| 10927 | SPIN1 | A001-C-207 | Human | Colorectum | FAP | 5.06e-03 | -2.25e-01 | 0.1278 |
| 10927 | SPIN1 | A015-C-203 | Human | Colorectum | FAP | 4.44e-25 | -2.61e-01 | -0.1294 |
| 10927 | SPIN1 | A015-C-204 | Human | Colorectum | FAP | 1.38e-04 | -2.18e-01 | -0.0228 |
| 10927 | SPIN1 | A014-C-040 | Human | Colorectum | FAP | 1.30e-05 | -5.05e-01 | -0.1184 |
| 10927 | SPIN1 | A002-C-201 | Human | Colorectum | FAP | 2.58e-12 | -3.38e-01 | 0.0324 |
| 10927 | SPIN1 | A002-C-203 | Human | Colorectum | FAP | 1.59e-04 | -1.98e-01 | 0.2786 |
| 10927 | SPIN1 | A001-C-119 | Human | Colorectum | FAP | 1.81e-04 | -1.27e-01 | -0.1557 |
| 10927 | SPIN1 | A001-C-108 | Human | Colorectum | FAP | 3.53e-16 | -2.98e-01 | -0.0272 |
| 10927 | SPIN1 | A002-C-205 | Human | Colorectum | FAP | 3.44e-19 | -3.56e-01 | -0.1236 |
| 10927 | SPIN1 | A001-C-104 | Human | Colorectum | FAP | 5.48e-07 | -2.40e-01 | 0.0184 |
| 10927 | SPIN1 | A015-C-005 | Human | Colorectum | FAP | 4.80e-05 | -2.72e-01 | -0.0336 |
| 10927 | SPIN1 | A015-C-006 | Human | Colorectum | FAP | 1.43e-16 | -5.21e-01 | -0.0994 |
| 10927 | SPIN1 | A015-C-106 | Human | Colorectum | FAP | 4.86e-10 | -2.05e-01 | -0.0511 |
| 10927 | SPIN1 | A002-C-114 | Human | Colorectum | FAP | 1.65e-16 | -2.97e-01 | -0.1561 |
| Page: 1 2 3 4 5 6 7 8 |
| Tissue | Expression Dynamics | Abbreviation |
| Cervix | 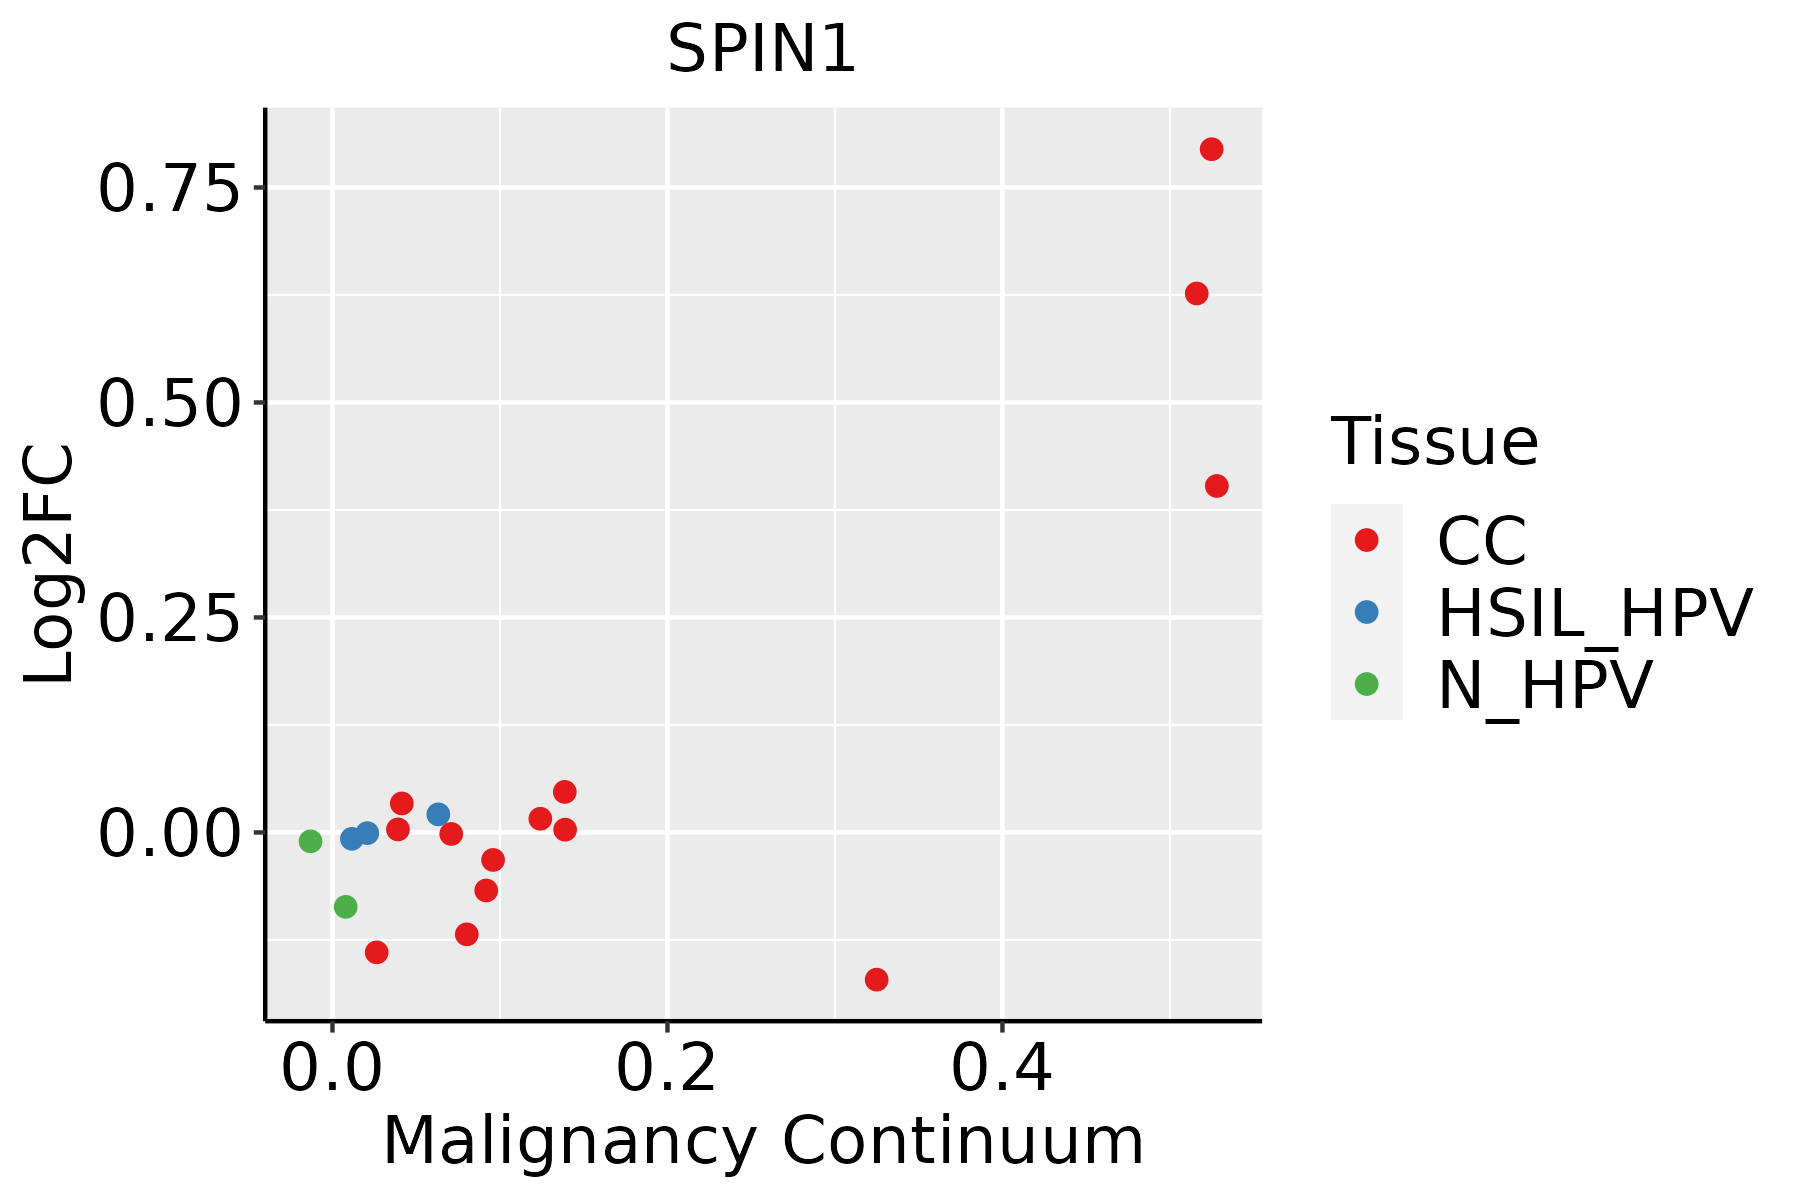 | CC: Cervix cancer |
| HSIL_HPV: HPV-infected high-grade squamous intraepithelial lesions | ||
| N_HPV: HPV-infected normal cervix | ||
| Colorectum (GSE201348) |  | FAP: Familial adenomatous polyposis |
| CRC: Colorectal cancer | ||
| Colorectum (HTA11) |  | AD: Adenomas |
| SER: Sessile serrated lesions | ||
| MSI-H: Microsatellite-high colorectal cancer | ||
| MSS: Microsatellite stable colorectal cancer | ||
| Esophagus | 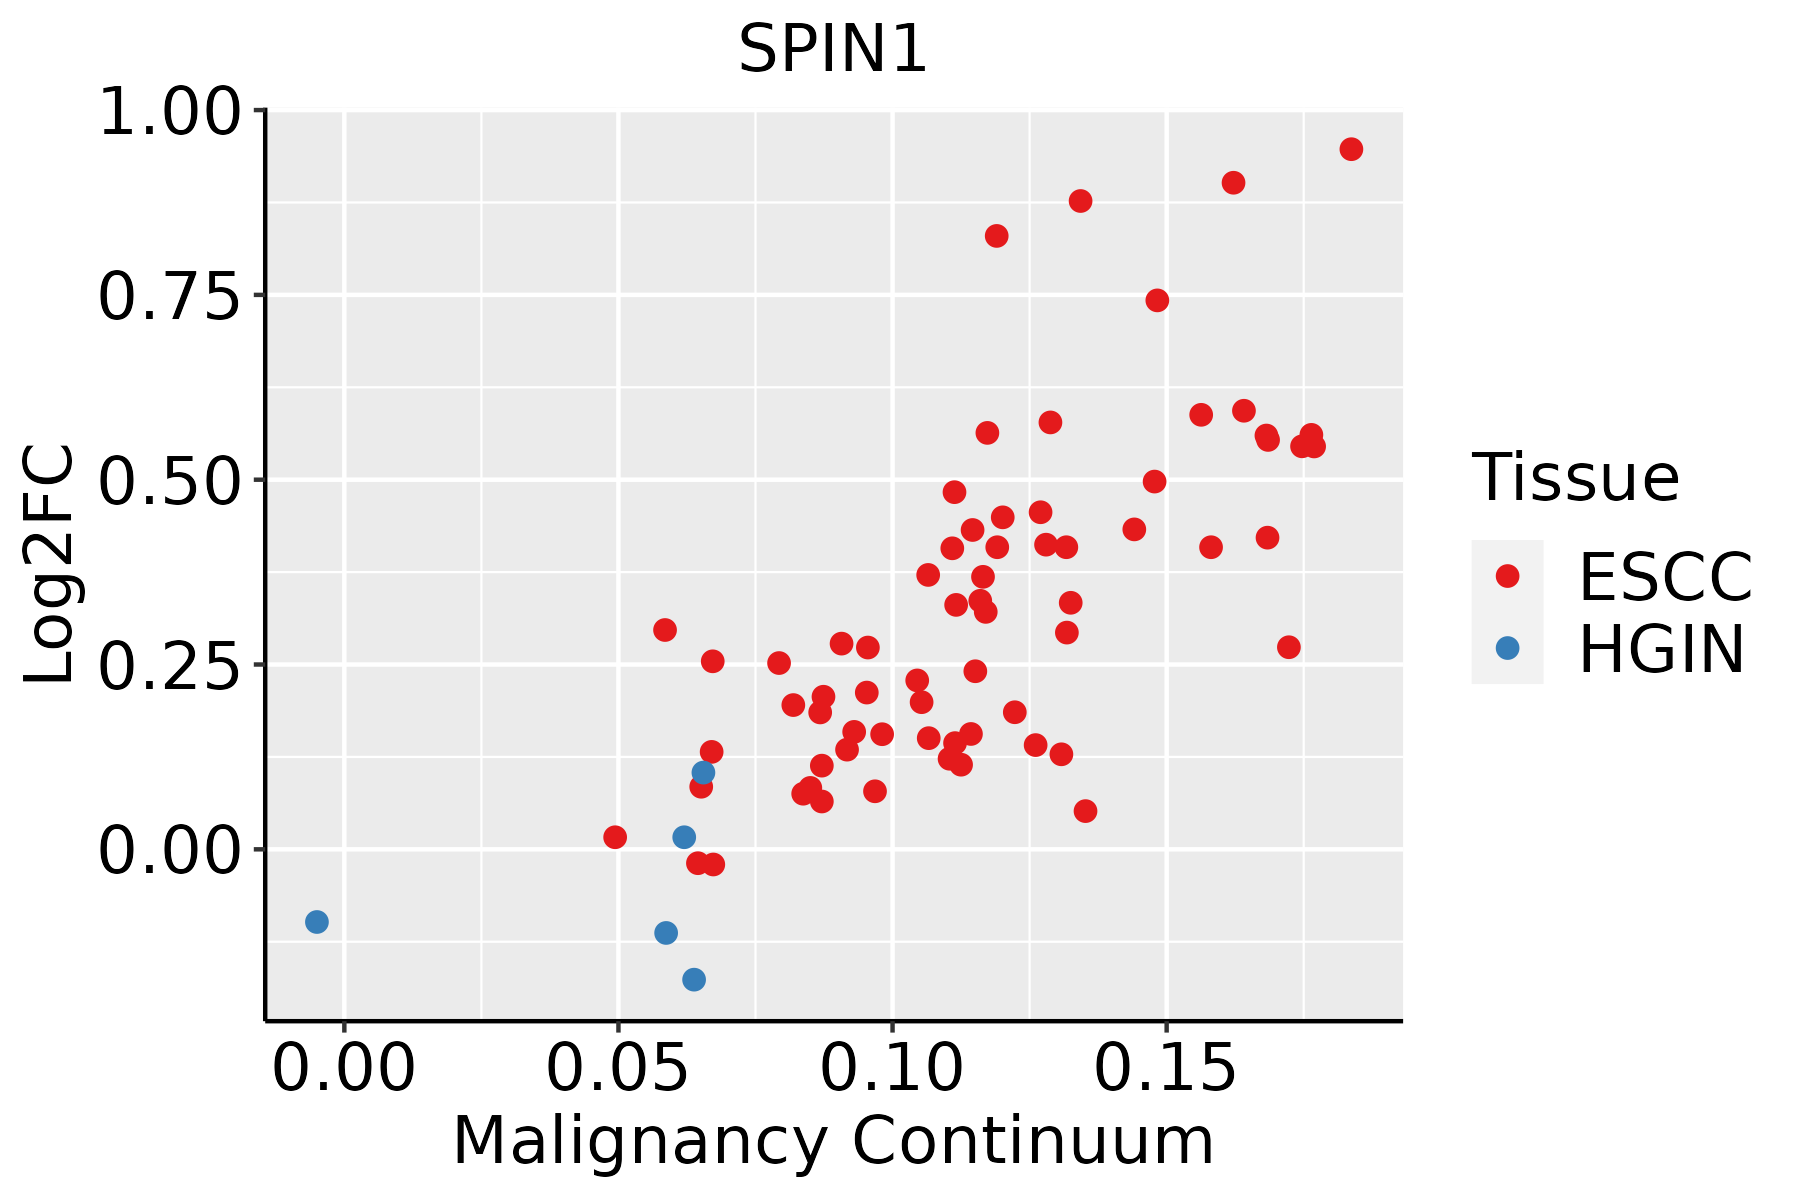 | ESCC: Esophageal squamous cell carcinoma |
| HGIN: High-grade intraepithelial neoplasias | ||
| LGIN: Low-grade intraepithelial neoplasias | ||
| Liver | 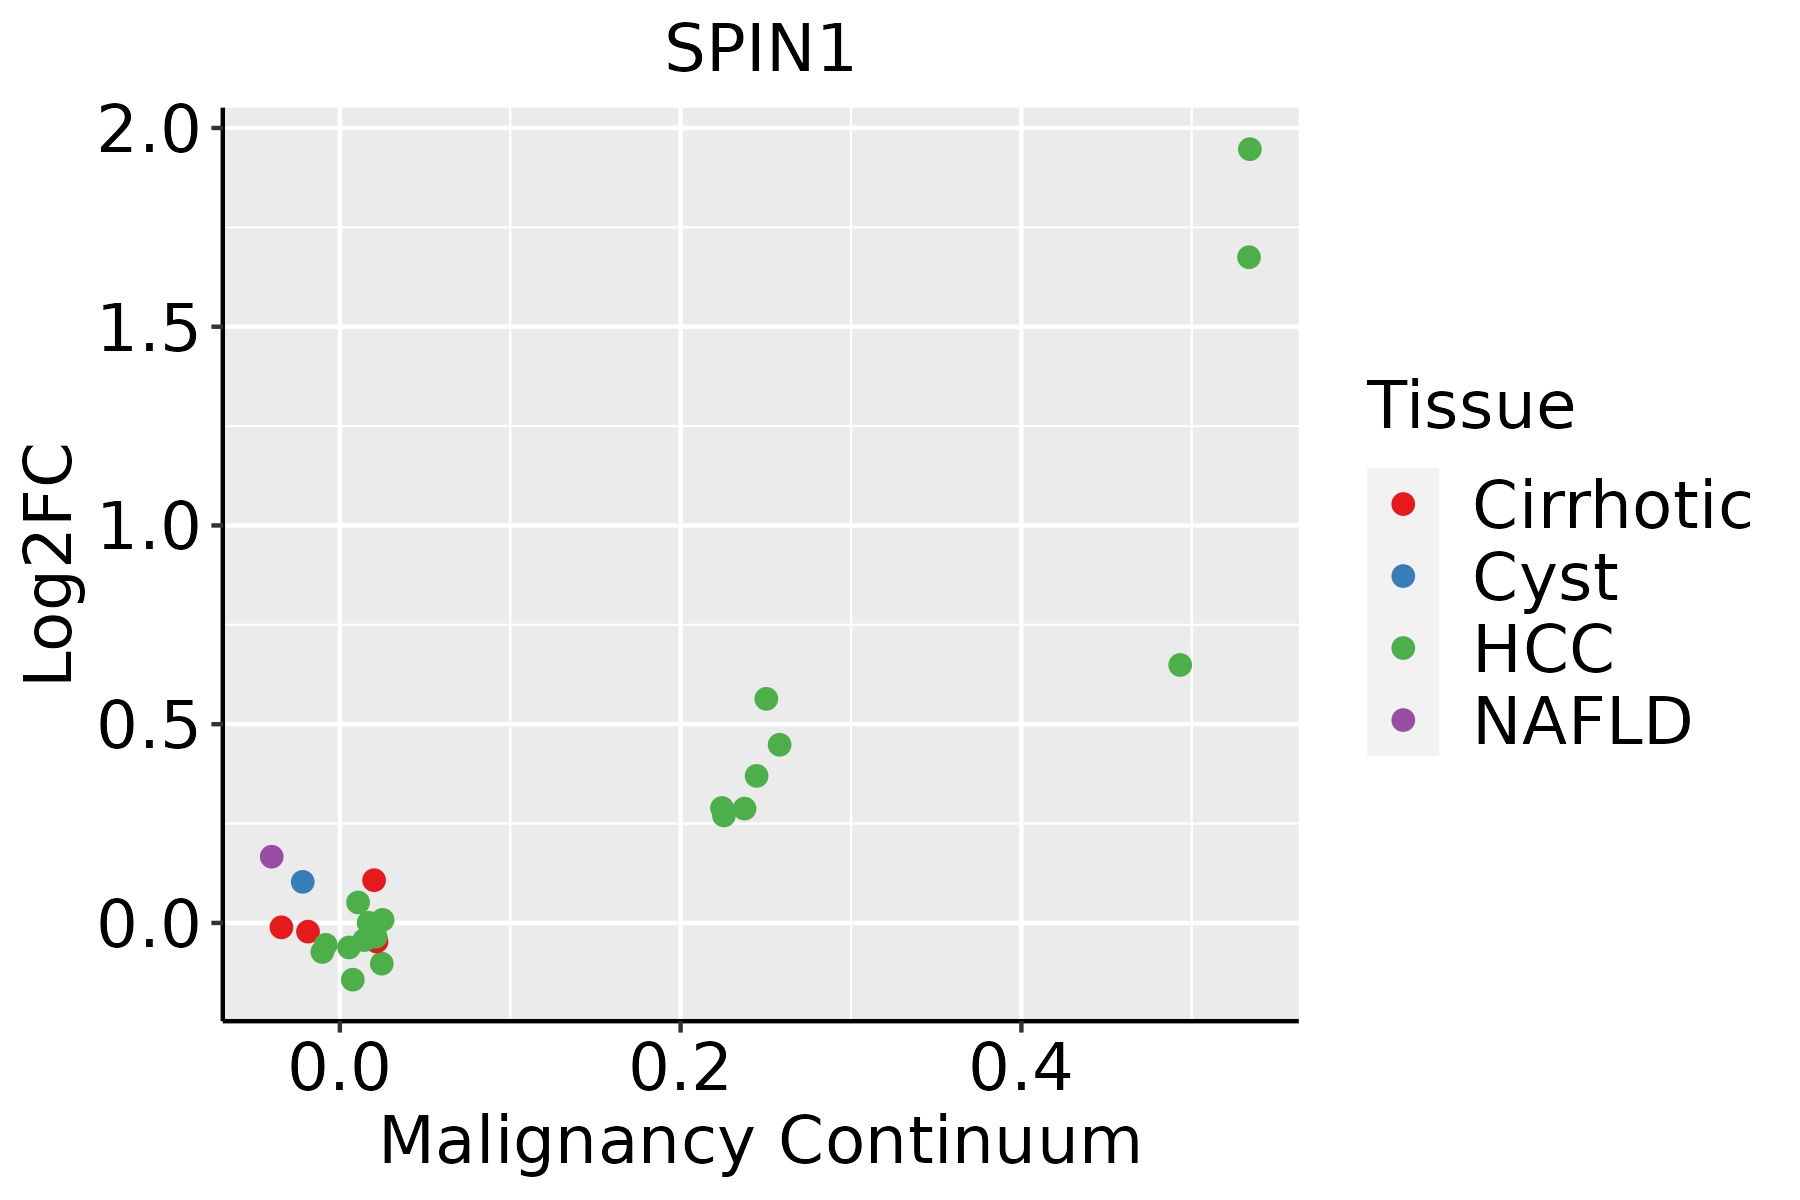 | HCC: Hepatocellular carcinoma |
| NAFLD: Non-alcoholic fatty liver disease | ||
| Oral Cavity | 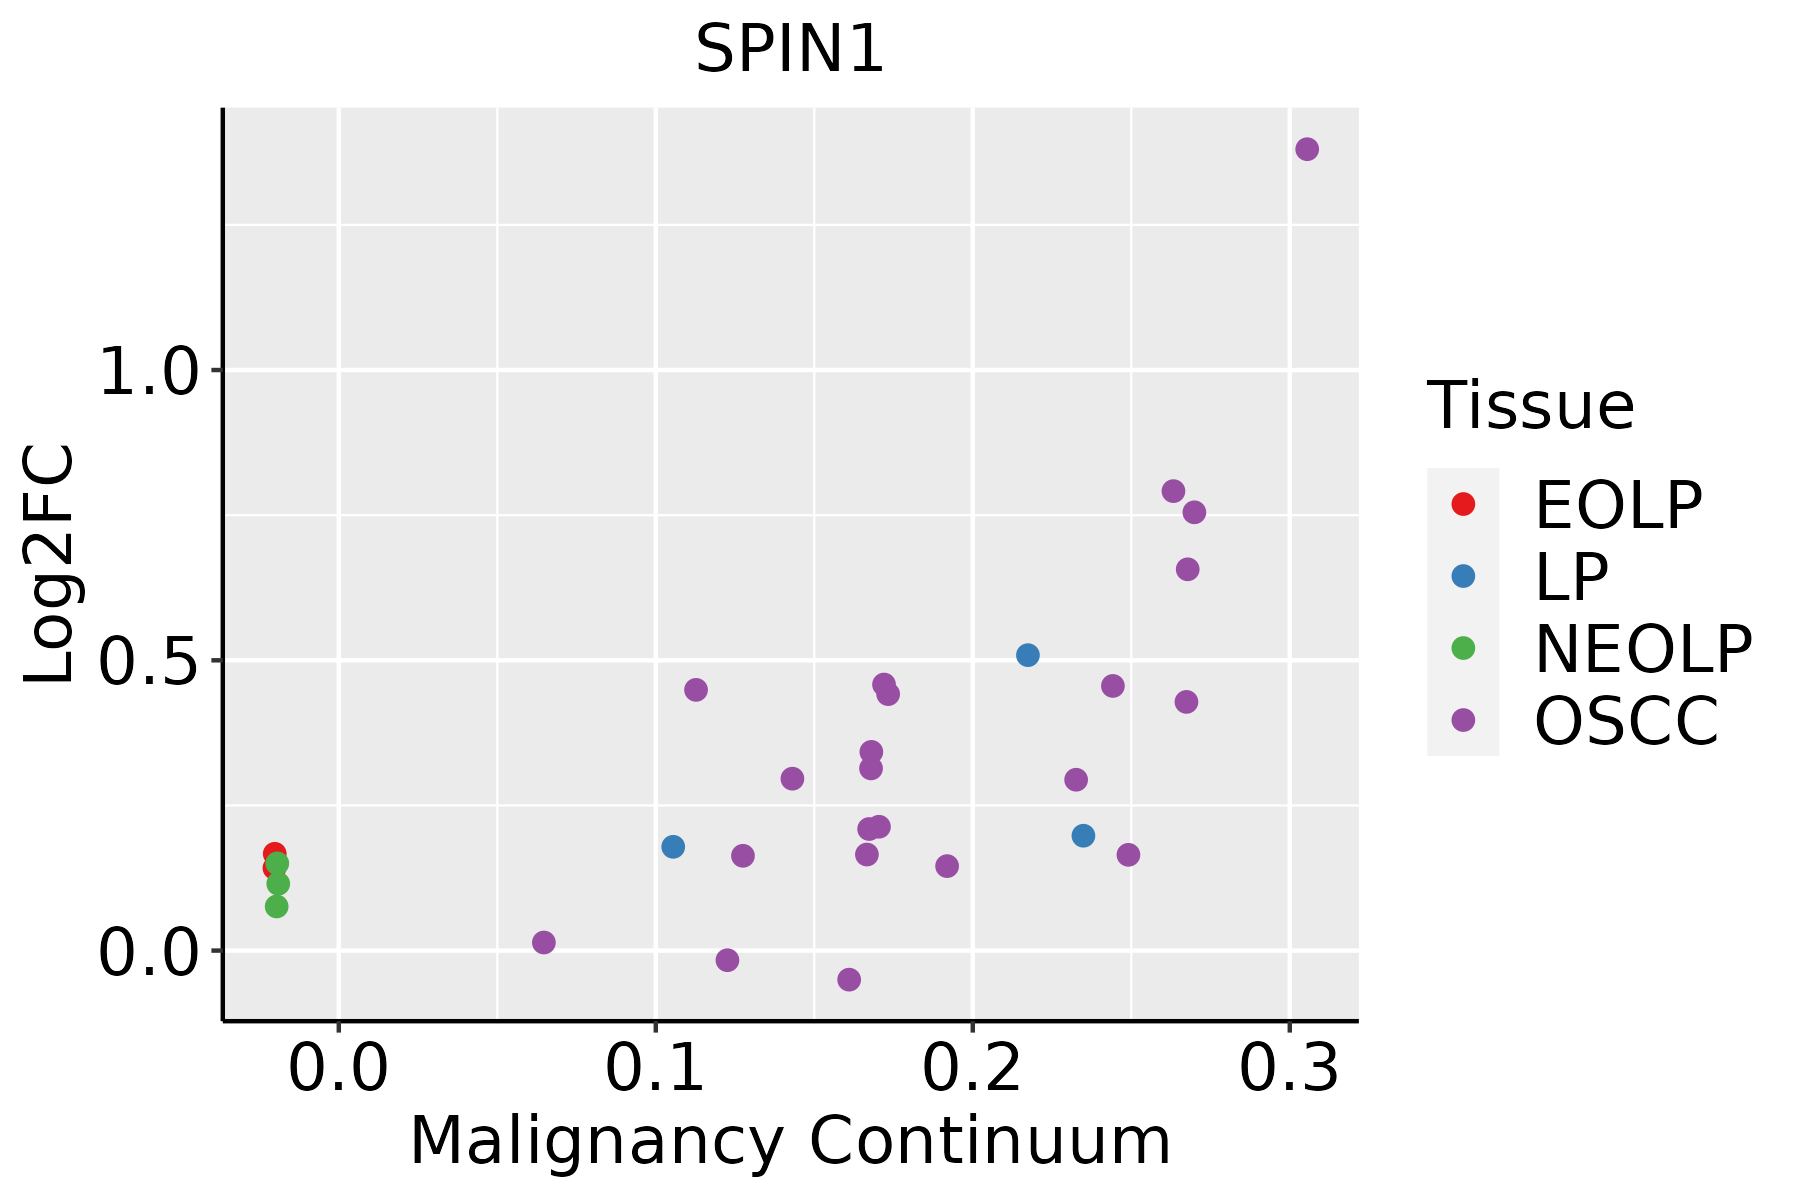 | EOLP: Erosive Oral lichen planus |
| LP: leukoplakia | ||
| NEOLP: Non-erosive oral lichen planus | ||
| OSCC: Oral squamous cell carcinoma | ||
| Prostate | 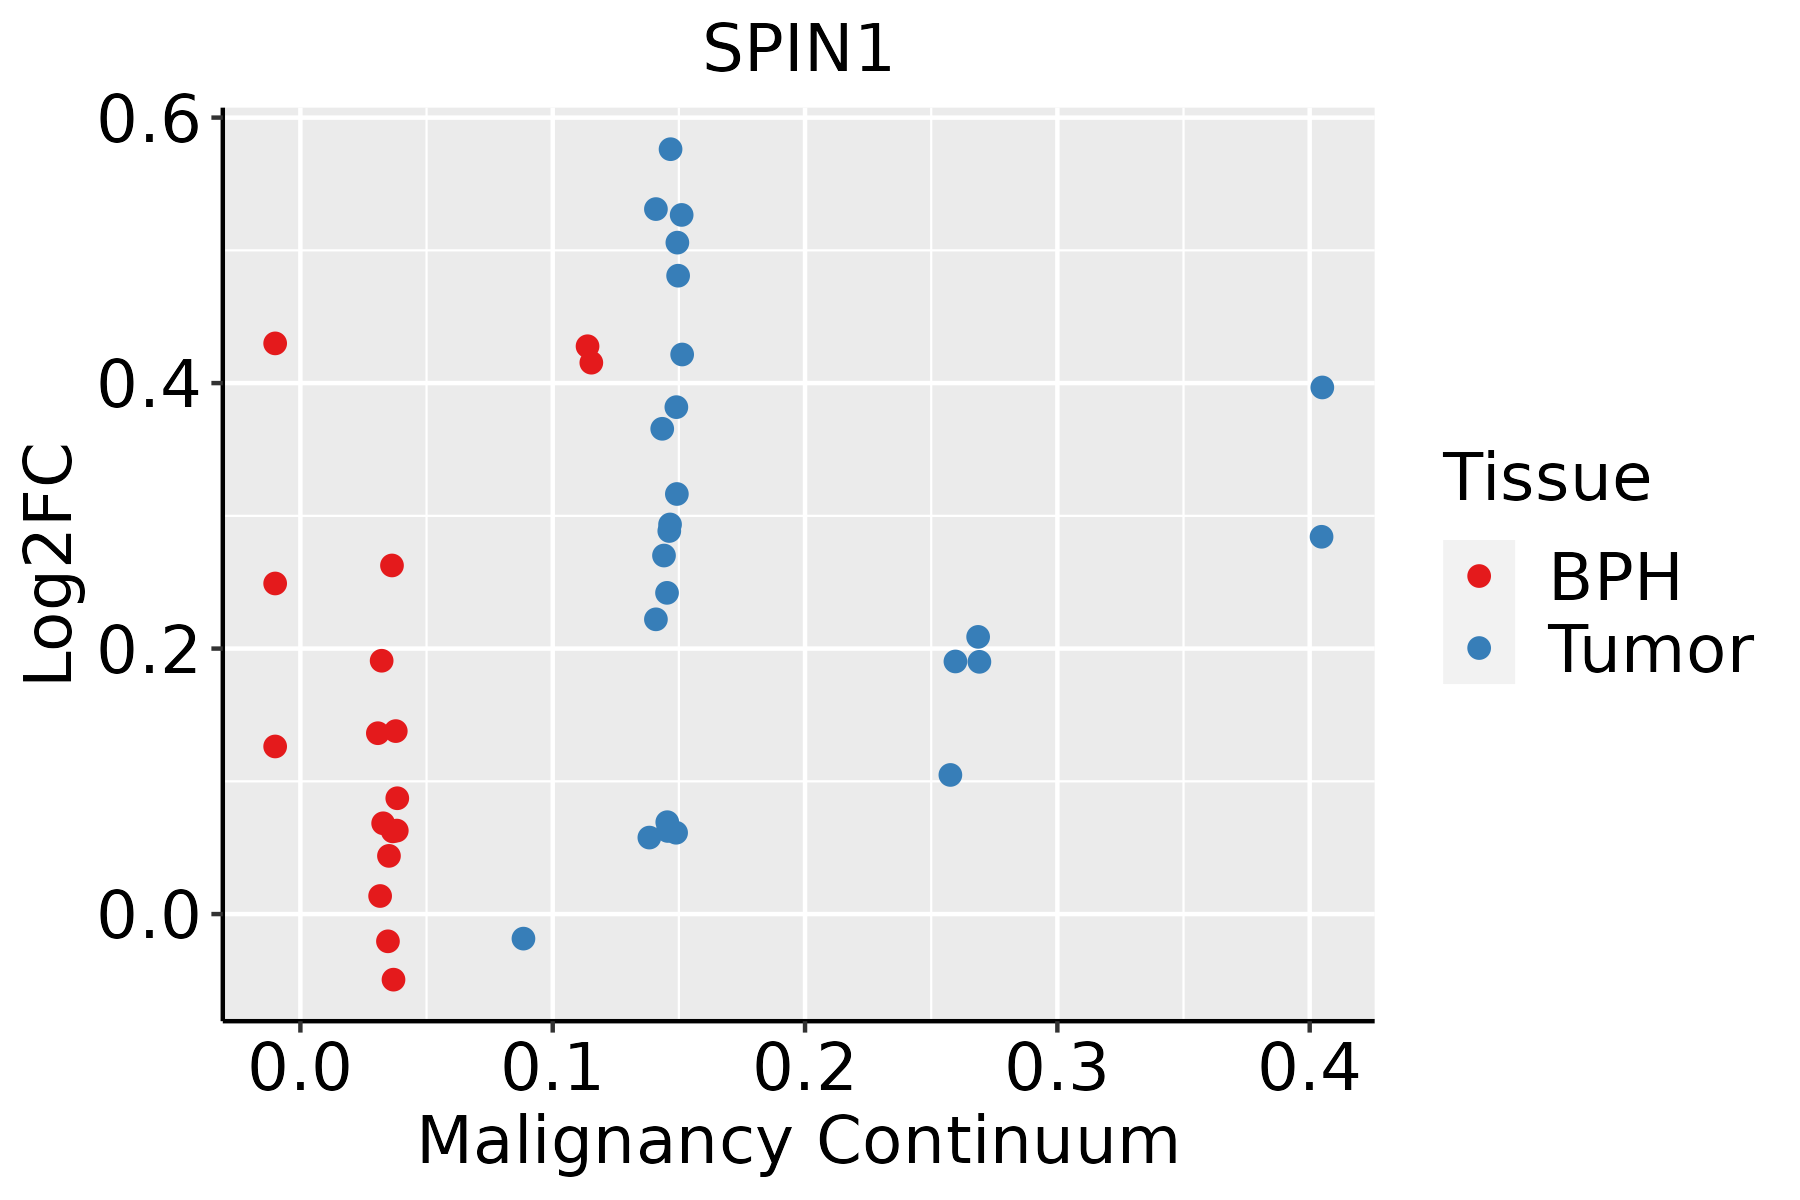 | BPH: Benign Prostatic Hyperplasia |
| Skin | 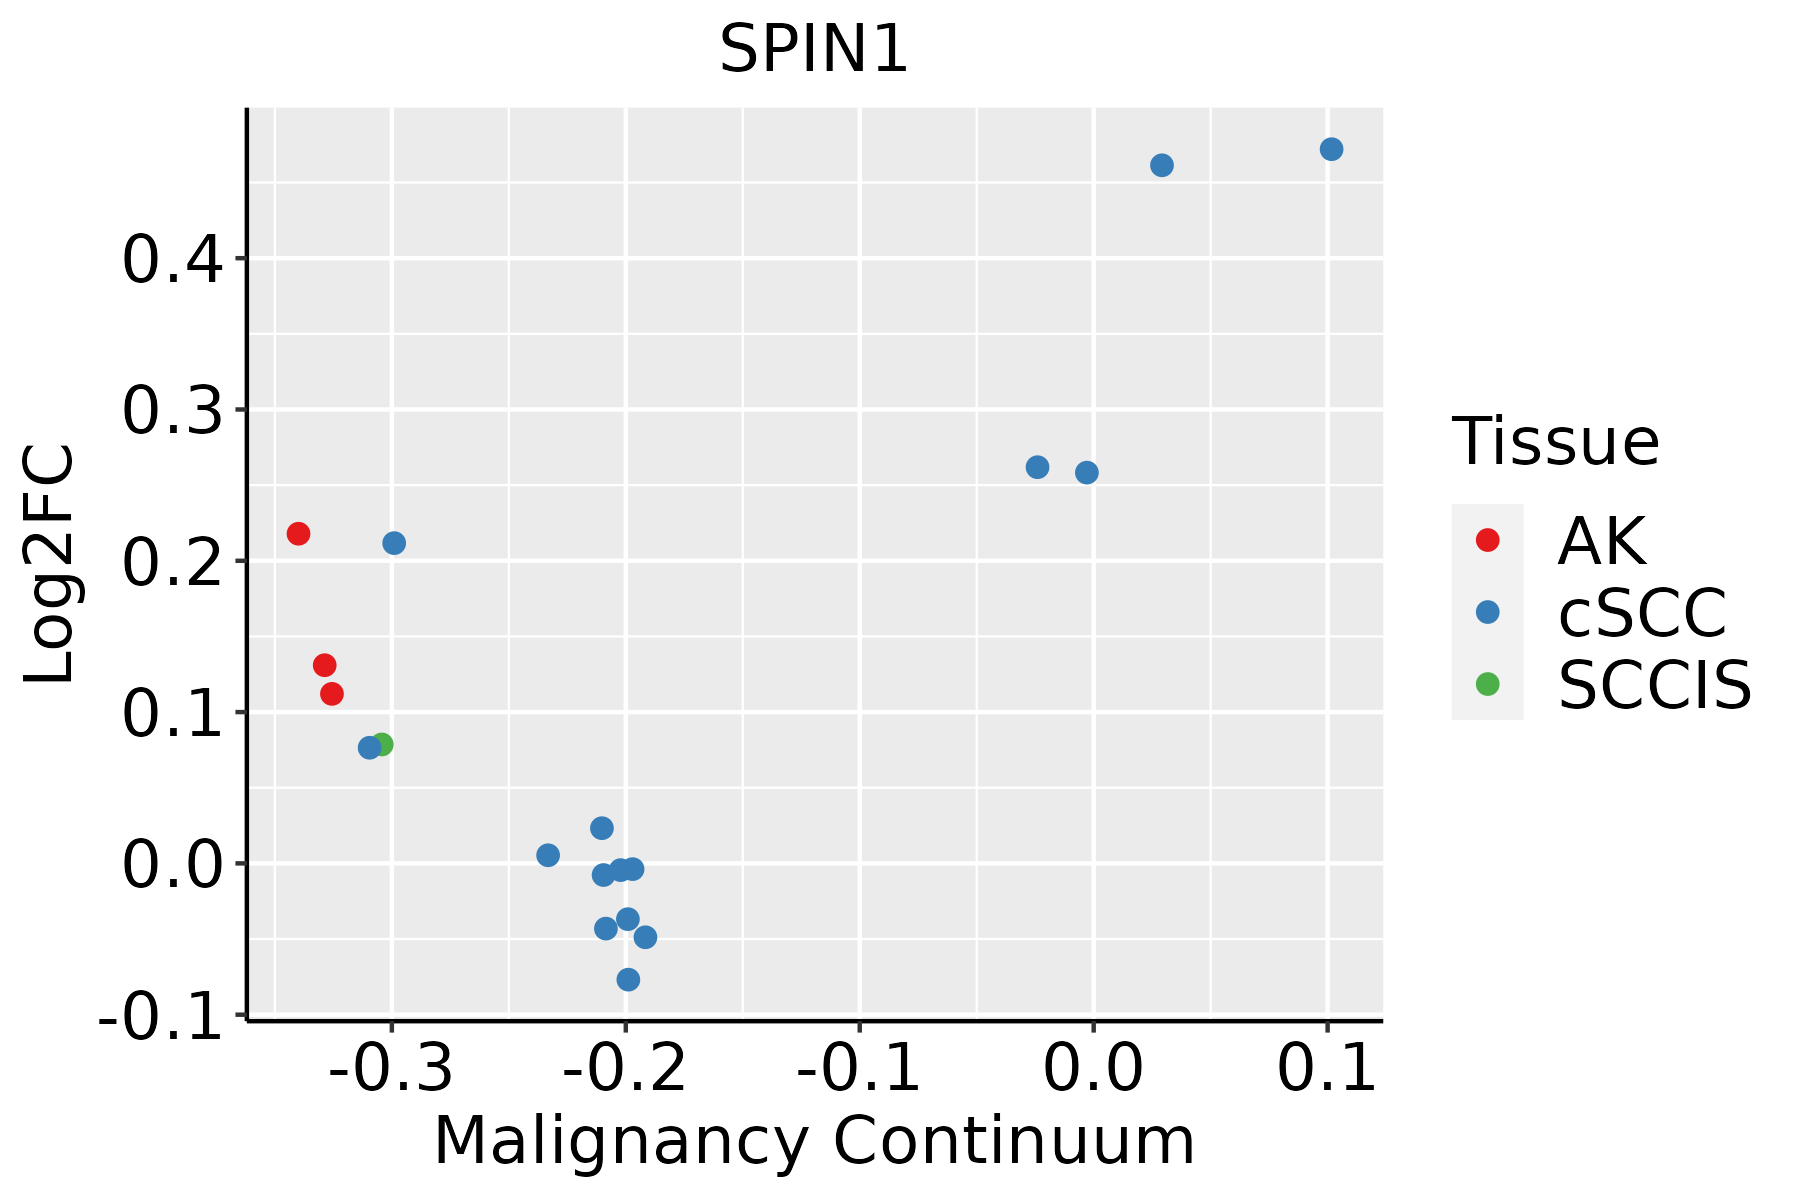 | AK: Actinic keratosis |
| cSCC: Cutaneous squamous cell carcinoma | ||
| SCCIS:squamous cell carcinoma in situ | ||
| Thyroid | 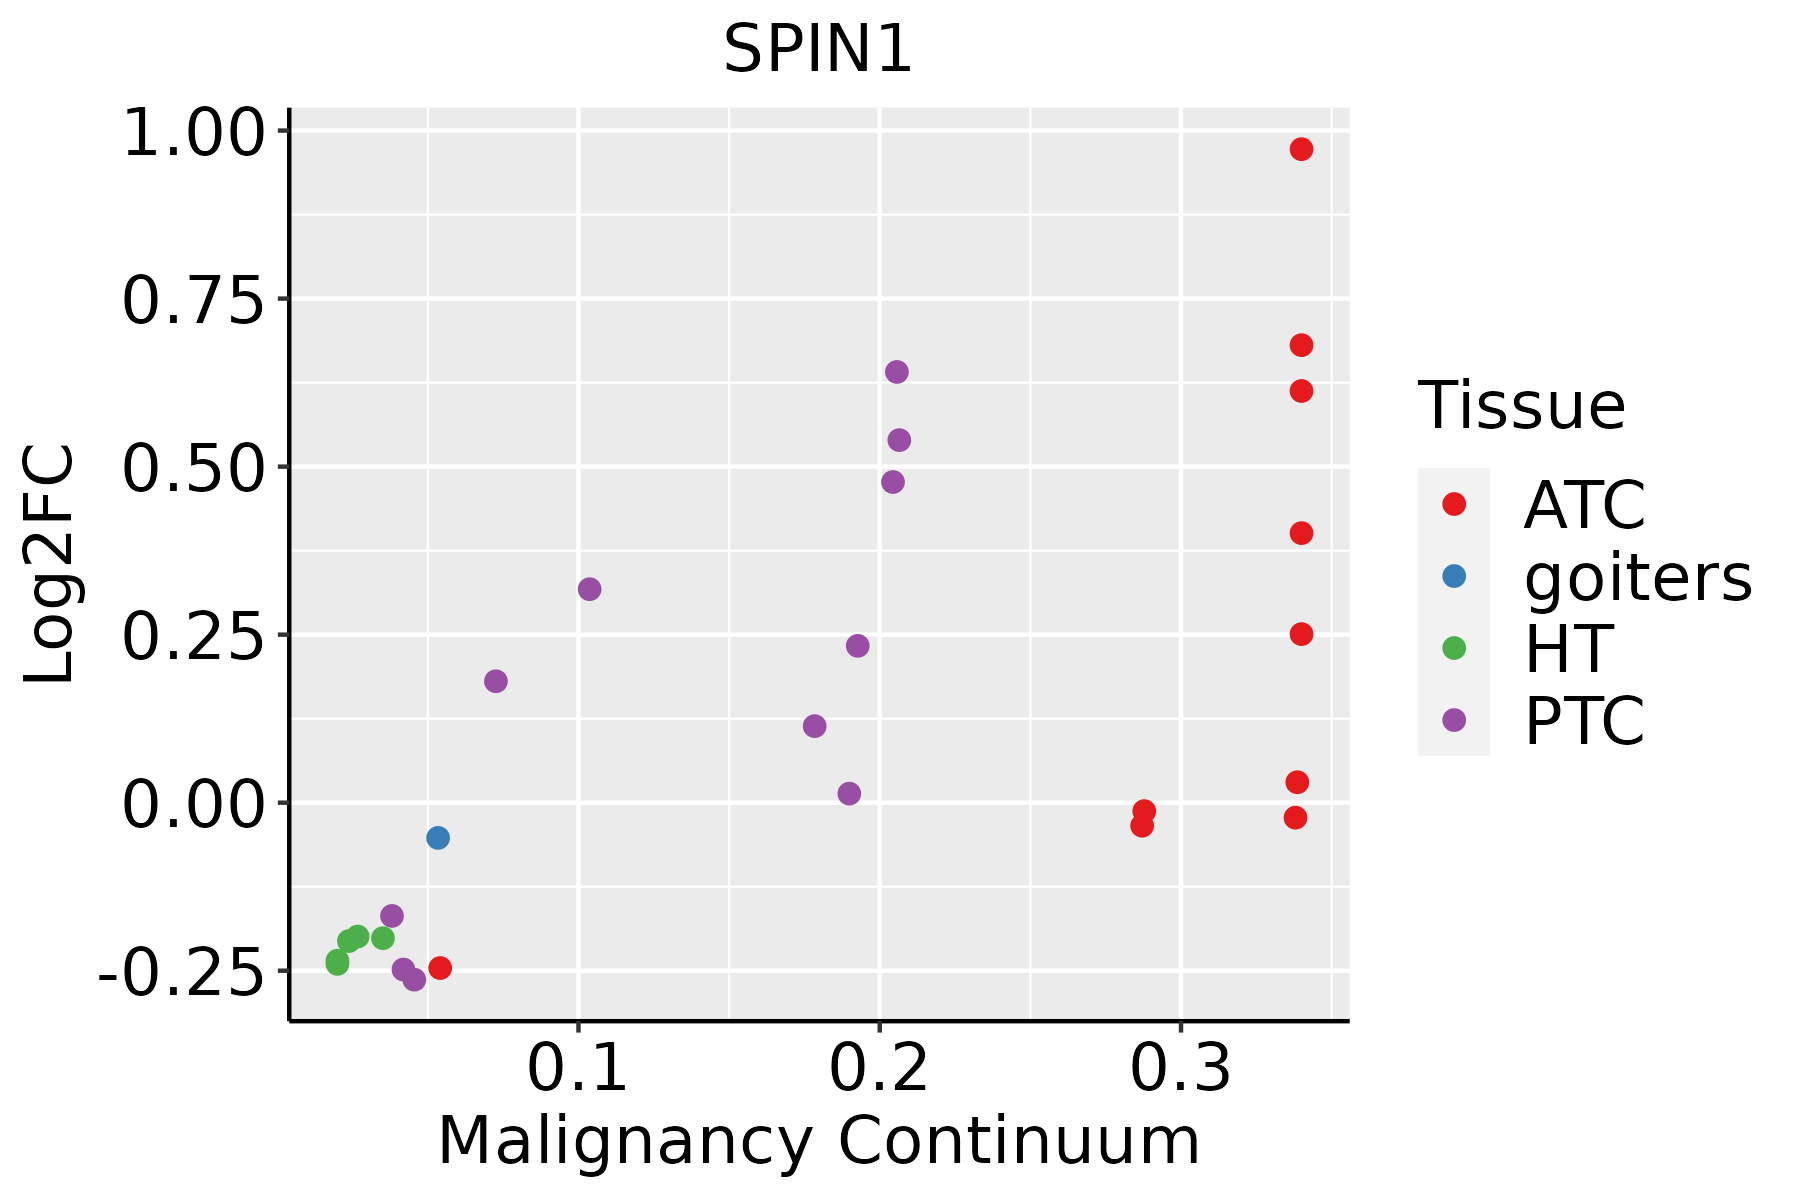 | ATC: Anaplastic thyroid cancer |
| HT: Hashimoto's thyroiditis | ||
| PTC: Papillary thyroid cancer |
| ∗log2FC in expression of this searched gene in stem-like cells from each diseased tissue sample relative to stem-like cells in normal samples in each tissue plotted against the malignancy continuum. Samples are colored based on if they are from different disease stage. |
Top |
Malignant transformation related pathway analysis |
| Find out the enriched GO biological processes and KEGG pathways involved in transition from healthy to precancer to cancer |
| Tissue | Disease Stage | Enriched GO biological Processes |
| Colorectum | AD |  |
| Colorectum | SER |  |
| Colorectum | MSS |  |
| Colorectum | MSI-H |  |
| Colorectum | FAP |  |
| ∗Top 15 enriched GO BP terms are showed in the bar plot of each disease state in each tissue. Each row represents a significant GO biological process which is colored according to the -log10(p.adjust). |
| Page: 1 2 3 4 5 6 7 8 9 |
| GO ID | Tissue | Disease Stage | Description | Gene Ratio | Bg Ratio | pvalue | p.adjust | Count |
| GO:00160557 | Cervix | CC | Wnt signaling pathway | 98/2311 | 444/18723 | 4.82e-09 | 4.65e-07 | 98 |
| GO:01987387 | Cervix | CC | cell-cell signaling by wnt | 98/2311 | 446/18723 | 6.16e-09 | 5.58e-07 | 98 |
| GO:00301117 | Cervix | CC | regulation of Wnt signaling pathway | 76/2311 | 328/18723 | 3.05e-08 | 2.08e-06 | 76 |
| GO:00063257 | Cervix | CC | chromatin organization | 78/2311 | 409/18723 | 5.40e-05 | 8.02e-04 | 78 |
| GO:00301776 | Cervix | CC | positive regulation of Wnt signaling pathway | 31/2311 | 140/18723 | 8.01e-04 | 7.02e-03 | 31 |
| GO:0030111 | Colorectum | AD | regulation of Wnt signaling pathway | 102/3918 | 328/18723 | 8.51e-06 | 2.03e-04 | 102 |
| GO:0016055 | Colorectum | AD | Wnt signaling pathway | 130/3918 | 444/18723 | 1.60e-05 | 3.37e-04 | 130 |
| GO:0198738 | Colorectum | AD | cell-cell signaling by wnt | 130/3918 | 446/18723 | 2.02e-05 | 4.10e-04 | 130 |
| GO:0006325 | Colorectum | AD | chromatin organization | 119/3918 | 409/18723 | 4.85e-05 | 8.33e-04 | 119 |
| GO:0030177 | Colorectum | AD | positive regulation of Wnt signaling pathway | 45/3918 | 140/18723 | 1.23e-03 | 1.09e-02 | 45 |
| GO:00301112 | Colorectum | MSS | regulation of Wnt signaling pathway | 98/3467 | 328/18723 | 3.37e-07 | 1.36e-05 | 98 |
| GO:00160552 | Colorectum | MSS | Wnt signaling pathway | 124/3467 | 444/18723 | 6.06e-07 | 2.26e-05 | 124 |
| GO:01987382 | Colorectum | MSS | cell-cell signaling by wnt | 124/3467 | 446/18723 | 7.83e-07 | 2.77e-05 | 124 |
| GO:00063252 | Colorectum | MSS | chromatin organization | 107/3467 | 409/18723 | 7.22e-05 | 1.21e-03 | 107 |
| GO:00301771 | Colorectum | MSS | positive regulation of Wnt signaling pathway | 44/3467 | 140/18723 | 1.57e-04 | 2.28e-03 | 44 |
| GO:00160553 | Colorectum | FAP | Wnt signaling pathway | 104/2622 | 444/18723 | 4.92e-08 | 3.92e-06 | 104 |
| GO:01987383 | Colorectum | FAP | cell-cell signaling by wnt | 104/2622 | 446/18723 | 6.26e-08 | 4.54e-06 | 104 |
| GO:00301113 | Colorectum | FAP | regulation of Wnt signaling pathway | 81/2622 | 328/18723 | 1.44e-07 | 9.03e-06 | 81 |
| GO:00301772 | Colorectum | FAP | positive regulation of Wnt signaling pathway | 37/2622 | 140/18723 | 7.46e-05 | 1.36e-03 | 37 |
| GO:00063253 | Colorectum | FAP | chromatin organization | 84/2622 | 409/18723 | 1.62e-04 | 2.47e-03 | 84 |
| Page: 1 2 3 4 5 |
| Pathway ID | Tissue | Disease Stage | Description | Gene Ratio | Bg Ratio | pvalue | p.adjust | qvalue | Count |
| Page: 1 |
Top |
Cell-cell communication analysis |
| Identification of potential cell-cell interactions between two cell types and their ligand-receptor pairs for different disease states |
| Ligand | Receptor | LRpair | Pathway | Tissue | Disease Stage |
| Page: 1 |
Top |
Single-cell gene regulatory network inference analysis |
| Find out the significant the regulons (TFs) and the target genes of each regulon across cell types for different disease states |
| TF | Cell Type | Tissue | Disease Stage | Target Gene | RSS | Regulon Activity |
| ∗The dot plots of a searched regulon are shown for all cell subpopulations in each disease state of each tissue based on the regulon specific score inferred using pySCENIC and by calculating the average expression. |
| Page: 1 |
Top |
Somatic mutation of malignant transformation related genes |
| Annotation of somatic variants for genes involved in malignant transformation |
| Hugo Symbol | Variant Class | Variant Classification | dbSNP RS | HGVSc | HGVSp | HGVSp Short | SWISSPROT | BIOTYPE | SIFT | PolyPhen | Tumor Sample Barcode | Tissue | Histology | Sex | Age | Stage | Therapy Types | Drugs | Outcome |
| SPIN1 | SNV | Missense_Mutation | novel | c.486N>T | p.Met162Ile | p.M162I | Q9Y657 | protein_coding | deleterious(0.03) | benign(0.188) | TCGA-AN-A046-01 | Breast | breast invasive carcinoma | Female | >=65 | I/II | Unknown | Unknown | SD |
| SPIN1 | SNV | Missense_Mutation | novel | c.611N>C | p.Arg204Thr | p.R204T | Q9Y657 | protein_coding | tolerated(0.57) | possibly_damaging(0.717) | TCGA-BH-A18R-01 | Breast | breast invasive carcinoma | Female | <65 | I/II | Unknown | Unknown | SD |
| SPIN1 | SNV | Missense_Mutation | novel | c.226N>A | p.Val76Ile | p.V76I | Q9Y657 | protein_coding | tolerated(0.24) | possibly_damaging(0.723) | TCGA-2W-A8YY-01 | Cervix | cervical & endocervical cancer | Female | <65 | I/II | Chemotherapy | cisplatin | CR |
| SPIN1 | SNV | Missense_Mutation | rs201082729 | c.518N>G | p.Asp173Gly | p.D173G | Q9Y657 | protein_coding | deleterious(0) | probably_damaging(0.99) | TCGA-EA-A410-01 | Cervix | cervical & endocervical cancer | Female | <65 | I/II | Unknown | Unknown | SD |
| SPIN1 | SNV | Missense_Mutation | c.771N>G | p.Asp257Glu | p.D257E | Q9Y657 | protein_coding | deleterious(0.01) | possibly_damaging(0.49) | TCGA-AA-3510-01 | Colorectum | colon adenocarcinoma | Male | >=65 | I/II | Unknown | Unknown | SD | |
| SPIN1 | SNV | Missense_Mutation | c.500N>G | p.Tyr167Cys | p.Y167C | Q9Y657 | protein_coding | deleterious(0) | probably_damaging(0.996) | TCGA-AA-3864-01 | Colorectum | colon adenocarcinoma | Male | >=65 | I/II | Unknown | Unknown | SD | |
| SPIN1 | SNV | Missense_Mutation | rs751098696 | c.35N>A | p.Arg12Gln | p.R12Q | Q9Y657 | protein_coding | tolerated(0.63) | benign(0.001) | TCGA-AA-A02R-01 | Colorectum | colon adenocarcinoma | Female | >=65 | I/II | Unknown | Unknown | PD |
| SPIN1 | SNV | Missense_Mutation | c.432N>T | p.Glu144Asp | p.E144D | Q9Y657 | protein_coding | tolerated(0.11) | benign(0.005) | TCGA-AD-A5EJ-01 | Colorectum | colon adenocarcinoma | Female | >=65 | I/II | Unknown | Unknown | SD | |
| SPIN1 | SNV | Missense_Mutation | novel | c.81G>T | p.Met27Ile | p.M27I | Q9Y657 | protein_coding | tolerated(0.13) | benign(0.001) | TCGA-CA-6717-01 | Colorectum | colon adenocarcinoma | Male | <65 | I/II | Chemotherapy | oxaliplatin | CR |
| SPIN1 | SNV | Missense_Mutation | novel | c.365N>A | p.Arg122Gln | p.R122Q | Q9Y657 | protein_coding | tolerated(1) | benign(0.379) | TCGA-F5-6814-01 | Colorectum | rectum adenocarcinoma | Male | <65 | I/II | Unknown | Unknown | SD |
| Page: 1 2 3 4 |
Top |
Related drugs of malignant transformation related genes |
| Identification of chemicals and drugs interact with genes involved in malignant transfromation |
| (DGIdb 4.0) |
| Entrez ID | Symbol | Category | Interaction Types | Drug Claim Name | Drug Name | PMIDs |
| Page: 1 |

Copyright 2023-Present -The University of Texas Health Science Center at Houston |