Schematic overview of the cellular and molecular mechanisms involved in the cancer progression, including the proposed cellular and molecular mechanisms in cancer cells trajectory. AT1: alveolar type 1 cells; AT2: alveolar type 2 cells; AAH: atypical adenomatous hyperplasia; AIS: adenocarcinoma in situ; MIA: minimally invasive adenocarcinoma; IA: invasive adenocarcinoma; EMT: epithelial-mesenchymal transition

Home

Download

Statistics

Help

Contact

Center for Computational Systems Medicine
leaf

Gene summary

leaf

Malignant transformation analysis

leaf

Malignant transformation related pathway analysis

leaf

Cell-cell communication analysis

leaf

Single-cell gene regulatory network inference analysis

leaf

Somatic mutation of malignant transformation related genes

leaf

Related drugs of malignant transformation related genes

Gene: SPIDR

Gene summary for SPIDR

check button Gene summary.

Gene informationSpeciesHuman
Gene symbol

SPIDR

Gene ID

23514

Gene namescaffold protein involved in DNA repair
Gene AliasKIAA0146
Cytomap8q11.21
Gene Typeprotein-coding
GO ID

GO:0000018

UniProtAcc

Q14159


Top

Malignant transformation analysis

check button Identification of the aberrant gene expression in precancerous and cancerous lesions by comparing the gene expression of stem-like cells in diseased tissues with normal stem cells
check button Malignant transformation involving gene list.
Entrez IDSymbolReplicatesSpeciesOrganTissueAdj P-valueLog2FCMalignancy
23514SPIDRCCI_1HumanCervixCC5.35e-211.85e+000.528
23514SPIDRCCI_2HumanCervixCC3.41e-111.49e+000.5249
23514SPIDRCCI_3HumanCervixCC3.75e-201.48e+000.516
23514SPIDRCCII_1HumanCervixCC1.28e-126.32e-010.3249
23514SPIDRHTA11_3410_2000001011HumanColorectumAD1.66e-26-6.41e-010.0155
23514SPIDRHTA11_2487_2000001011HumanColorectumSER1.12e-06-4.49e-01-0.1808
23514SPIDRHTA11_3361_2000001011HumanColorectumAD1.59e-02-4.47e-01-0.1207
23514SPIDRHTA11_5216_2000001011HumanColorectumSER1.84e-04-7.56e-01-0.1462
23514SPIDRHTA11_9341_2000001011HumanColorectumSER2.70e-02-5.55e-01-0.00410000000000005
23514SPIDRHTA11_7862_2000001011HumanColorectumAD2.45e-03-3.45e-01-0.0179
23514SPIDRHTA11_866_3004761011HumanColorectumAD2.12e-03-3.98e-010.096
23514SPIDRHTA11_8622_2000001021HumanColorectumSER7.56e-08-7.21e-010.0528
23514SPIDRHTA11_7469_2000001011HumanColorectumAD7.57e-04-7.03e-01-0.0124
23514SPIDRHTA11_99999970781_79442HumanColorectumMSS6.12e-06-4.58e-010.294
23514SPIDRHTA11_99999965062_69753HumanColorectumMSI-H3.86e-023.79e-010.3487
23514SPIDRHTA11_99999965104_69814HumanColorectumMSS1.06e-034.83e-010.281
23514SPIDRF007HumanColorectumFAP6.43e-04-7.30e-020.1176
23514SPIDRA015-C-203HumanColorectumFAP1.21e-28-3.51e-01-0.1294
23514SPIDRA015-C-204HumanColorectumFAP1.61e-09-3.44e-01-0.0228
23514SPIDRA014-C-040HumanColorectumFAP6.30e-07-3.42e-01-0.1184
Page: 1 2 3 4 5 6 7 8 9 10 11 12 

check button Transcriptomic changes along malignancy continuum.
TissueExpression DynamicsAbbreviation
CervixThe image shows the transcriptomic changes along malignancy continuum.log2FC in expression of this searched gene in stem-like cells from each diseased tissue sample relative to stem-like cells in normal samples in each tissue plotted against the malignancy continuum. Samples are colored based on if they are from different disease stage.CC: Cervix cancer
HSIL_HPV: HPV-infected high-grade squamous intraepithelial lesions
N_HPV: HPV-infected normal cervix
Colorectum (GSE201348)The image shows the transcriptomic changes along malignancy continuum.log2FC in expression of this searched gene in stem-like cells from each diseased tissue sample relative to stem-like cells in normal samples in each tissue plotted against the malignancy continuum. Samples are colored based on if they are from different disease stage.FAP: Familial adenomatous polyposis
CRC: Colorectal cancer
Colorectum (HTA11)The image shows the transcriptomic changes along malignancy continuum.log2FC in expression of this searched gene in stem-like cells from each diseased tissue sample relative to stem-like cells in normal samples in each tissue plotted against the malignancy continuum. Samples are colored based on if they are from different disease stage.AD: Adenomas
SER: Sessile serrated lesions
MSI-H: Microsatellite-high colorectal cancer
MSS: Microsatellite stable colorectal cancer
EndometriumThe image shows the transcriptomic changes along malignancy continuum.log2FC in expression of this searched gene in stem-like cells from each diseased tissue sample relative to stem-like cells in normal samples in each tissue plotted against the malignancy continuum. Samples are colored based on if they are from different disease stage.
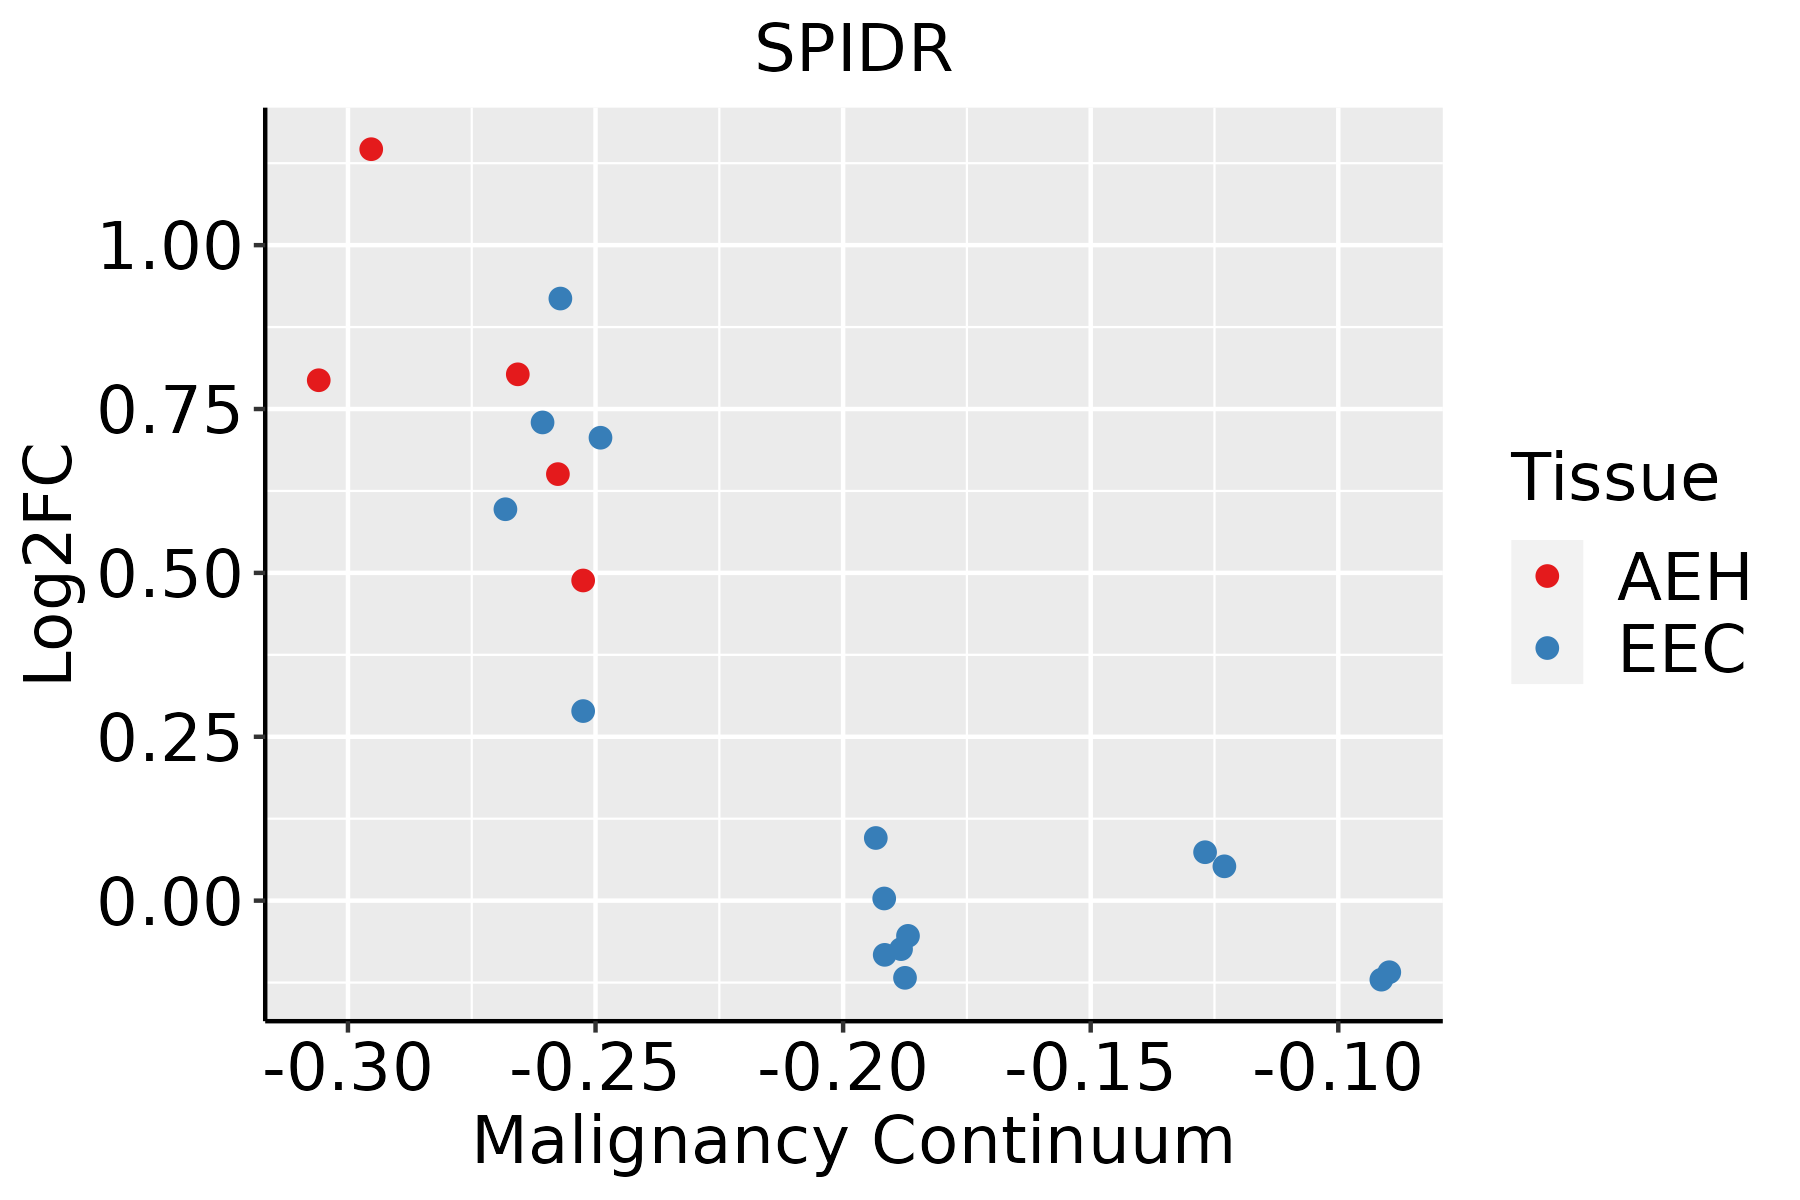
AEH: Atypical endometrial hyperplasia
EEC: Endometrioid Cancer
EsophagusThe image shows the transcriptomic changes along malignancy continuum.log2FC in expression of this searched gene in stem-like cells from each diseased tissue sample relative to stem-like cells in normal samples in each tissue plotted against the malignancy continuum. Samples are colored based on if they are from different disease stage.ESCC: Esophageal squamous cell carcinoma
HGIN: High-grade intraepithelial neoplasias
LGIN: Low-grade intraepithelial neoplasias
GCThe image shows the transcriptomic changes along malignancy continuum.log2FC in expression of this searched gene in stem-like cells from each diseased tissue sample relative to stem-like cells in normal samples in each tissue plotted against the malignancy continuum. Samples are colored based on if they are from different disease stage.CAG: Chronic atrophic gastritis
CAG with IM: Chronic atrophic gastritis with intestinal metaplasia
CSG: Chronic superficial gastritis
GC: Gastric cancer
SIM: Severe intestinal metaplasia
WIM: Wild intestinal metaplasia
LiverThe image shows the transcriptomic changes along malignancy continuum.log2FC in expression of this searched gene in stem-like cells from each diseased tissue sample relative to stem-like cells in normal samples in each tissue plotted against the malignancy continuum. Samples are colored based on if they are from different disease stage.
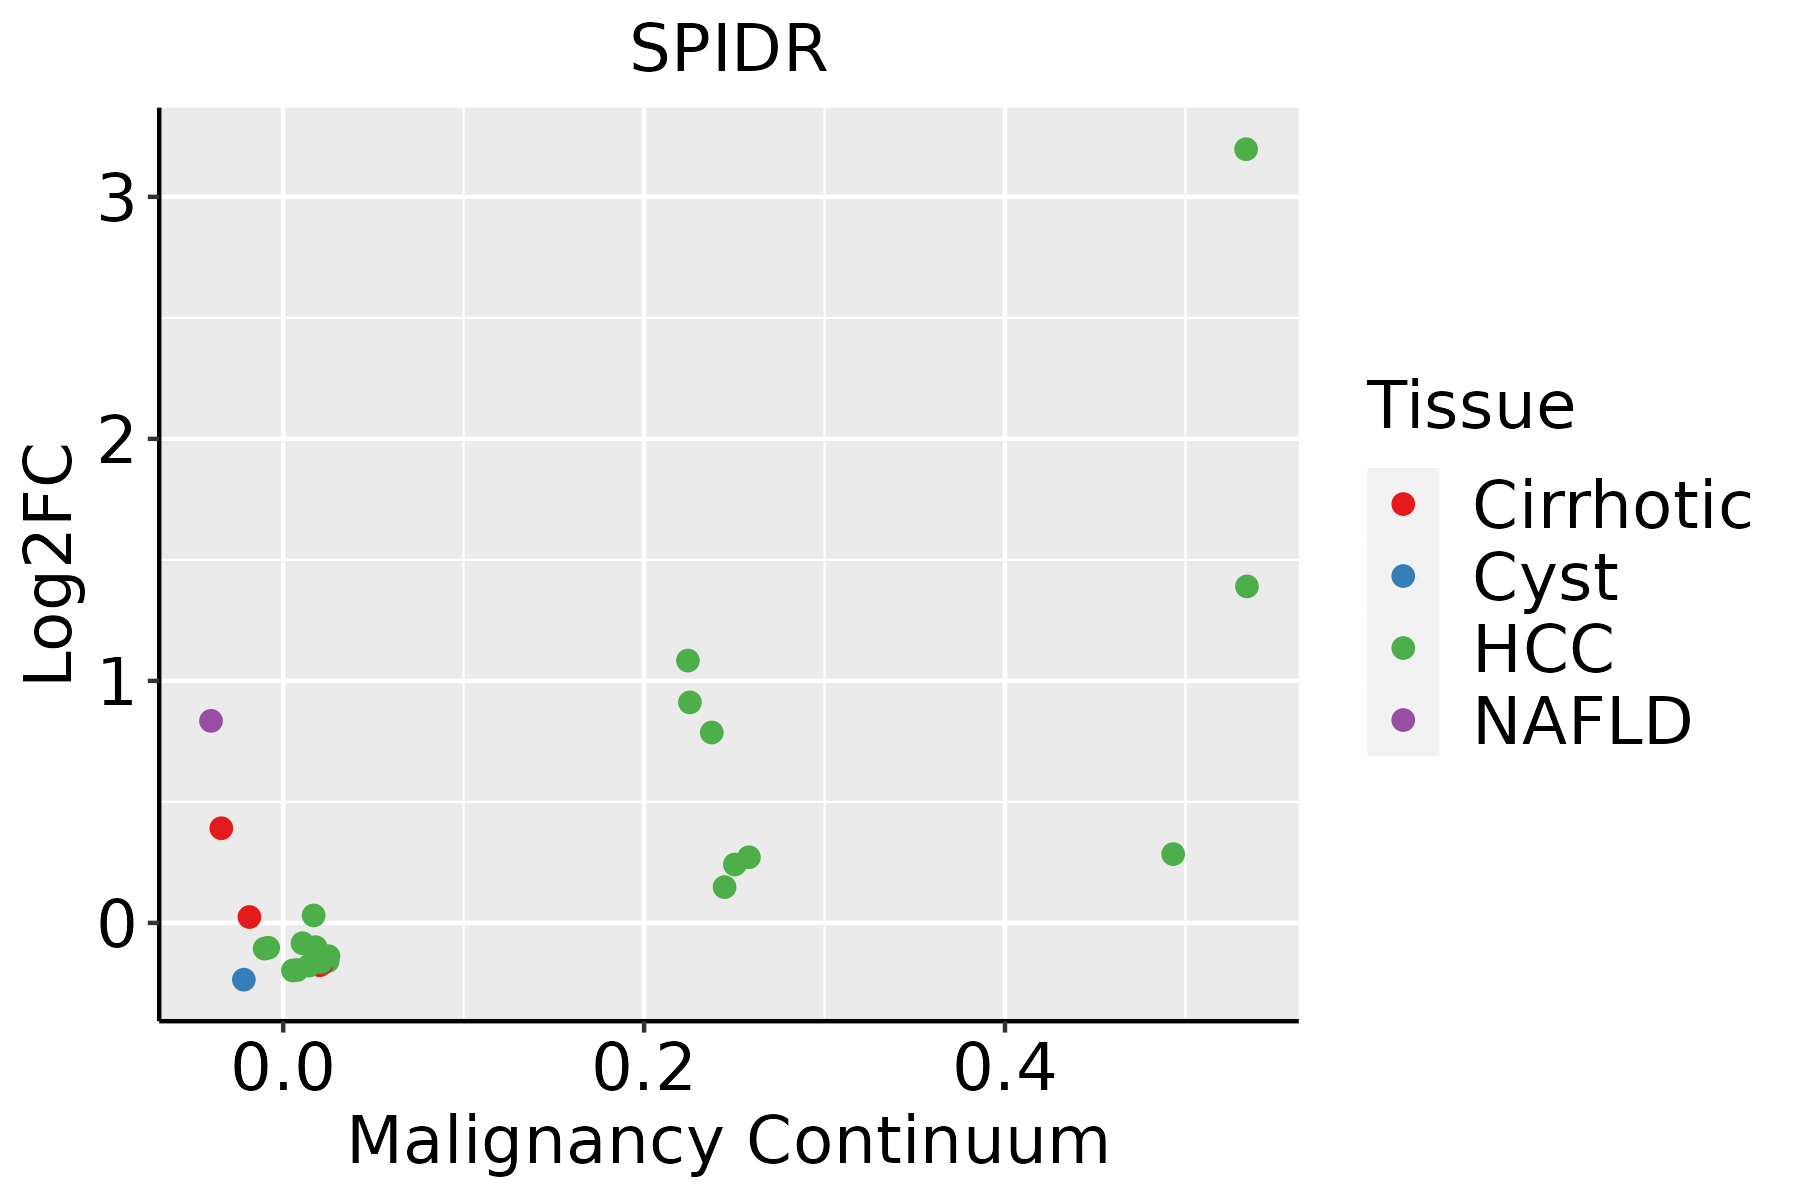
HCC: Hepatocellular carcinoma
NAFLD: Non-alcoholic fatty liver disease
LungThe image shows the transcriptomic changes along malignancy continuum.log2FC in expression of this searched gene in stem-like cells from each diseased tissue sample relative to stem-like cells in normal samples in each tissue plotted against the malignancy continuum. Samples are colored based on if they are from different disease stage.
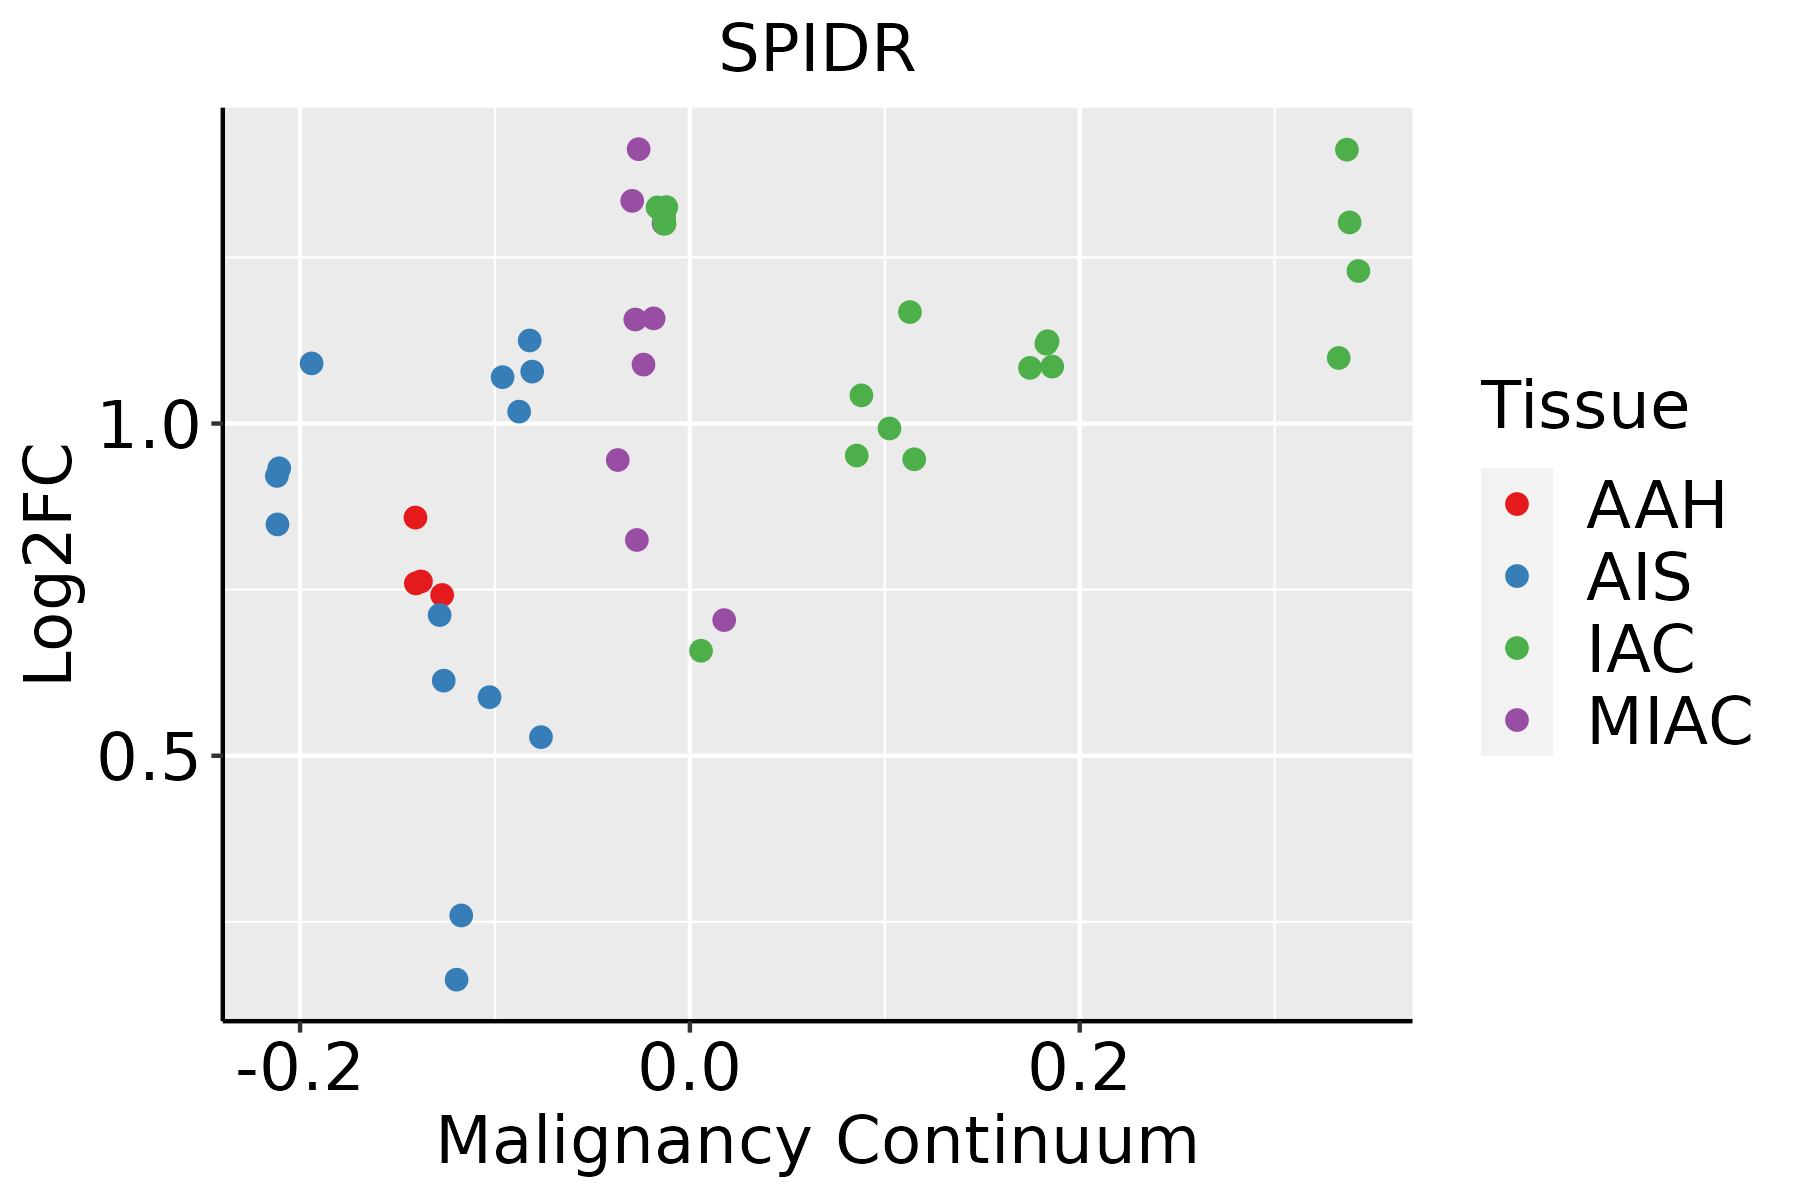
AAH: Atypical adenomatous hyperplasia
AIS: Adenocarcinoma in situ
IAC: Invasive lung adenocarcinoma
MIA: Minimally invasive adenocarcinoma
Oral CavityThe image shows the transcriptomic changes along malignancy continuum.log2FC in expression of this searched gene in stem-like cells from each diseased tissue sample relative to stem-like cells in normal samples in each tissue plotted against the malignancy continuum. Samples are colored based on if they are from different disease stage.
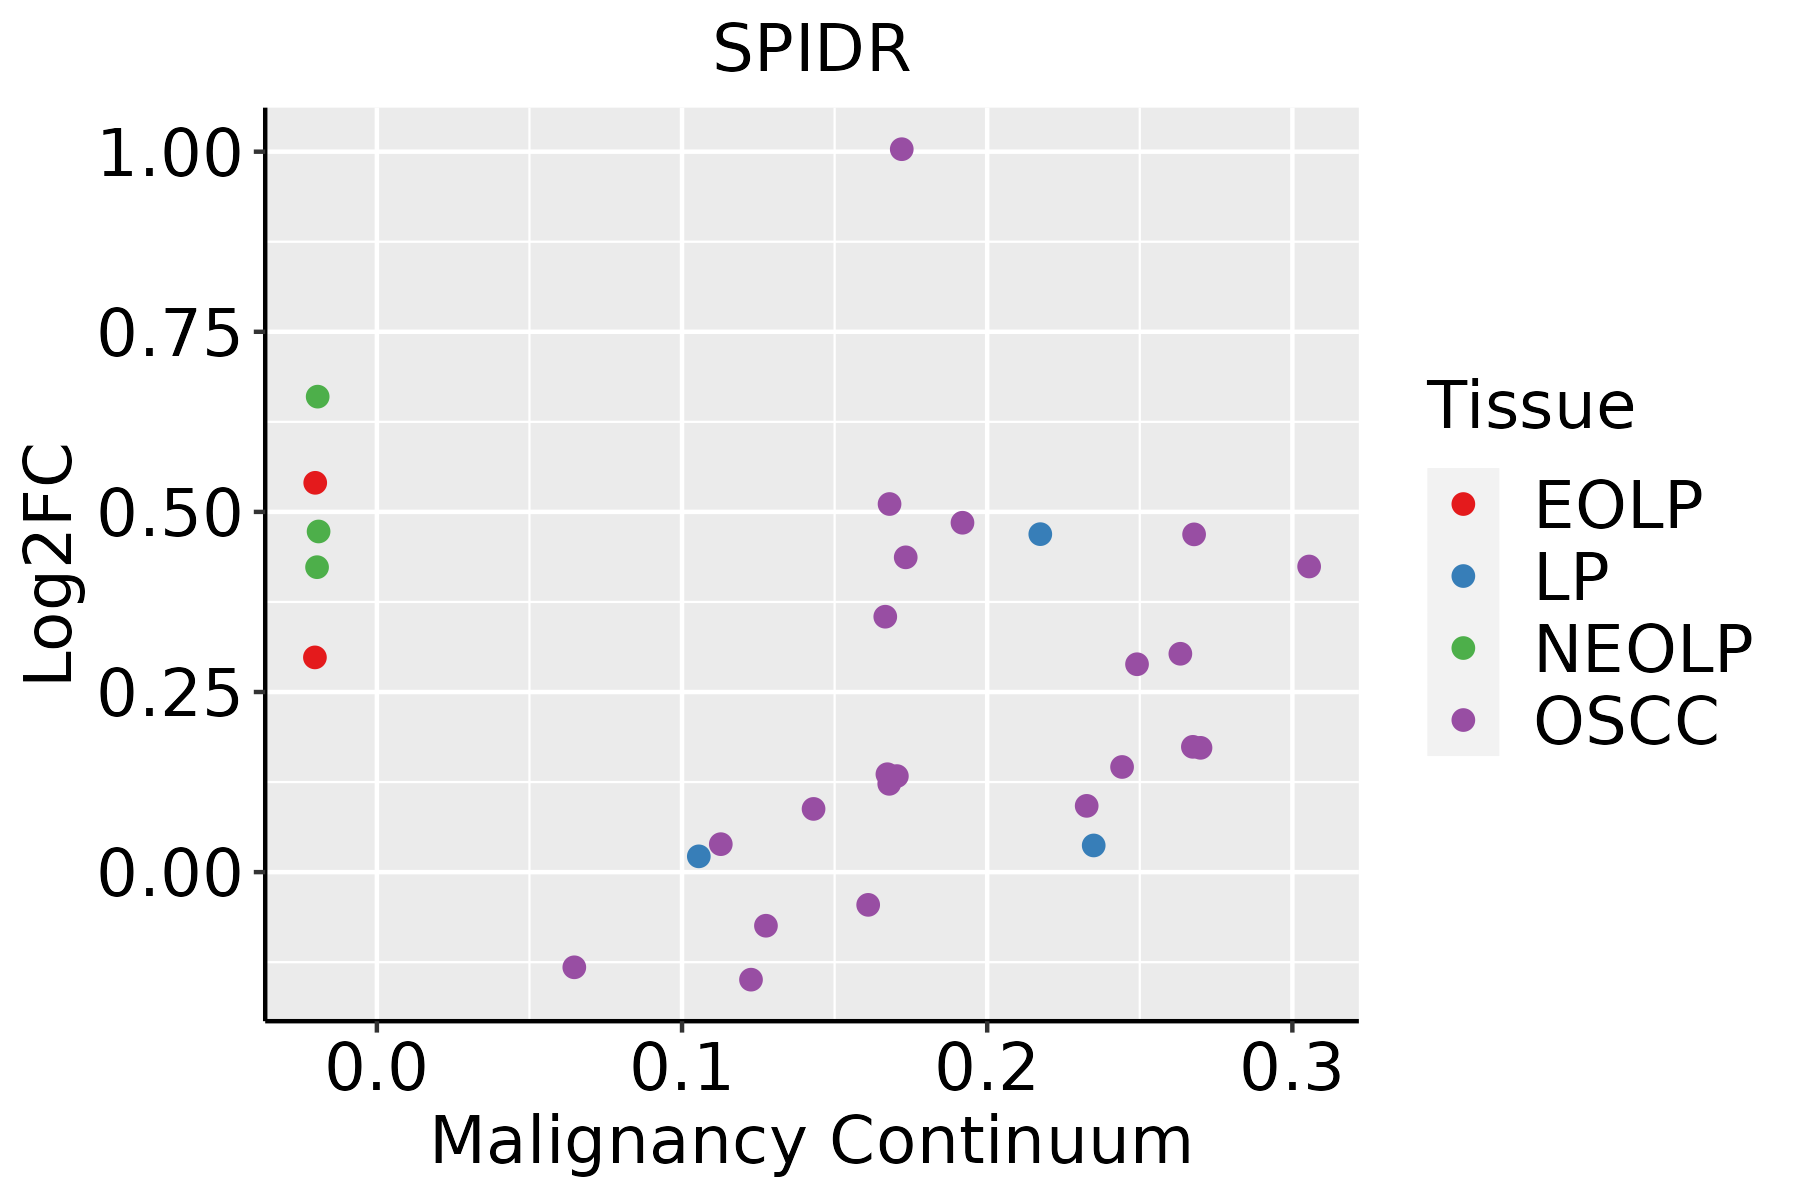
EOLP: Erosive Oral lichen planus
LP: leukoplakia
NEOLP: Non-erosive oral lichen planus
OSCC: Oral squamous cell carcinoma
ProstateThe image shows the transcriptomic changes along malignancy continuum.log2FC in expression of this searched gene in stem-like cells from each diseased tissue sample relative to stem-like cells in normal samples in each tissue plotted against the malignancy continuum. Samples are colored based on if they are from different disease stage.
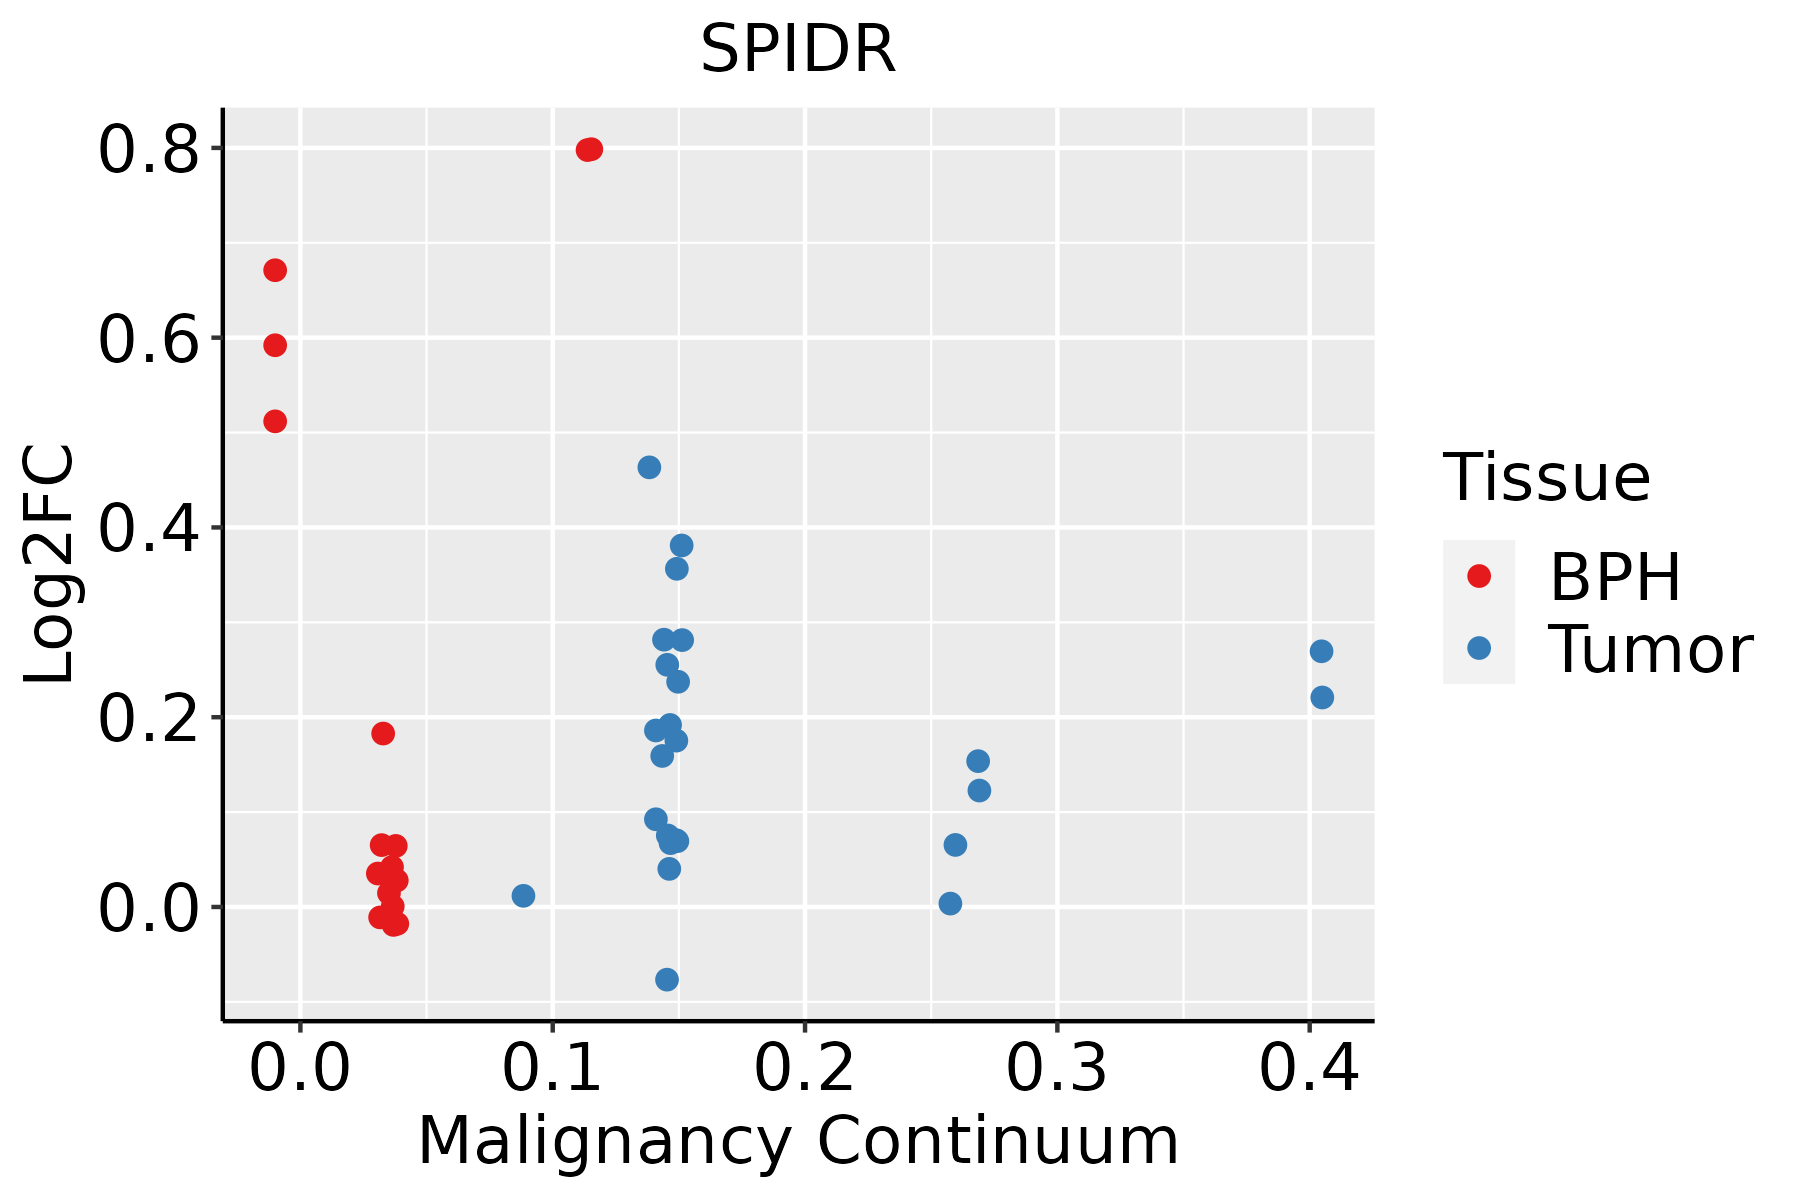
BPH: Benign Prostatic Hyperplasia
SkinThe image shows the transcriptomic changes along malignancy continuum.log2FC in expression of this searched gene in stem-like cells from each diseased tissue sample relative to stem-like cells in normal samples in each tissue plotted against the malignancy continuum. Samples are colored based on if they are from different disease stage.
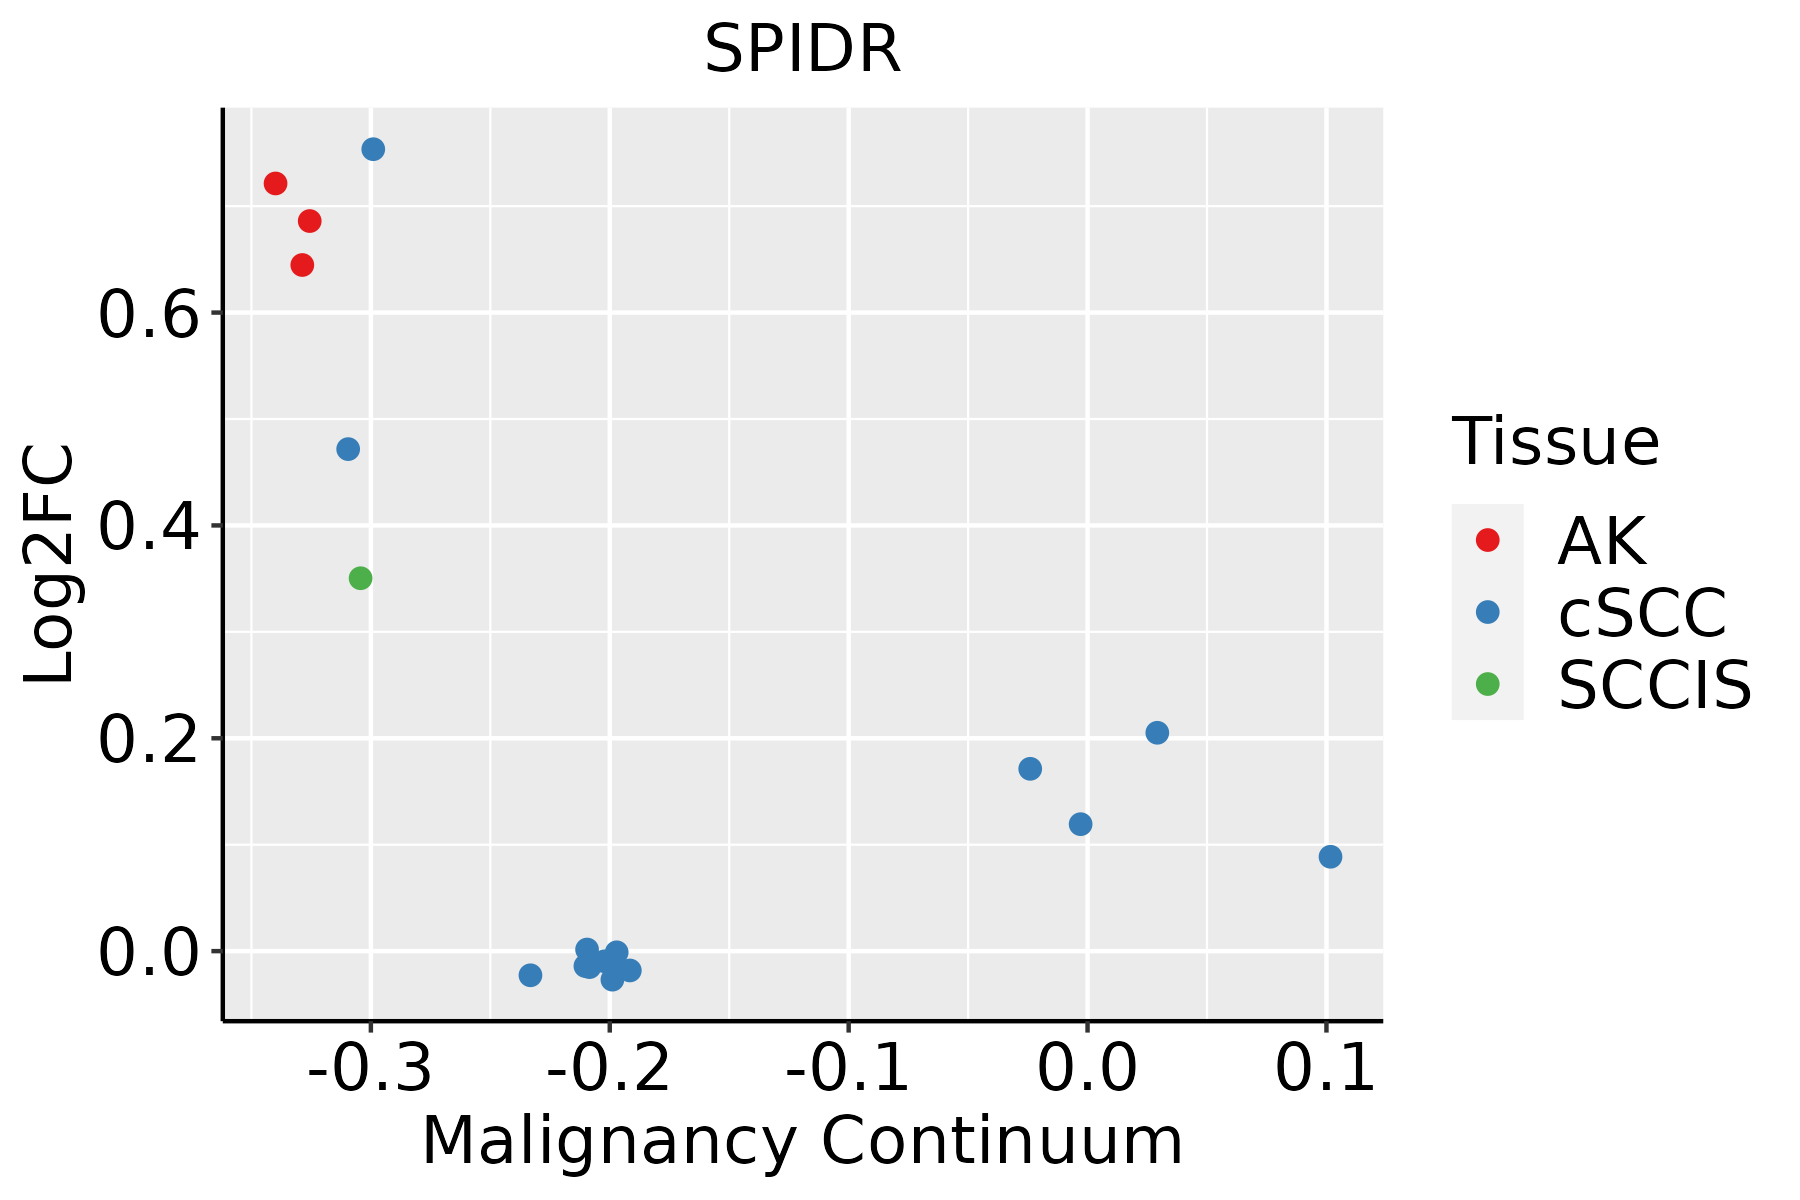
AK: Actinic keratosis
cSCC: Cutaneous squamous cell carcinoma
SCCIS:squamous cell carcinoma in situ
∗log2FC in expression of this searched gene in stem-like cells from each diseased tissue sample relative to stem-like cells in normal samples in each tissue plotted against the malignancy continuum. Samples are colored based on if they are from different disease stage.

Top

Malignant transformation related pathway analysis

check buttonFind out the enriched GO biological processes and KEGG pathways involved in transition from healthy to precancer to cancer
check button Figure of enriched GO biological processes.
TissueDisease StageEnriched GO biological Processes
ColorectumADGO analysis - Figure of enriched GO biological processes: Top 15 enriched GO BP terms are showed in the bar plot of each disease state in each tissue. Each row represents a significant GO biological process which is colored according to the -log10(p.adjust).
ColorectumSERGO analysis - Figure of enriched GO biological processes: Top 15 enriched GO BP terms are showed in the bar plot of each disease state in each tissue. Each row represents a significant GO biological process which is colored according to the -log10(p.adjust).
ColorectumMSSGO analysis - Figure of enriched GO biological processes: Top 15 enriched GO BP terms are showed in the bar plot of each disease state in each tissue. Each row represents a significant GO biological process which is colored according to the -log10(p.adjust).
ColorectumMSI-HGO analysis - Figure of enriched GO biological processes: Top 15 enriched GO BP terms are showed in the bar plot of each disease state in each tissue. Each row represents a significant GO biological process which is colored according to the -log10(p.adjust).
ColorectumFAPGO analysis - Figure of enriched GO biological processes: Top 15 enriched GO BP terms are showed in the bar plot of each disease state in each tissue. Each row represents a significant GO biological process which is colored according to the -log10(p.adjust).
∗Top 15 enriched GO BP terms are showed in the bar plot of each disease state in each tissue. Each row represents a significant GO biological process which is colored according to the -log10(p.adjust).
Page: 1 2 3 4 5 6 7 8 9 

check button Enriched GO biological processes.
GO IDTissueDisease StageDescriptionGene RatioBg Ratiopvaluep.adjustCount
GO:00725949CervixCCestablishment of protein localization to organelle99/2311422/187231.23e-102.11e-0899
GO:004325410CervixCCregulation of protein-containing complex assembly96/2311428/187232.91e-093.05e-0796
GO:003133410CervixCCpositive regulation of protein-containing complex assembly55/2311237/187232.25e-066.73e-0555
GO:00712148CervixCCcellular response to abiotic stimulus69/2311331/187237.36e-061.73e-0469
GO:01040048CervixCCcellular response to environmental stimulus69/2311331/187237.36e-061.73e-0469
GO:00714798CervixCCcellular response to ionizing radiation22/231172/187233.47e-055.60e-0422
GO:00093149CervixCCresponse to radiation86/2311456/187233.50e-055.63e-0486
GO:00714786CervixCCcellular response to radiation41/2311186/187231.41e-041.71e-0341
GO:20010209CervixCCregulation of response to DNA damage stimulus46/2311219/187231.92e-042.23e-0346
GO:00102126CervixCCresponse to ionizing radiation34/2311148/187232.23e-042.53e-0334
GO:00510528CervixCCregulation of DNA metabolic process65/2311359/187239.25e-047.84e-0365
GO:00973059CervixCCresponse to alcohol46/2311253/187234.40e-032.69e-0246
GO:0072594ColorectumADestablishment of protein localization to organelle148/3918422/187237.95e-121.04e-09148
GO:0043254ColorectumADregulation of protein-containing complex assembly148/3918428/187232.64e-113.18e-09148
GO:0031334ColorectumADpositive regulation of protein-containing complex assembly91/3918237/187234.78e-103.99e-0891
GO:0051052ColorectumADregulation of DNA metabolic process116/3918359/187232.47e-071.00e-05116
GO:0051054ColorectumADpositive regulation of DNA metabolic process73/3918201/187233.27e-071.29e-0573
GO:2001020ColorectumADregulation of response to DNA damage stimulus71/3918219/187234.38e-057.65e-0471
GO:0071241ColorectumADcellular response to inorganic substance68/3918226/187236.98e-047.10e-0368
GO:2001022ColorectumADpositive regulation of response to DNA damage stimulus36/3918105/187231.02e-039.47e-0336
Page: 1 2 3 4 5 6 7 8 9 10 11 12 13 14 15 16 17 18 19 20 

check button Enriched KEGG pathways.
Pathway IDTissueDisease StageDescriptionGene RatioBg Ratiopvaluep.adjustqvalueCount
Page: 1 

Top

Cell-cell communication analysis

check buttonIdentification of potential cell-cell interactions between two cell types and their ligand-receptor pairs for different disease states
LigandReceptorLRpairPathwayTissueDisease Stage
Page: 1 

Top

Single-cell gene regulatory network inference analysis

check buttonFind out the significant the regulons (TFs) and the target genes of each regulon across cell types for different disease states
TFCell TypeTissueDisease StageTarget GeneRSSRegulon Activity
∗The dot plots of a searched regulon are shown for all cell subpopulations in each disease state of each tissue based on the regulon specific score inferred using pySCENIC and by calculating the average expression.
Page: 1 

Top

Somatic mutation of malignant transformation related genes

check buttonAnnotation of somatic variants for genes involved in malignant transformation
Hugo SymbolVariant ClassVariant ClassificationdbSNP RSHGVScHGVSpHGVSp ShortSWISSPROTBIOTYPESIFTPolyPhenTumor Sample BarcodeTissueHistologySexAgeStageTherapy TypesDrugsOutcome
SPIDRSNVMissense_Mutationc.715N>Gp.Gln239Glup.Q239EQ14159protein_codingtolerated(0.14)benign(0.199)TCGA-5L-AAT1-01Breastbreast invasive carcinomaFemale<65III/IVHormone TherapyletrozolSD
SPIDRSNVMissense_Mutationnovelc.278N>Tp.Thr93Ilep.T93IQ14159protein_codingtolerated(0.09)benign(0.089)TCGA-A8-A06T-01Breastbreast invasive carcinomaFemale>=65III/IVHormone TherapyanastrozoleSD
SPIDRSNVMissense_Mutationnovelc.1010N>Ap.Gly337Glup.G337EQ14159protein_codingtolerated(0.46)benign(0.332)TCGA-AC-A3W7-01Breastbreast invasive carcinomaFemale>=65I/IIHormone TherapyfemaraSD
SPIDRSNVMissense_Mutationnovelc.319G>Ap.Asp107Asnp.D107NQ14159protein_codingtolerated(0.11)probably_damaging(0.996)TCGA-AN-A0AS-01Breastbreast invasive carcinomaFemale>=65III/IVUnknownUnknownSD
SPIDRSNVMissense_Mutationc.1955N>Gp.Thr652Argp.T652RQ14159protein_codingtolerated(1)benign(0)TCGA-B6-A0RE-01Breastbreast invasive carcinomaFemale<65I/IIUnknownUnknownSD
SPIDRSNVMissense_Mutationrs777561291c.2068N>Tp.Leu690Phep.L690FQ14159protein_codingtolerated(0.06)probably_damaging(0.967)TCGA-BH-A0HF-01Breastbreast invasive carcinomaFemale>=65I/IIHormone TherapyarimidexSD
SPIDRSNVMissense_Mutationrs782141616c.1045G>Ap.Ala349Thrp.A349TQ14159protein_codingdeleterious(0)probably_damaging(0.989)TCGA-BH-A18G-01Breastbreast invasive carcinomaFemale>=65I/IIUnknownUnknownSD
SPIDRSNVMissense_Mutationc.1127N>Ap.Cys376Tyrp.C376YQ14159protein_codingtolerated(0.18)benign(0.003)TCGA-C8-A12Y-01Breastbreast invasive carcinomaFemale<65I/IIUnknownUnknownSD
SPIDRSNVMissense_Mutationrs375968682c.2654N>Cp.Cys885Serp.C885SQ14159protein_codingdeleterious(0.01)probably_damaging(0.998)TCGA-E9-A1R5-01Breastbreast invasive carcinomaFemale<65I/IIHormone TherapytamoxiphenSD
SPIDRinsertionFrame_Shift_Insnovelc.2740_2741insTTp.Glu914ValfsTer61p.E914Vfs*61Q14159protein_codingTCGA-AO-A0J9-01Breastbreast invasive carcinomaFemale<65III/IVChemotherapycyclophosphamidePD
Page: 1 2 3 4 5 6 7 8 9 10 

Top

Related drugs of malignant transformation related genes

check buttonIdentification of chemicals and drugs interact with genes involved in malignant transfromation
(DGIdb 4.0)
Entrez IDSymbolCategoryInteraction TypesDrug Claim NameDrug NamePMIDs
Page: 1