
|
|||||
|
 | |
| |
| |
| |
| |
| |
|
Gene: SPICE1 |
Gene summary for SPICE1 |
| Gene information | Species | Human | Gene symbol | SPICE1 | Gene ID | 152185 |
| Gene name | spindle and centriole associated protein 1 | |
| Gene Alias | CCDC52 | |
| Cytomap | 3q13.2 | |
| Gene Type | protein-coding | GO ID | GO:0000226 | UniProtAcc | Q8N0Z3 |
Top |
Malignant transformation analysis |
| Identification of the aberrant gene expression in precancerous and cancerous lesions by comparing the gene expression of stem-like cells in diseased tissues with normal stem cells |
| Entrez ID | Symbol | Replicates | Species | Organ | Tissue | Adj P-value | Log2FC | Malignancy |
| 152185 | SPICE1 | HTA11_3410_2000001011 | Human | Colorectum | AD | 1.61e-90 | 2.30e+00 | 0.0155 |
| 152185 | SPICE1 | HTA11_2487_2000001011 | Human | Colorectum | SER | 4.43e-34 | 1.75e+00 | -0.1808 |
| 152185 | SPICE1 | HTA11_2951_2000001011 | Human | Colorectum | AD | 1.71e-26 | 2.03e+00 | 0.0216 |
| 152185 | SPICE1 | HTA11_1938_2000001011 | Human | Colorectum | AD | 1.37e-53 | 2.56e+00 | -0.0811 |
| 152185 | SPICE1 | HTA11_78_2000001011 | Human | Colorectum | AD | 8.16e-21 | 1.00e+00 | -0.1088 |
| 152185 | SPICE1 | HTA11_347_2000001011 | Human | Colorectum | AD | 2.84e-69 | 1.87e+00 | -0.1954 |
| 152185 | SPICE1 | HTA11_411_2000001011 | Human | Colorectum | SER | 1.56e-26 | 2.67e+00 | -0.2602 |
| 152185 | SPICE1 | HTA11_2112_2000001011 | Human | Colorectum | SER | 7.82e-09 | 1.75e+00 | -0.2196 |
| 152185 | SPICE1 | HTA11_3361_2000001011 | Human | Colorectum | AD | 1.07e-42 | 2.07e+00 | -0.1207 |
| 152185 | SPICE1 | HTA11_83_2000001011 | Human | Colorectum | SER | 1.04e-27 | 2.12e+00 | -0.1526 |
| 152185 | SPICE1 | HTA11_696_2000001011 | Human | Colorectum | AD | 5.16e-81 | 2.74e+00 | -0.1464 |
| 152185 | SPICE1 | HTA11_866_2000001011 | Human | Colorectum | AD | 5.94e-44 | 1.34e+00 | -0.1001 |
| 152185 | SPICE1 | HTA11_1391_2000001011 | Human | Colorectum | AD | 8.41e-32 | 1.61e+00 | -0.059 |
| 152185 | SPICE1 | HTA11_2992_2000001011 | Human | Colorectum | SER | 3.70e-38 | 3.01e+00 | -0.1706 |
| 152185 | SPICE1 | HTA11_5212_2000001011 | Human | Colorectum | AD | 7.75e-40 | 2.87e+00 | -0.2061 |
| 152185 | SPICE1 | HTA11_5216_2000001011 | Human | Colorectum | SER | 1.81e-33 | 3.36e+00 | -0.1462 |
| 152185 | SPICE1 | HTA11_546_2000001011 | Human | Colorectum | AD | 5.81e-45 | 2.91e+00 | -0.0842 |
| 152185 | SPICE1 | HTA11_10711_2000001011 | Human | Colorectum | AD | 8.02e-05 | 5.64e-01 | 0.0338 |
| 152185 | SPICE1 | HTA11_99999970781_79442 | Human | Colorectum | MSS | 1.90e-22 | 8.11e-01 | 0.294 |
| 152185 | SPICE1 | HTA11_99999965104_69814 | Human | Colorectum | MSS | 4.99e-28 | 1.33e+00 | 0.281 |
| Page: 1 2 3 4 5 |
| Tissue | Expression Dynamics | Abbreviation |
| Colorectum (GSE201348) |  | FAP: Familial adenomatous polyposis |
| CRC: Colorectal cancer | ||
| Colorectum (HTA11) |  | AD: Adenomas |
| SER: Sessile serrated lesions | ||
| MSI-H: Microsatellite-high colorectal cancer | ||
| MSS: Microsatellite stable colorectal cancer | ||
| Esophagus | 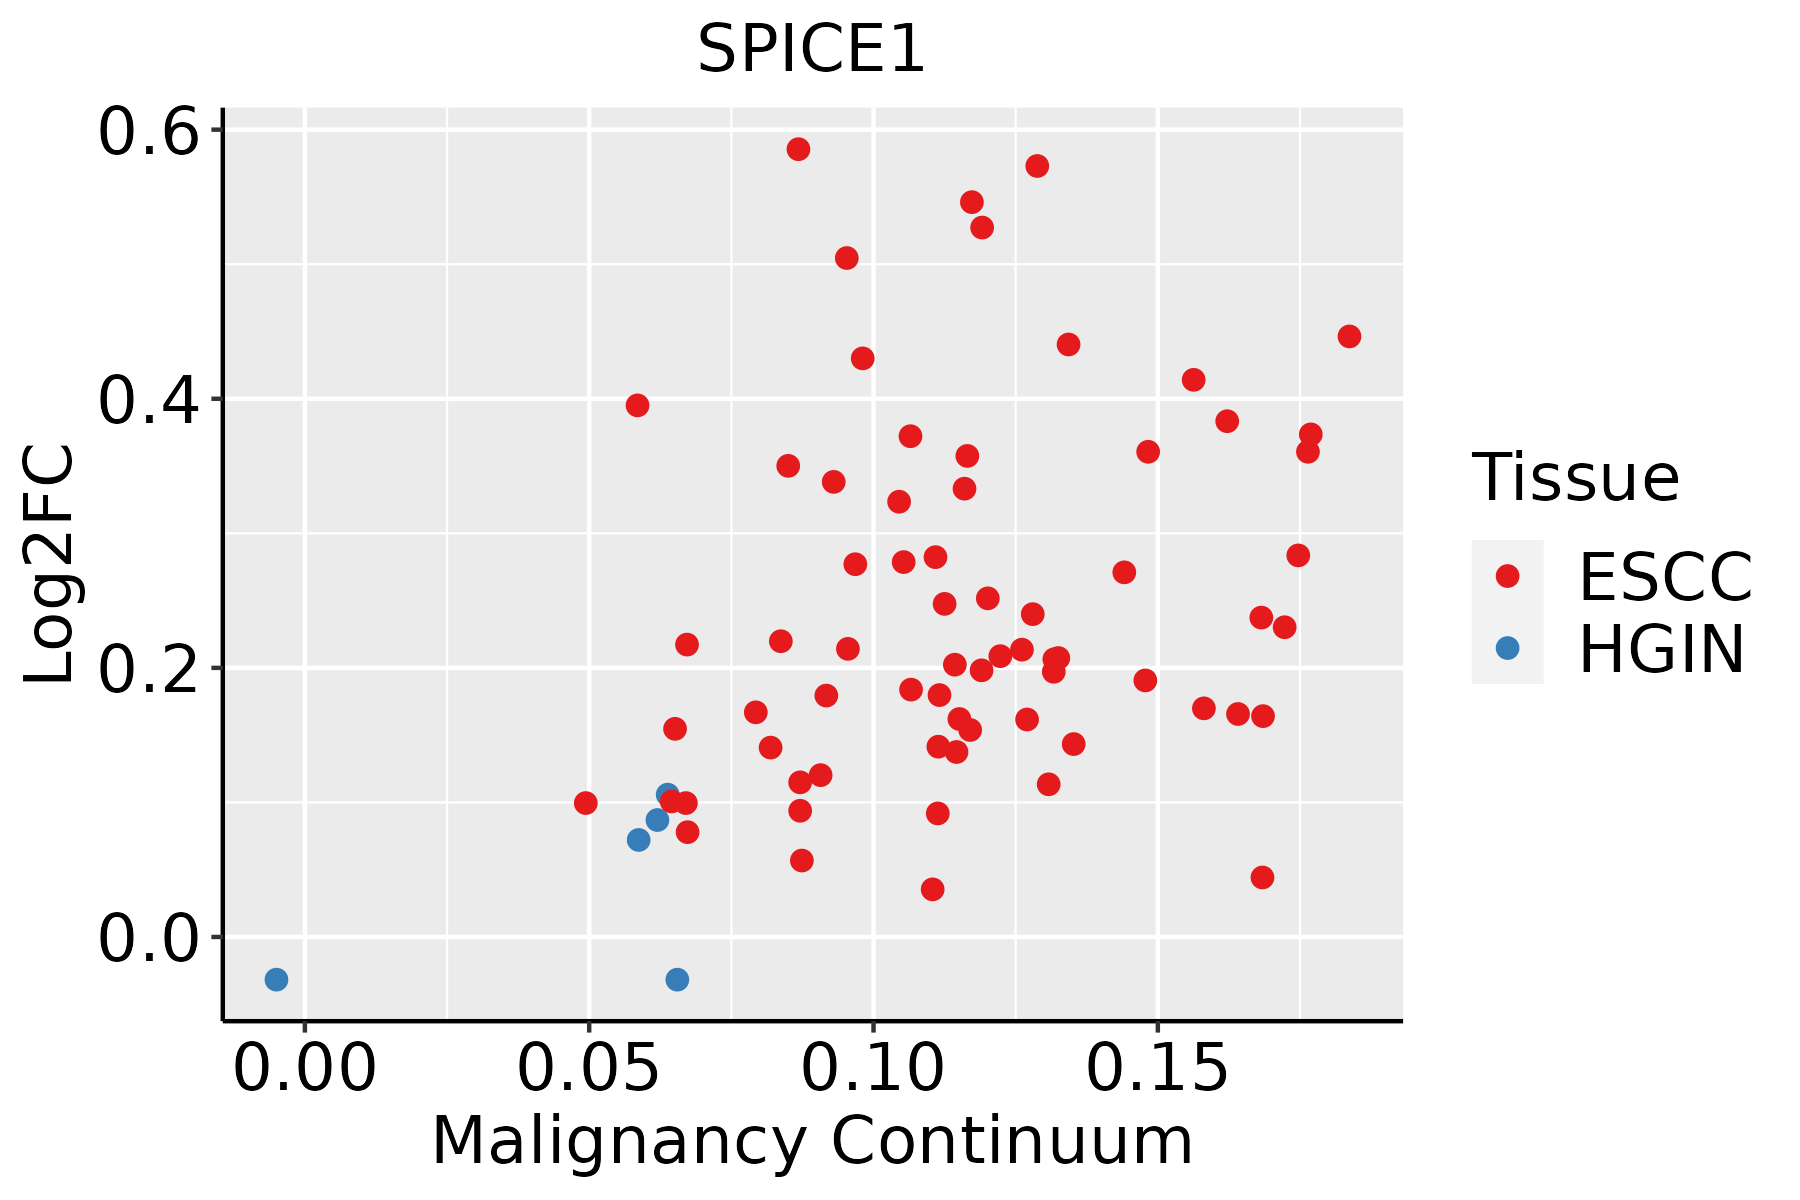 | ESCC: Esophageal squamous cell carcinoma |
| HGIN: High-grade intraepithelial neoplasias | ||
| LGIN: Low-grade intraepithelial neoplasias |
| ∗log2FC in expression of this searched gene in stem-like cells from each diseased tissue sample relative to stem-like cells in normal samples in each tissue plotted against the malignancy continuum. Samples are colored based on if they are from different disease stage. |
Top |
Malignant transformation related pathway analysis |
| Find out the enriched GO biological processes and KEGG pathways involved in transition from healthy to precancer to cancer |
| Tissue | Disease Stage | Enriched GO biological Processes |
| Colorectum | AD |  |
| Colorectum | SER |  |
| Colorectum | MSS |  |
| Colorectum | MSI-H |  |
| Colorectum | FAP |  |
| ∗Top 15 enriched GO BP terms are showed in the bar plot of each disease state in each tissue. Each row represents a significant GO biological process which is colored according to the -log10(p.adjust). |
| Page: 1 2 3 4 5 6 7 8 9 |
| GO ID | Tissue | Disease Stage | Description | Gene Ratio | Bg Ratio | pvalue | p.adjust | Count |
| GO:0051656 | Colorectum | AD | establishment of organelle localization | 131/3918 | 390/18723 | 3.00e-09 | 2.06e-07 | 131 |
| GO:0007051 | Colorectum | AD | spindle organization | 58/3918 | 184/18723 | 4.71e-04 | 5.20e-03 | 58 |
| GO:1902850 | Colorectum | AD | microtubule cytoskeleton organization involved in mitosis | 48/3918 | 147/18723 | 5.87e-04 | 6.21e-03 | 48 |
| GO:0090307 | Colorectum | AD | mitotic spindle assembly | 25/3918 | 65/18723 | 9.12e-04 | 8.71e-03 | 25 |
| GO:0007052 | Colorectum | AD | mitotic spindle organization | 40/3918 | 120/18723 | 1.03e-03 | 9.61e-03 | 40 |
| GO:0051225 | Colorectum | AD | spindle assembly | 37/3918 | 117/18723 | 4.32e-03 | 2.96e-02 | 37 |
| GO:0140014 | Colorectum | AD | mitotic nuclear division | 78/3918 | 287/18723 | 6.48e-03 | 4.05e-02 | 78 |
| GO:0046605 | Colorectum | AD | regulation of centrosome cycle | 18/3918 | 49/18723 | 7.93e-03 | 4.73e-02 | 18 |
| GO:00516561 | Colorectum | SER | establishment of organelle localization | 100/2897 | 390/18723 | 1.11e-07 | 6.79e-06 | 100 |
| GO:00466051 | Colorectum | SER | regulation of centrosome cycle | 17/2897 | 49/18723 | 7.17e-04 | 9.44e-03 | 17 |
| GO:0010824 | Colorectum | SER | regulation of centrosome duplication | 15/2897 | 45/18723 | 2.29e-03 | 2.19e-02 | 15 |
| GO:00516562 | Colorectum | MSS | establishment of organelle localization | 115/3467 | 390/18723 | 7.30e-08 | 3.67e-06 | 115 |
| GO:00070511 | Colorectum | MSS | spindle organization | 53/3467 | 184/18723 | 4.23e-04 | 5.19e-03 | 53 |
| GO:19028501 | Colorectum | MSS | microtubule cytoskeleton organization involved in mitosis | 44/3467 | 147/18723 | 5.17e-04 | 5.98e-03 | 44 |
| GO:00070521 | Colorectum | MSS | mitotic spindle organization | 36/3467 | 120/18723 | 1.52e-03 | 1.39e-02 | 36 |
| GO:00903071 | Colorectum | MSS | mitotic spindle assembly | 22/3467 | 65/18723 | 2.33e-03 | 1.90e-02 | 22 |
| GO:00512251 | Colorectum | MSS | spindle assembly | 33/3467 | 117/18723 | 6.68e-03 | 4.38e-02 | 33 |
| GO:01400141 | Colorectum | MSS | mitotic nuclear division | 70/3467 | 287/18723 | 7.48e-03 | 4.72e-02 | 70 |
| GO:00516563 | Colorectum | FAP | establishment of organelle localization | 97/2622 | 390/18723 | 5.91e-09 | 9.48e-07 | 97 |
| GO:00070512 | Colorectum | FAP | spindle organization | 41/2622 | 184/18723 | 1.50e-03 | 1.34e-02 | 41 |
| Page: 1 2 |
| Pathway ID | Tissue | Disease Stage | Description | Gene Ratio | Bg Ratio | pvalue | p.adjust | qvalue | Count |
| Page: 1 |
Top |
Cell-cell communication analysis |
| Identification of potential cell-cell interactions between two cell types and their ligand-receptor pairs for different disease states |
| Ligand | Receptor | LRpair | Pathway | Tissue | Disease Stage |
| Page: 1 |
Top |
Single-cell gene regulatory network inference analysis |
| Find out the significant the regulons (TFs) and the target genes of each regulon across cell types for different disease states |
| TF | Cell Type | Tissue | Disease Stage | Target Gene | RSS | Regulon Activity |
| ∗The dot plots of a searched regulon are shown for all cell subpopulations in each disease state of each tissue based on the regulon specific score inferred using pySCENIC and by calculating the average expression. |
| Page: 1 |
Top |
Somatic mutation of malignant transformation related genes |
| Annotation of somatic variants for genes involved in malignant transformation |
| Hugo Symbol | Variant Class | Variant Classification | dbSNP RS | HGVSc | HGVSp | HGVSp Short | SWISSPROT | BIOTYPE | SIFT | PolyPhen | Tumor Sample Barcode | Tissue | Histology | Sex | Age | Stage | Therapy Types | Drugs | Outcome |
| SPICE1 | SNV | Missense_Mutation | c.1852N>G | p.Gln618Glu | p.Q618E | Q8N0Z3 | protein_coding | tolerated(0.68) | benign(0.006) | TCGA-A2-A0SY-01 | Breast | breast invasive carcinoma | Female | <65 | III/IV | Hormone Therapy | arimidex | SD | |
| SPICE1 | SNV | Missense_Mutation | c.2285C>T | p.Pro762Leu | p.P762L | Q8N0Z3 | protein_coding | tolerated(0.05) | benign(0.003) | TCGA-A2-A0YK-01 | Breast | breast invasive carcinoma | Female | <65 | I/II | Chemotherapy | cytoxan | SD | |
| SPICE1 | SNV | Missense_Mutation | c.2241N>C | p.Gln747His | p.Q747H | Q8N0Z3 | protein_coding | deleterious(0.01) | probably_damaging(0.929) | TCGA-A8-A06X-01 | Breast | breast invasive carcinoma | Female | >=65 | I/II | Unknown | Unknown | SD | |
| SPICE1 | SNV | Missense_Mutation | novel | c.2164N>G | p.Leu722Val | p.L722V | Q8N0Z3 | protein_coding | tolerated(0.2) | benign(0.087) | TCGA-AC-A23H-01 | Breast | breast invasive carcinoma | Female | >=65 | I/II | Unknown | Unknown | PD |
| SPICE1 | SNV | Missense_Mutation | novel | c.2560N>A | p.Val854Ile | p.V854I | Q8N0Z3 | protein_coding | tolerated(0.67) | benign(0.009) | TCGA-AR-A2LR-01 | Breast | breast invasive carcinoma | Female | <65 | I/II | Chemotherapy | adriamycin | SD |
| SPICE1 | SNV | Missense_Mutation | novel | c.725N>G | p.Ser242Cys | p.S242C | Q8N0Z3 | protein_coding | tolerated(0.14) | benign(0.007) | TCGA-BH-A0B6-01 | Breast | breast invasive carcinoma | Female | <65 | I/II | Unknown | Unknown | SD |
| SPICE1 | SNV | Missense_Mutation | novel | c.616C>T | p.Leu206Phe | p.L206F | Q8N0Z3 | protein_coding | deleterious(0) | probably_damaging(0.998) | TCGA-D8-A146-01 | Breast | breast invasive carcinoma | Female | <65 | I/II | Unknown | Unknown | SD |
| SPICE1 | SNV | Missense_Mutation | c.2197N>A | p.Glu733Lys | p.E733K | Q8N0Z3 | protein_coding | deleterious(0) | probably_damaging(0.996) | TCGA-D8-A27G-01 | Breast | breast invasive carcinoma | Female | >=65 | I/II | Unknown | Unknown | SD | |
| SPICE1 | insertion | Frame_Shift_Ins | novel | c.775_776insGTAAGGACATTAGGTTAGTAGAGTCTTCTTTTCAGGCAGAA | p.Val259GlyfsTer31 | p.V259Gfs*31 | Q8N0Z3 | protein_coding | TCGA-A8-A09D-01 | Breast | breast invasive carcinoma | Female | <65 | I/II | Chemotherapy | doxorubicin | CR | ||
| SPICE1 | SNV | Missense_Mutation | novel | c.872A>T | p.Lys291Ile | p.K291I | Q8N0Z3 | protein_coding | deleterious(0.04) | probably_damaging(0.987) | TCGA-2W-A8YY-01 | Cervix | cervical & endocervical cancer | Female | <65 | I/II | Chemotherapy | cisplatin | CR |
| Page: 1 2 3 4 5 6 7 8 9 10 |
Top |
Related drugs of malignant transformation related genes |
| Identification of chemicals and drugs interact with genes involved in malignant transfromation |
| (DGIdb 4.0) |
| Entrez ID | Symbol | Category | Interaction Types | Drug Claim Name | Drug Name | PMIDs |
| Page: 1 |

Copyright 2023-Present -The University of Texas Health Science Center at Houston |