
|
|||||
|
 | |
| |
| |
| |
| |
| |
|
Gene: SPIB |
Gene summary for SPIB |
| Gene information | Species | Human | Gene symbol | SPIB | Gene ID | 6689 |
| Gene name | Spi-B transcription factor | |
| Gene Alias | SPI-B | |
| Cytomap | 19q13.33 | |
| Gene Type | protein-coding | GO ID | GO:0006139 | UniProtAcc | Q01892 |
Top |
Malignant transformation analysis |
| Identification of the aberrant gene expression in precancerous and cancerous lesions by comparing the gene expression of stem-like cells in diseased tissues with normal stem cells |
| Entrez ID | Symbol | Replicates | Species | Organ | Tissue | Adj P-value | Log2FC | Malignancy |
| 6689 | SPIB | HCC1_Meng | Human | Liver | HCC | 1.78e-06 | 2.91e-03 | 0.0246 |
| 6689 | SPIB | HCC1 | Human | Liver | HCC | 1.01e-13 | 1.65e+00 | 0.5336 |
| 6689 | SPIB | HCC2 | Human | Liver | HCC | 2.24e-32 | 2.67e+00 | 0.5341 |
| 6689 | SPIB | HCC5 | Human | Liver | HCC | 7.28e-18 | 1.47e+00 | 0.4932 |
| Page: 1 |
| Tissue | Expression Dynamics | Abbreviation |
| Liver | 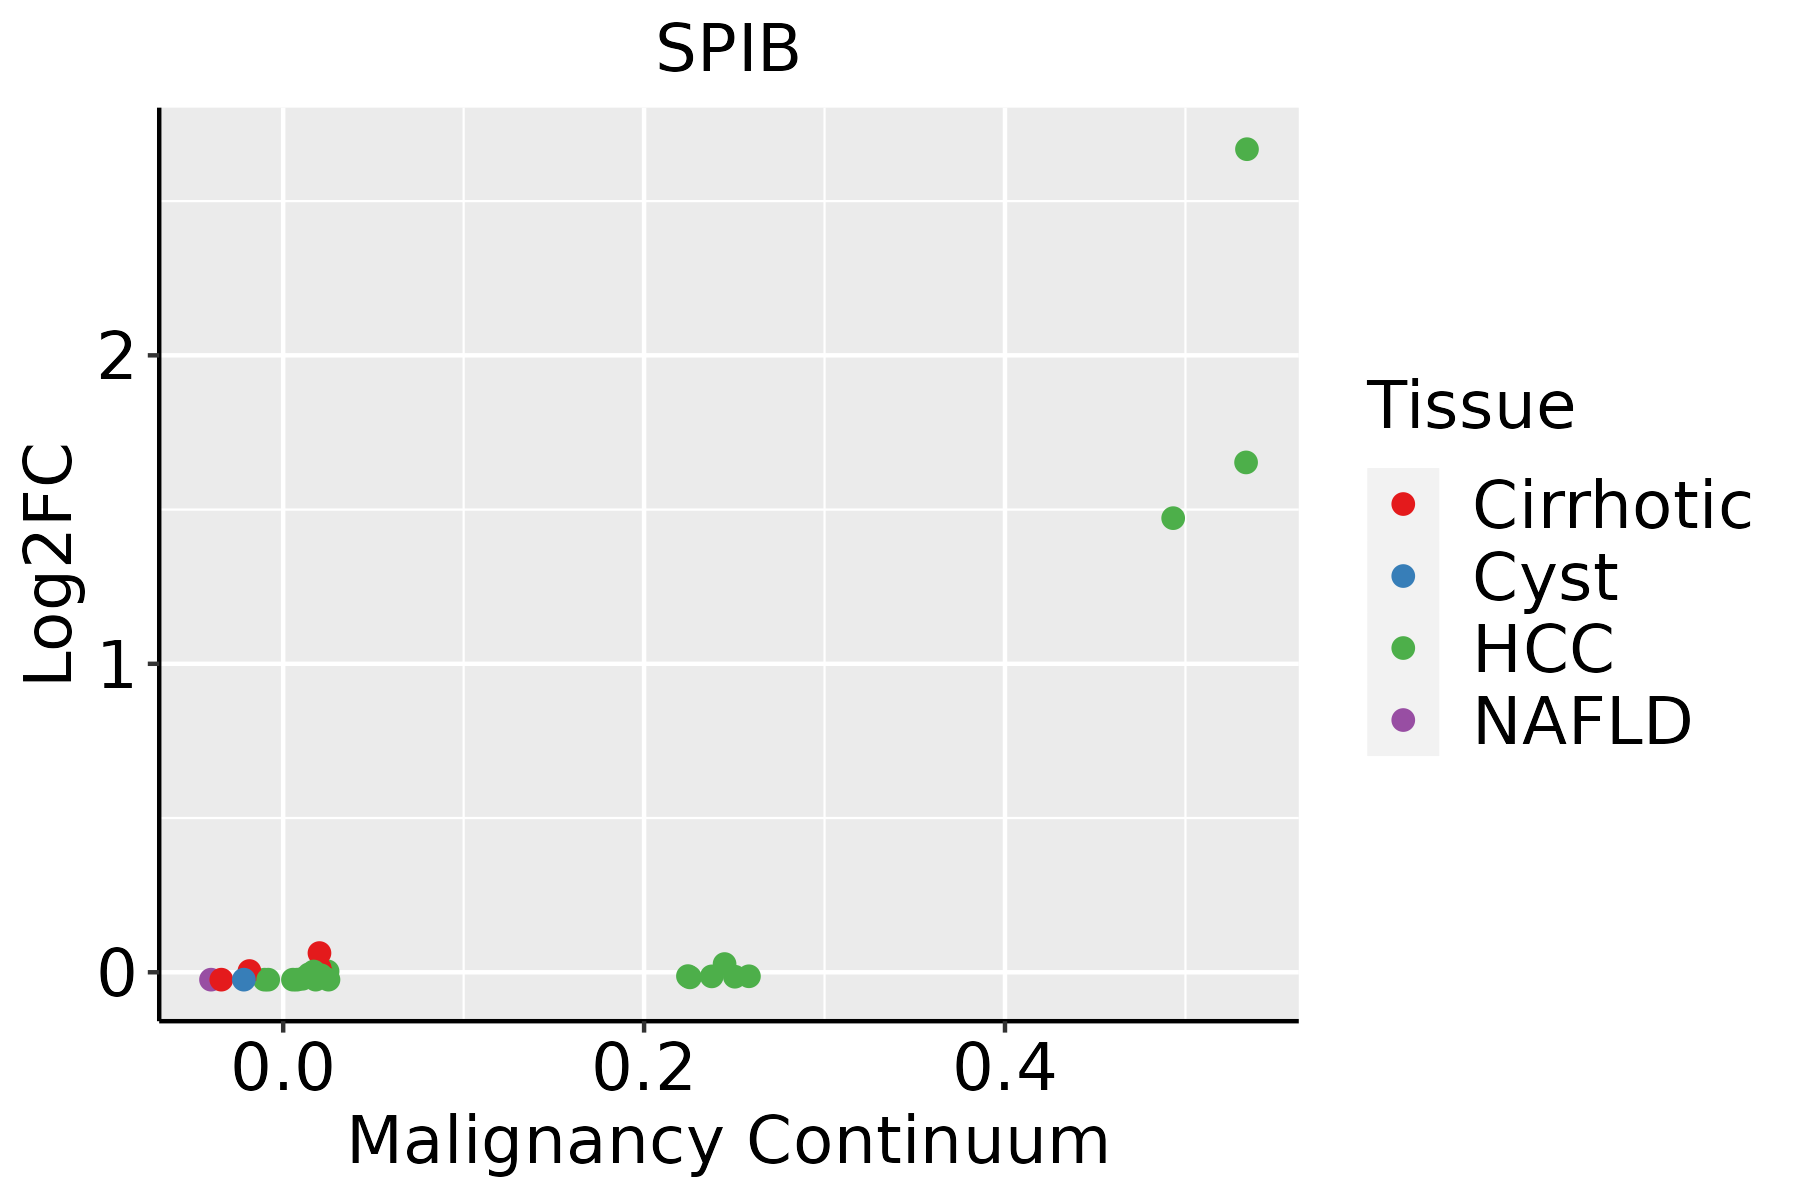 | HCC: Hepatocellular carcinoma |
| NAFLD: Non-alcoholic fatty liver disease |
| ∗log2FC in expression of this searched gene in stem-like cells from each diseased tissue sample relative to stem-like cells in normal samples in each tissue plotted against the malignancy continuum. Samples are colored based on if they are from different disease stage. |
Top |
Malignant transformation related pathway analysis |
| Find out the enriched GO biological processes and KEGG pathways involved in transition from healthy to precancer to cancer |
| Tissue | Disease Stage | Enriched GO biological Processes |
| Colorectum | AD |  |
| Colorectum | SER |  |
| Colorectum | MSS |  |
| Colorectum | MSI-H |  |
| Colorectum | FAP |  |
| ∗Top 15 enriched GO BP terms are showed in the bar plot of each disease state in each tissue. Each row represents a significant GO biological process which is colored according to the -log10(p.adjust). |
| Page: 1 2 3 4 5 6 7 8 9 |
| GO ID | Tissue | Disease Stage | Description | Gene Ratio | Bg Ratio | pvalue | p.adjust | Count |
| Page: 1 |
| Pathway ID | Tissue | Disease Stage | Description | Gene Ratio | Bg Ratio | pvalue | p.adjust | qvalue | Count |
| Page: 1 |
Top |
Cell-cell communication analysis |
| Identification of potential cell-cell interactions between two cell types and their ligand-receptor pairs for different disease states |
| Ligand | Receptor | LRpair | Pathway | Tissue | Disease Stage |
| Page: 1 |
Top |
Single-cell gene regulatory network inference analysis |
| Find out the significant the regulons (TFs) and the target genes of each regulon across cell types for different disease states |
| TF | Cell Type | Tissue | Disease Stage | Target Gene | RSS | Regulon Activity |
| SPIB | CT | Colorectum | Healthy | MEIS1,NBPF19,NOTCH2, etc. | 4.12e-01 |  |
| SPIB | BMEM | Colorectum | ADJ | TNFRSF13C,SEMA7A,NR1H2, etc. | 2.86e-01 |  |
| SPIB | STM | Liver | Healthy | AP006621.5,BLOC1S3,PPP1R14A, etc. | 6.44e-01 |  |
| SPIB | BN | Thyroid | goiters | SEMA7A,IRF7,BANK1, etc. | 5.02e-01 |  |
| ∗The dot plots of a searched regulon are shown for all cell subpopulations in each disease state of each tissue based on the regulon specific score inferred using pySCENIC and by calculating the average expression. |
| Page: 1 |
Top |
Somatic mutation of malignant transformation related genes |
| Annotation of somatic variants for genes involved in malignant transformation |
| Hugo Symbol | Variant Class | Variant Classification | dbSNP RS | HGVSc | HGVSp | HGVSp Short | SWISSPROT | BIOTYPE | SIFT | PolyPhen | Tumor Sample Barcode | Tissue | Histology | Sex | Age | Stage | Therapy Types | Drugs | Outcome |
| SPIB | SNV | Missense_Mutation | novel | c.506N>G | p.Leu169Arg | p.L169R | Q01892 | protein_coding | deleterious(0) | possibly_damaging(0.827) | TCGA-EW-A2FR-01 | Breast | breast invasive carcinoma | Female | <65 | III/IV | Chemotherapy | epirubicin | SD |
| SPIB | SNV | Missense_Mutation | rs758882487 | c.235N>A | p.Glu79Lys | p.E79K | Q01892 | protein_coding | tolerated(0.91) | benign(0.007) | TCGA-2W-A8YY-01 | Cervix | cervical & endocervical cancer | Female | <65 | I/II | Chemotherapy | cisplatin | CR |
| SPIB | SNV | Missense_Mutation | novel | c.469N>A | p.Glu157Lys | p.E157K | Q01892 | protein_coding | tolerated(0.32) | possibly_damaging(0.905) | TCGA-C5-A902-01 | Cervix | cervical & endocervical cancer | Female | <65 | I/II | Chemotherapy | cisplatin | SD |
| SPIB | SNV | Missense_Mutation | c.259N>T | p.Gly87Trp | p.G87W | Q01892 | protein_coding | tolerated(0.17) | probably_damaging(1) | TCGA-A6-5665-01 | Colorectum | colon adenocarcinoma | Female | >=65 | I/II | Unknown | Unknown | PD | |
| SPIB | SNV | Missense_Mutation | rs758882487 | c.235N>A | p.Glu79Lys | p.E79K | Q01892 | protein_coding | tolerated(0.91) | benign(0.007) | TCGA-AA-3510-01 | Colorectum | colon adenocarcinoma | Male | >=65 | I/II | Unknown | Unknown | SD |
| SPIB | SNV | Missense_Mutation | rs563144649 | c.662G>A | p.Arg221His | p.R221H | Q01892 | protein_coding | deleterious(0.01) | probably_damaging(0.947) | TCGA-AA-3864-01 | Colorectum | colon adenocarcinoma | Male | >=65 | I/II | Unknown | Unknown | SD |
| SPIB | SNV | Missense_Mutation | c.656G>T | p.Arg219Leu | p.R219L | Q01892 | protein_coding | deleterious(0) | probably_damaging(0.998) | TCGA-AD-6895-01 | Colorectum | colon adenocarcinoma | Male | >=65 | III/IV | Unknown | Unknown | SD | |
| SPIB | SNV | Missense_Mutation | rs769582985 | c.184N>A | p.Asp62Asn | p.D62N | Q01892 | protein_coding | tolerated(0.25) | benign(0.001) | TCGA-EI-6917-01 | Colorectum | rectum adenocarcinoma | Male | <65 | III/IV | Chemotherapy | 5fluorouracil+oxaciplatina+l-folinian | SD |
| SPIB | deletion | Frame_Shift_Del | c.210delN | p.Gln72ArgfsTer108 | p.Q72Rfs*108 | Q01892 | protein_coding | TCGA-AU-6004-01 | Colorectum | colon adenocarcinoma | Female | >=65 | I/II | Unknown | Unknown | SD | |||
| SPIB | SNV | Missense_Mutation | novel | c.626N>T | p.Ala209Val | p.A209V | Q01892 | protein_coding | deleterious(0) | probably_damaging(0.998) | TCGA-AP-A1DV-01 | Endometrium | uterine corpus endometrioid carcinoma | Female | <65 | I/II | Unknown | Unknown | SD |
| Page: 1 2 3 4 |
Top |
Related drugs of malignant transformation related genes |
| Identification of chemicals and drugs interact with genes involved in malignant transfromation |
| (DGIdb 4.0) |
| Entrez ID | Symbol | Category | Interaction Types | Drug Claim Name | Drug Name | PMIDs |
| Page: 1 |

Copyright 2023-Present -The University of Texas Health Science Center at Houston |