Schematic overview of the cellular and molecular mechanisms involved in the cancer progression, including the proposed cellular and molecular mechanisms in cancer cells trajectory. AT1: alveolar type 1 cells; AT2: alveolar type 2 cells; AAH: atypical adenomatous hyperplasia; AIS: adenocarcinoma in situ; MIA: minimally invasive adenocarcinoma; IA: invasive adenocarcinoma; EMT: epithelial-mesenchymal transition

Home

Download

Statistics

Help

Contact

Center for Computational Systems Medicine
leaf

Gene summary

leaf

Malignant transformation analysis

leaf

Malignant transformation related pathway analysis

leaf

Cell-cell communication analysis

leaf

Single-cell gene regulatory network inference analysis

leaf

Somatic mutation of malignant transformation related genes

leaf

Related drugs of malignant transformation related genes

Gene: SPG7

Gene summary for SPG7

check button Gene summary.

Gene informationSpeciesHuman
Gene symbol

SPG7

Gene ID

6687

Gene nameSPG7 matrix AAA peptidase subunit, paraplegin
Gene AliasCAR
Cytomap16q24.3
Gene Typeprotein-coding
GO ID

GO:0006508

UniProtAcc

Q9UQ90


Top

Malignant transformation analysis

check button Identification of the aberrant gene expression in precancerous and cancerous lesions by comparing the gene expression of stem-like cells in diseased tissues with normal stem cells
check button Malignant transformation involving gene list.
Entrez IDSymbolReplicatesSpeciesOrganTissueAdj P-valueLog2FCMalignancy
6687SPG7LZE2DHumanEsophagusHGIN3.25e-043.13e-010.0642
6687SPG7LZE2THumanEsophagusESCC5.74e-146.72e-010.082
6687SPG7LZE4THumanEsophagusESCC2.89e-144.17e-010.0811
6687SPG7LZE5THumanEsophagusESCC2.28e-074.73e-010.0514
6687SPG7LZE7THumanEsophagusESCC4.95e-138.03e-010.0667
6687SPG7LZE8THumanEsophagusESCC2.15e-123.11e-010.067
6687SPG7LZE20THumanEsophagusESCC1.39e-105.36e-010.0662
6687SPG7LZE21D1HumanEsophagusHGIN2.70e-065.60e-010.0632
6687SPG7LZE22D1HumanEsophagusHGIN1.16e-052.26e-010.0595
6687SPG7LZE22THumanEsophagusESCC9.39e-103.50e-010.068
6687SPG7LZE24THumanEsophagusESCC7.60e-215.89e-010.0596
6687SPG7LZE21THumanEsophagusESCC1.08e-056.60e-010.0655
6687SPG7P1T-EHumanEsophagusESCC2.94e-271.13e+000.0875
6687SPG7P2T-EHumanEsophagusESCC4.69e-396.42e-010.1177
6687SPG7P4T-EHumanEsophagusESCC7.11e-285.98e-010.1323
6687SPG7P5T-EHumanEsophagusESCC1.84e-203.62e-010.1327
6687SPG7P8T-EHumanEsophagusESCC3.48e-498.01e-010.0889
6687SPG7P9T-EHumanEsophagusESCC2.61e-193.97e-010.1131
6687SPG7P10T-EHumanEsophagusESCC1.12e-356.01e-010.116
6687SPG7P11T-EHumanEsophagusESCC4.22e-198.09e-010.1426
Page: 1 2 3 4 5 6 7 

check button Transcriptomic changes along malignancy continuum.
TissueExpression DynamicsAbbreviation
EsophagusThe image shows the transcriptomic changes along malignancy continuum.log2FC in expression of this searched gene in stem-like cells from each diseased tissue sample relative to stem-like cells in normal samples in each tissue plotted against the malignancy continuum. Samples are colored based on if they are from different disease stage.ESCC: Esophageal squamous cell carcinoma
HGIN: High-grade intraepithelial neoplasias
LGIN: Low-grade intraepithelial neoplasias
LiverThe image shows the transcriptomic changes along malignancy continuum.log2FC in expression of this searched gene in stem-like cells from each diseased tissue sample relative to stem-like cells in normal samples in each tissue plotted against the malignancy continuum. Samples are colored based on if they are from different disease stage.
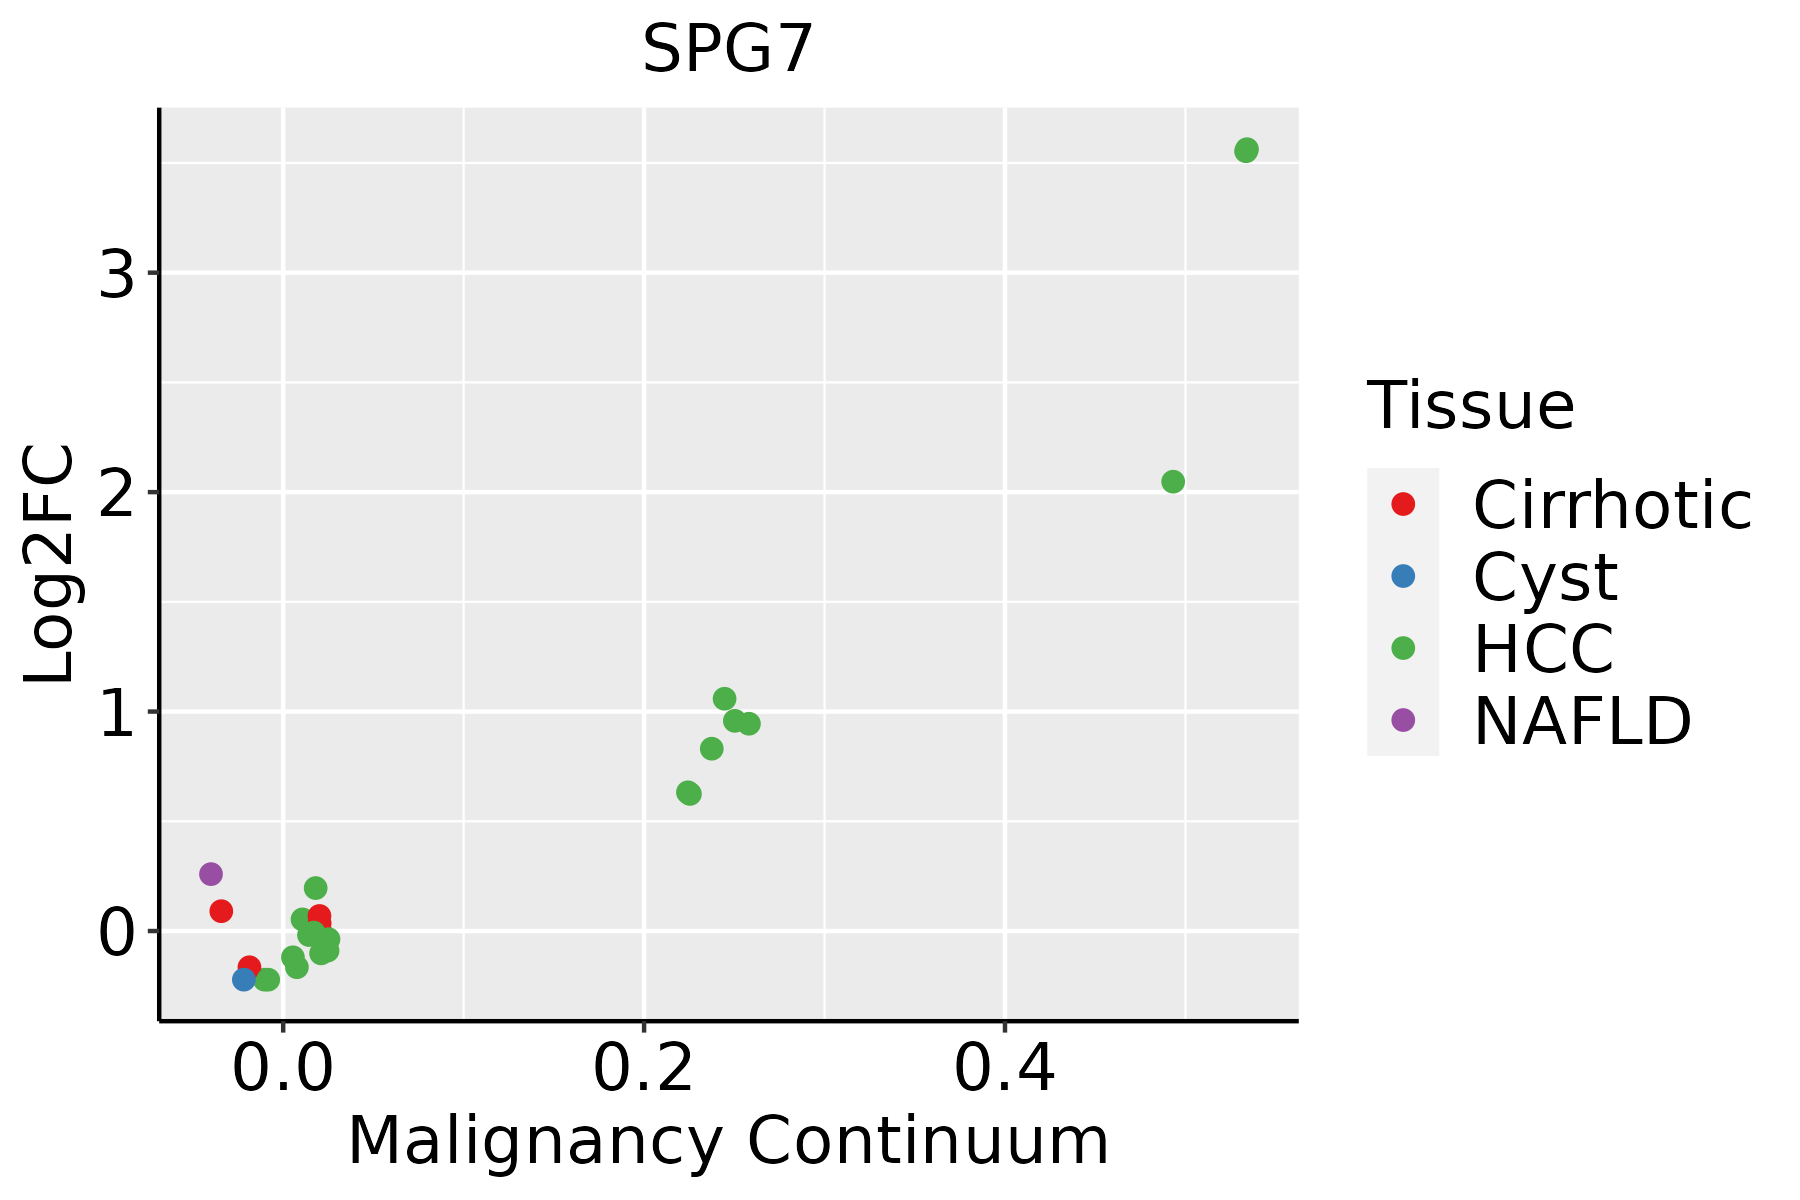
HCC: Hepatocellular carcinoma
NAFLD: Non-alcoholic fatty liver disease
LungThe image shows the transcriptomic changes along malignancy continuum.log2FC in expression of this searched gene in stem-like cells from each diseased tissue sample relative to stem-like cells in normal samples in each tissue plotted against the malignancy continuum. Samples are colored based on if they are from different disease stage.
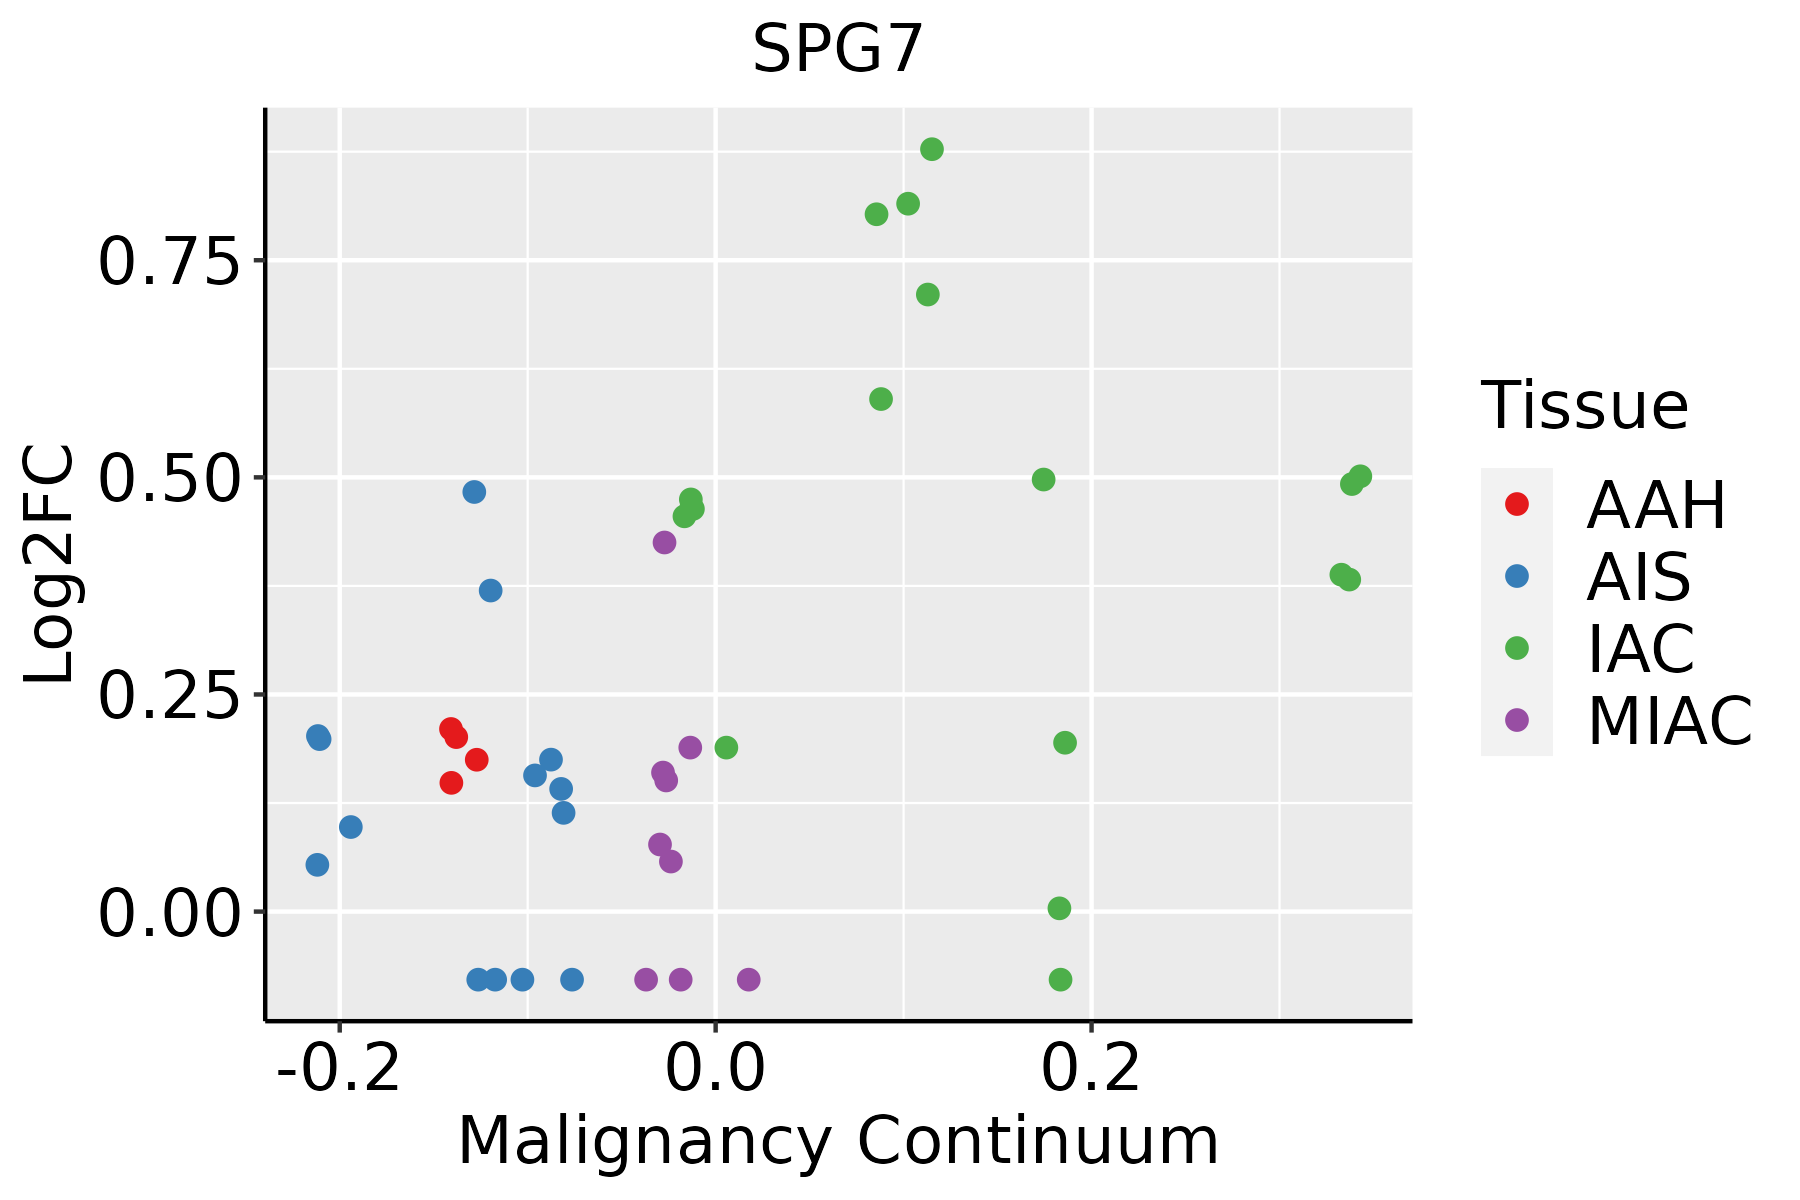
AAH: Atypical adenomatous hyperplasia
AIS: Adenocarcinoma in situ
IAC: Invasive lung adenocarcinoma
MIA: Minimally invasive adenocarcinoma
Oral CavityThe image shows the transcriptomic changes along malignancy continuum.log2FC in expression of this searched gene in stem-like cells from each diseased tissue sample relative to stem-like cells in normal samples in each tissue plotted against the malignancy continuum. Samples are colored based on if they are from different disease stage.EOLP: Erosive Oral lichen planus
LP: leukoplakia
NEOLP: Non-erosive oral lichen planus
OSCC: Oral squamous cell carcinoma
SkinThe image shows the transcriptomic changes along malignancy continuum.log2FC in expression of this searched gene in stem-like cells from each diseased tissue sample relative to stem-like cells in normal samples in each tissue plotted against the malignancy continuum. Samples are colored based on if they are from different disease stage.AK: Actinic keratosis
cSCC: Cutaneous squamous cell carcinoma
SCCIS:squamous cell carcinoma in situ
ThyroidThe image shows the transcriptomic changes along malignancy continuum.log2FC in expression of this searched gene in stem-like cells from each diseased tissue sample relative to stem-like cells in normal samples in each tissue plotted against the malignancy continuum. Samples are colored based on if they are from different disease stage.
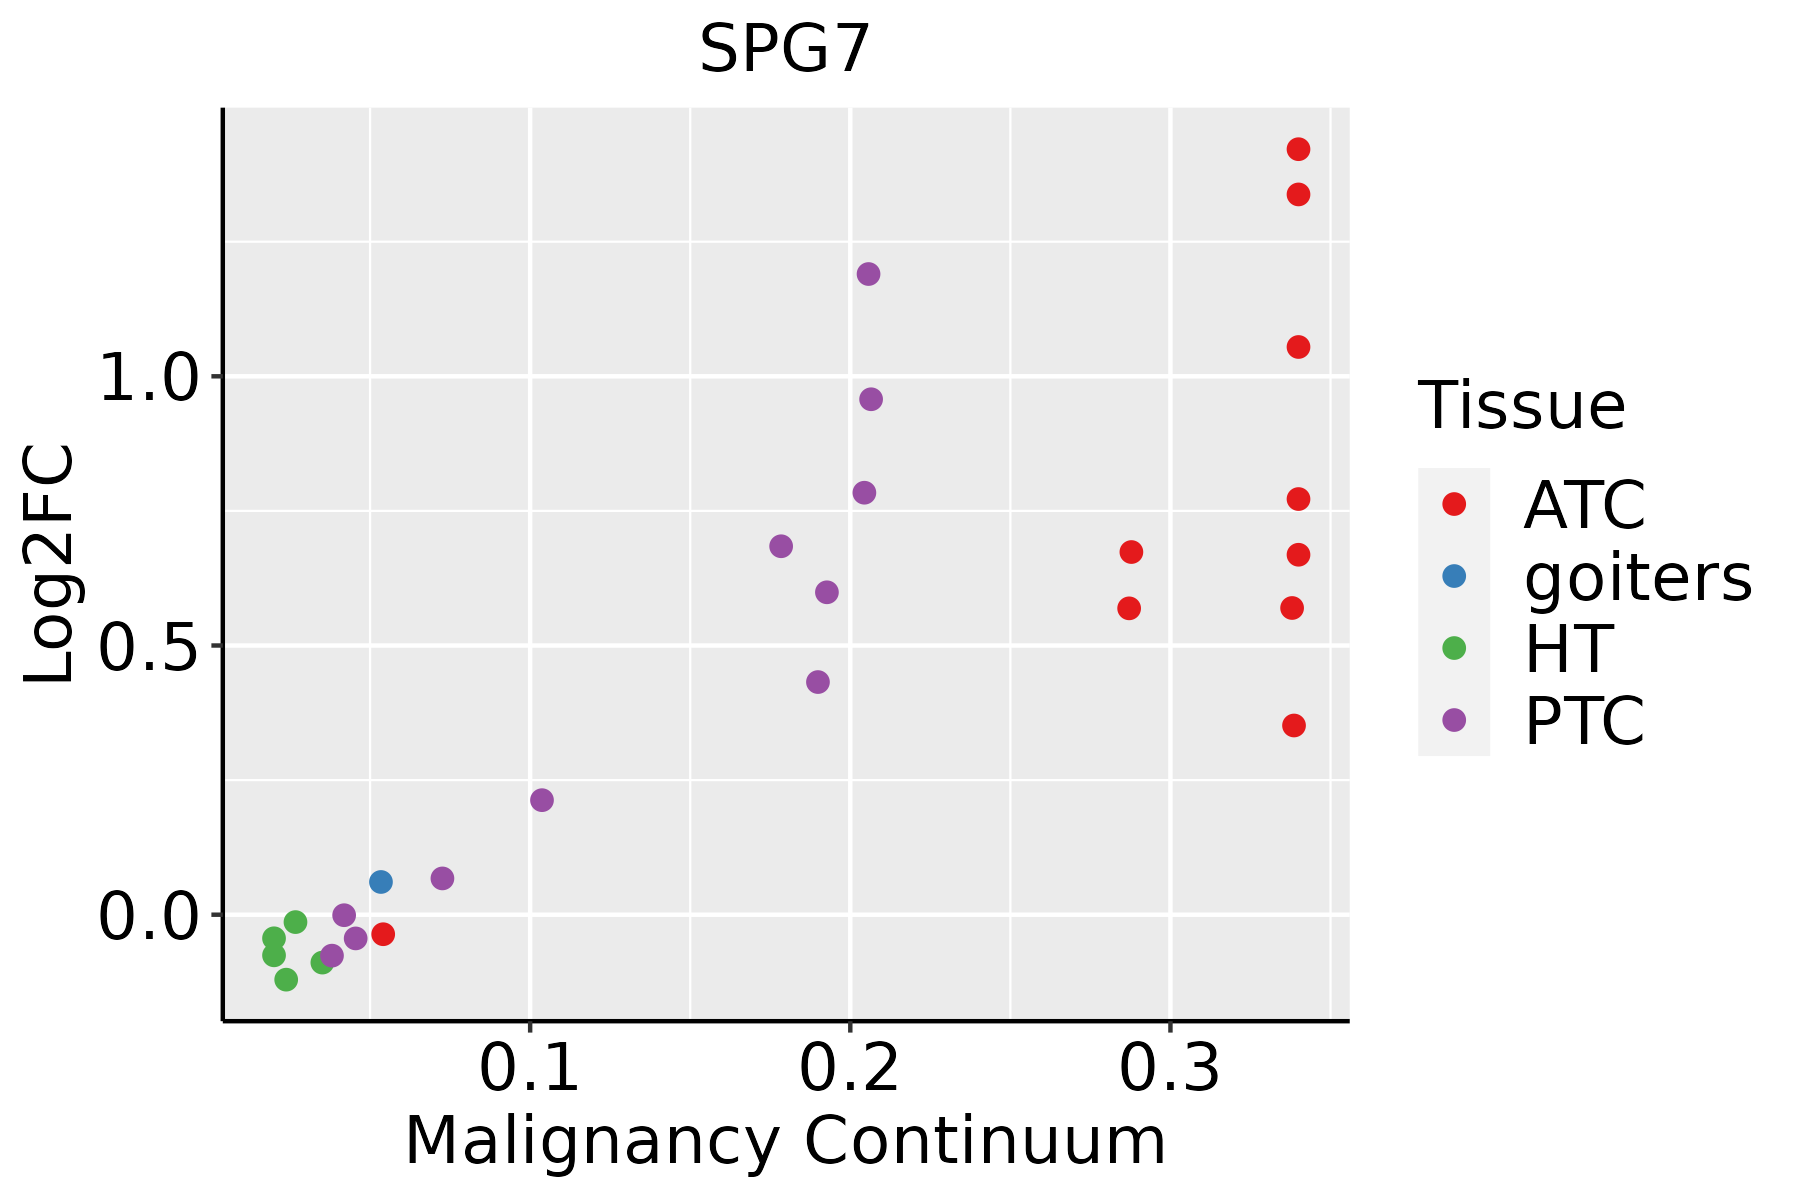
ATC: Anaplastic thyroid cancer
HT: Hashimoto's thyroiditis
PTC: Papillary thyroid cancer
∗log2FC in expression of this searched gene in stem-like cells from each diseased tissue sample relative to stem-like cells in normal samples in each tissue plotted against the malignancy continuum. Samples are colored based on if they are from different disease stage.

Top

Malignant transformation related pathway analysis

check buttonFind out the enriched GO biological processes and KEGG pathways involved in transition from healthy to precancer to cancer
check button Figure of enriched GO biological processes.
TissueDisease StageEnriched GO biological Processes
ColorectumADGO analysis - Figure of enriched GO biological processes: Top 15 enriched GO BP terms are showed in the bar plot of each disease state in each tissue. Each row represents a significant GO biological process which is colored according to the -log10(p.adjust).
ColorectumSERGO analysis - Figure of enriched GO biological processes: Top 15 enriched GO BP terms are showed in the bar plot of each disease state in each tissue. Each row represents a significant GO biological process which is colored according to the -log10(p.adjust).
ColorectumMSSGO analysis - Figure of enriched GO biological processes: Top 15 enriched GO BP terms are showed in the bar plot of each disease state in each tissue. Each row represents a significant GO biological process which is colored according to the -log10(p.adjust).
ColorectumMSI-HGO analysis - Figure of enriched GO biological processes: Top 15 enriched GO BP terms are showed in the bar plot of each disease state in each tissue. Each row represents a significant GO biological process which is colored according to the -log10(p.adjust).
ColorectumFAPGO analysis - Figure of enriched GO biological processes: Top 15 enriched GO BP terms are showed in the bar plot of each disease state in each tissue. Each row represents a significant GO biological process which is colored according to the -log10(p.adjust).
∗Top 15 enriched GO BP terms are showed in the bar plot of each disease state in each tissue. Each row represents a significant GO biological process which is colored according to the -log10(p.adjust).
Page: 1 2 3 4 5 6 7 8 9 

check button Enriched GO biological processes.
GO IDTissueDisease StageDescriptionGene RatioBg Ratiopvaluep.adjustCount
GO:000683920EsophagusHGINmitochondrial transport74/2587254/187231.32e-101.32e-0874
GO:000700618EsophagusHGINmitochondrial membrane organization37/2587116/187234.61e-072.07e-0537
GO:005160417EsophagusHGINprotein maturation68/2587294/187239.77e-062.86e-0468
GO:003070517EsophagusHGINcytoskeleton-dependent intracellular transport45/2587195/187233.07e-045.15e-0345
GO:00164857EsophagusHGINprotein processing49/2587225/187237.04e-049.52e-0349
GO:00109707EsophagusHGINtransport along microtubule35/2587155/187232.01e-032.12e-0235
GO:00469029EsophagusHGINregulation of mitochondrial membrane permeability17/258763/187234.29e-033.82e-0217
GO:19026869EsophagusHGINmitochondrial outer membrane permeabilization involved in programmed cell death12/258740/187236.22e-034.95e-0212
GO:0006839110EsophagusESCCmitochondrial transport187/8552254/187238.35e-209.81e-18187
GO:000700619EsophagusESCCmitochondrial membrane organization93/8552116/187232.16e-141.11e-1293
GO:005160418EsophagusESCCprotein maturation189/8552294/187237.64e-112.39e-09189
GO:003070518EsophagusESCCcytoskeleton-dependent intracellular transport133/8552195/187231.48e-104.27e-09133
GO:001097013EsophagusESCCtransport along microtubule107/8552155/187233.17e-096.80e-08107
GO:000808810EsophagusESCCaxo-dendritic transport58/855275/187232.09e-084.02e-0758
GO:004690217EsophagusESCCregulation of mitochondrial membrane permeability49/855263/187231.91e-072.97e-0649
GO:00905599EsophagusESCCregulation of membrane permeability58/855278/187232.38e-073.61e-0658
GO:00357948EsophagusESCCpositive regulation of mitochondrial membrane permeability36/855243/187232.90e-074.20e-0636
GO:00989304EsophagusESCCaxonal transport49/855264/187234.54e-076.15e-0649
GO:190268614EsophagusESCCmitochondrial outer membrane permeabilization involved in programmed cell death33/855240/187231.80e-062.11e-0533
GO:19057108EsophagusESCCpositive regulation of membrane permeability37/855248/187238.99e-068.65e-0537
Page: 1 2 3 4 5 6 7 

check button Enriched KEGG pathways.
Pathway IDTissueDisease StageDescriptionGene RatioBg Ratiopvaluep.adjustqvalueCount
Page: 1 

Top

Cell-cell communication analysis

check buttonIdentification of potential cell-cell interactions between two cell types and their ligand-receptor pairs for different disease states
LigandReceptorLRpairPathwayTissueDisease Stage
Page: 1 

Top

Single-cell gene regulatory network inference analysis

check buttonFind out the significant the regulons (TFs) and the target genes of each regulon across cell types for different disease states
TFCell TypeTissueDisease StageTarget GeneRSSRegulon Activity
∗The dot plots of a searched regulon are shown for all cell subpopulations in each disease state of each tissue based on the regulon specific score inferred using pySCENIC and by calculating the average expression.
Page: 1 

Top

Somatic mutation of malignant transformation related genes

check buttonAnnotation of somatic variants for genes involved in malignant transformation
Hugo SymbolVariant ClassVariant ClassificationdbSNP RSHGVScHGVSpHGVSp ShortSWISSPROTBIOTYPESIFTPolyPhenTumor Sample BarcodeTissueHistologySexAgeStageTherapy TypesDrugsOutcome
SPG7SNVMissense_Mutationnovelc.367N>Ap.Glu123Lysp.E123KQ9UQ90protein_codingtolerated(0.33)benign(0.024)TCGA-AC-A6IW-01Breastbreast invasive carcinomaFemale>=65I/IIUnknownUnknownSD
SPG7SNVMissense_Mutationnovelc.2233N>Ap.Ala745Thrp.A745TQ9UQ90protein_codingtolerated(0.29)possibly_damaging(0.491)TCGA-AN-A0AK-01Breastbreast invasive carcinomaFemale>=65I/IIUnknownUnknownSD
SPG7SNVMissense_Mutationnovelc.1553N>Tp.Gly518Valp.G518VQ9UQ90protein_codingdeleterious(0)probably_damaging(1)TCGA-BH-A0B6-01Breastbreast invasive carcinomaFemale<65I/IIUnknownUnknownSD
SPG7SNVMissense_Mutationnovelc.877N>Ap.Ala293Thrp.A293TQ9UQ90protein_codingdeleterious(0.01)possibly_damaging(0.677)TCGA-BH-A0HF-01Breastbreast invasive carcinomaFemale>=65I/IIHormone TherapyarimidexSD
SPG7insertionNonsense_Mutationnovelc.359_360insCTAp.Ala120_Pro121insTerp.A120_P121ins*Q9UQ90protein_codingTCGA-A8-A08H-01Breastbreast invasive carcinomaFemale>=65I/IIUnknownUnknownSD
SPG7insertionFrame_Shift_Insnovelc.360_361insAACTp.Pro121AsnfsTer3p.P121Nfs*3Q9UQ90protein_codingTCGA-A8-A08H-01Breastbreast invasive carcinomaFemale>=65I/IIUnknownUnknownSD
SPG7insertionIn_Frame_Insnovelc.698_699insCCTGCTCCTCACTGAAGTGACCTCAGCGAATGAAGTGTGp.Leu233_Asn234insLeuLeuLeuThrGluValThrSerAlaAsnGluValTrpp.L233_N234insLLLTEVTSANEVWQ9UQ90protein_codingTCGA-AO-A0JB-01Breastbreast invasive carcinomaFemale<65III/IVChemotherapycyclophosphamideSD
SPG7insertionFrame_Shift_Insnovelc.1431_1432insCCCTCAGCCTCCTCAGAGCGTTCAAGGTCCTGTCCTAAGAACATGGp.Asp478ProfsTer28p.D478Pfs*28Q9UQ90protein_codingTCGA-BH-A0B4-01Breastbreast invasive carcinomaMale>=65III/IVHormone TherapytamoxiphenSD
SPG7insertionFrame_Shift_Insrs760818649c.1053dupCp.Gly352ArgfsTer44p.G352Rfs*44Q9UQ90protein_codingTCGA-BH-A18G-01Breastbreast invasive carcinomaFemale>=65I/IIUnknownUnknownSD
SPG7SNVMissense_Mutationnovelc.953N>Gp.Lys318Argp.K318RQ9UQ90protein_codingdeleterious(0)probably_damaging(0.999)TCGA-C5-A2M2-01Cervixcervical & endocervical cancerFemale<65I/IIUnknownUnknownSD
Page: 1 2 3 4 5 6 7 8 9 10 

Top

Related drugs of malignant transformation related genes

check buttonIdentification of chemicals and drugs interact with genes involved in malignant transfromation
(DGIdb 4.0)
Entrez IDSymbolCategoryInteraction TypesDrug Claim NameDrug NamePMIDs
6687SPG7PROTEASE, ENZYMEdocetaxelDOCETAXEL20038957
6687SPG7PROTEASE, ENZYMEanthracyclines and related substances23441093,21900104
6687SPG7PROTEASE, ENZYMEthalidomideTHALIDOMIDE20038957
Page: 1