
|
|||||
|
 | |
| |
| |
| |
| |
| |
|
Gene: SPG20 |
Gene summary for SPG20 |
| Gene information | Species | Human | Gene symbol | SPG20 | Gene ID | 23111 |
| Gene name | spartin | |
| Gene Alias | SPG20 | |
| Cytomap | 13q13.3 | |
| Gene Type | protein-coding | GO ID | GO:0000902 | UniProtAcc | A0A024RDV9 |
Top |
Malignant transformation analysis |
| Identification of the aberrant gene expression in precancerous and cancerous lesions by comparing the gene expression of stem-like cells in diseased tissues with normal stem cells |
| Entrez ID | Symbol | Replicates | Species | Organ | Tissue | Adj P-value | Log2FC | Malignancy |
| 23111 | SPG20 | P2T-E | Human | Esophagus | ESCC | 5.07e-24 | 5.12e-01 | 0.1177 |
| 23111 | SPG20 | P4T-E | Human | Esophagus | ESCC | 1.18e-04 | -1.11e-02 | 0.1323 |
| 23111 | SPG20 | P5T-E | Human | Esophagus | ESCC | 3.12e-07 | 6.24e-02 | 0.1327 |
| 23111 | SPG20 | P9T-E | Human | Esophagus | ESCC | 2.36e-22 | 5.19e-01 | 0.1131 |
| 23111 | SPG20 | P10T-E | Human | Esophagus | ESCC | 6.20e-28 | 5.00e-01 | 0.116 |
| 23111 | SPG20 | P11T-E | Human | Esophagus | ESCC | 1.49e-14 | 4.84e-01 | 0.1426 |
| 23111 | SPG20 | P12T-E | Human | Esophagus | ESCC | 3.12e-06 | 6.47e-03 | 0.1122 |
| 23111 | SPG20 | P15T-E | Human | Esophagus | ESCC | 7.43e-20 | 2.73e-01 | 0.1149 |
| 23111 | SPG20 | P16T-E | Human | Esophagus | ESCC | 2.45e-05 | 8.74e-02 | 0.1153 |
| 23111 | SPG20 | P20T-E | Human | Esophagus | ESCC | 3.13e-02 | -7.13e-02 | 0.1124 |
| 23111 | SPG20 | P21T-E | Human | Esophagus | ESCC | 2.82e-05 | 5.57e-02 | 0.1617 |
| 23111 | SPG20 | P22T-E | Human | Esophagus | ESCC | 4.61e-12 | 2.59e-01 | 0.1236 |
| 23111 | SPG20 | P24T-E | Human | Esophagus | ESCC | 2.74e-20 | 3.07e-01 | 0.1287 |
| 23111 | SPG20 | P26T-E | Human | Esophagus | ESCC | 5.01e-14 | 1.90e-01 | 0.1276 |
| 23111 | SPG20 | P32T-E | Human | Esophagus | ESCC | 9.12e-18 | 2.59e-01 | 0.1666 |
| 23111 | SPG20 | P36T-E | Human | Esophagus | ESCC | 5.44e-21 | 5.70e-01 | 0.1187 |
| 23111 | SPG20 | P37T-E | Human | Esophagus | ESCC | 3.45e-14 | 2.65e-01 | 0.1371 |
| 23111 | SPG20 | P38T-E | Human | Esophagus | ESCC | 4.02e-02 | 7.78e-02 | 0.127 |
| 23111 | SPG20 | P39T-E | Human | Esophagus | ESCC | 1.08e-07 | 7.10e-02 | 0.0894 |
| 23111 | SPG20 | P40T-E | Human | Esophagus | ESCC | 5.58e-06 | 1.10e-01 | 0.109 |
| Page: 1 2 3 4 |
| Tissue | Expression Dynamics | Abbreviation |
| Esophagus | 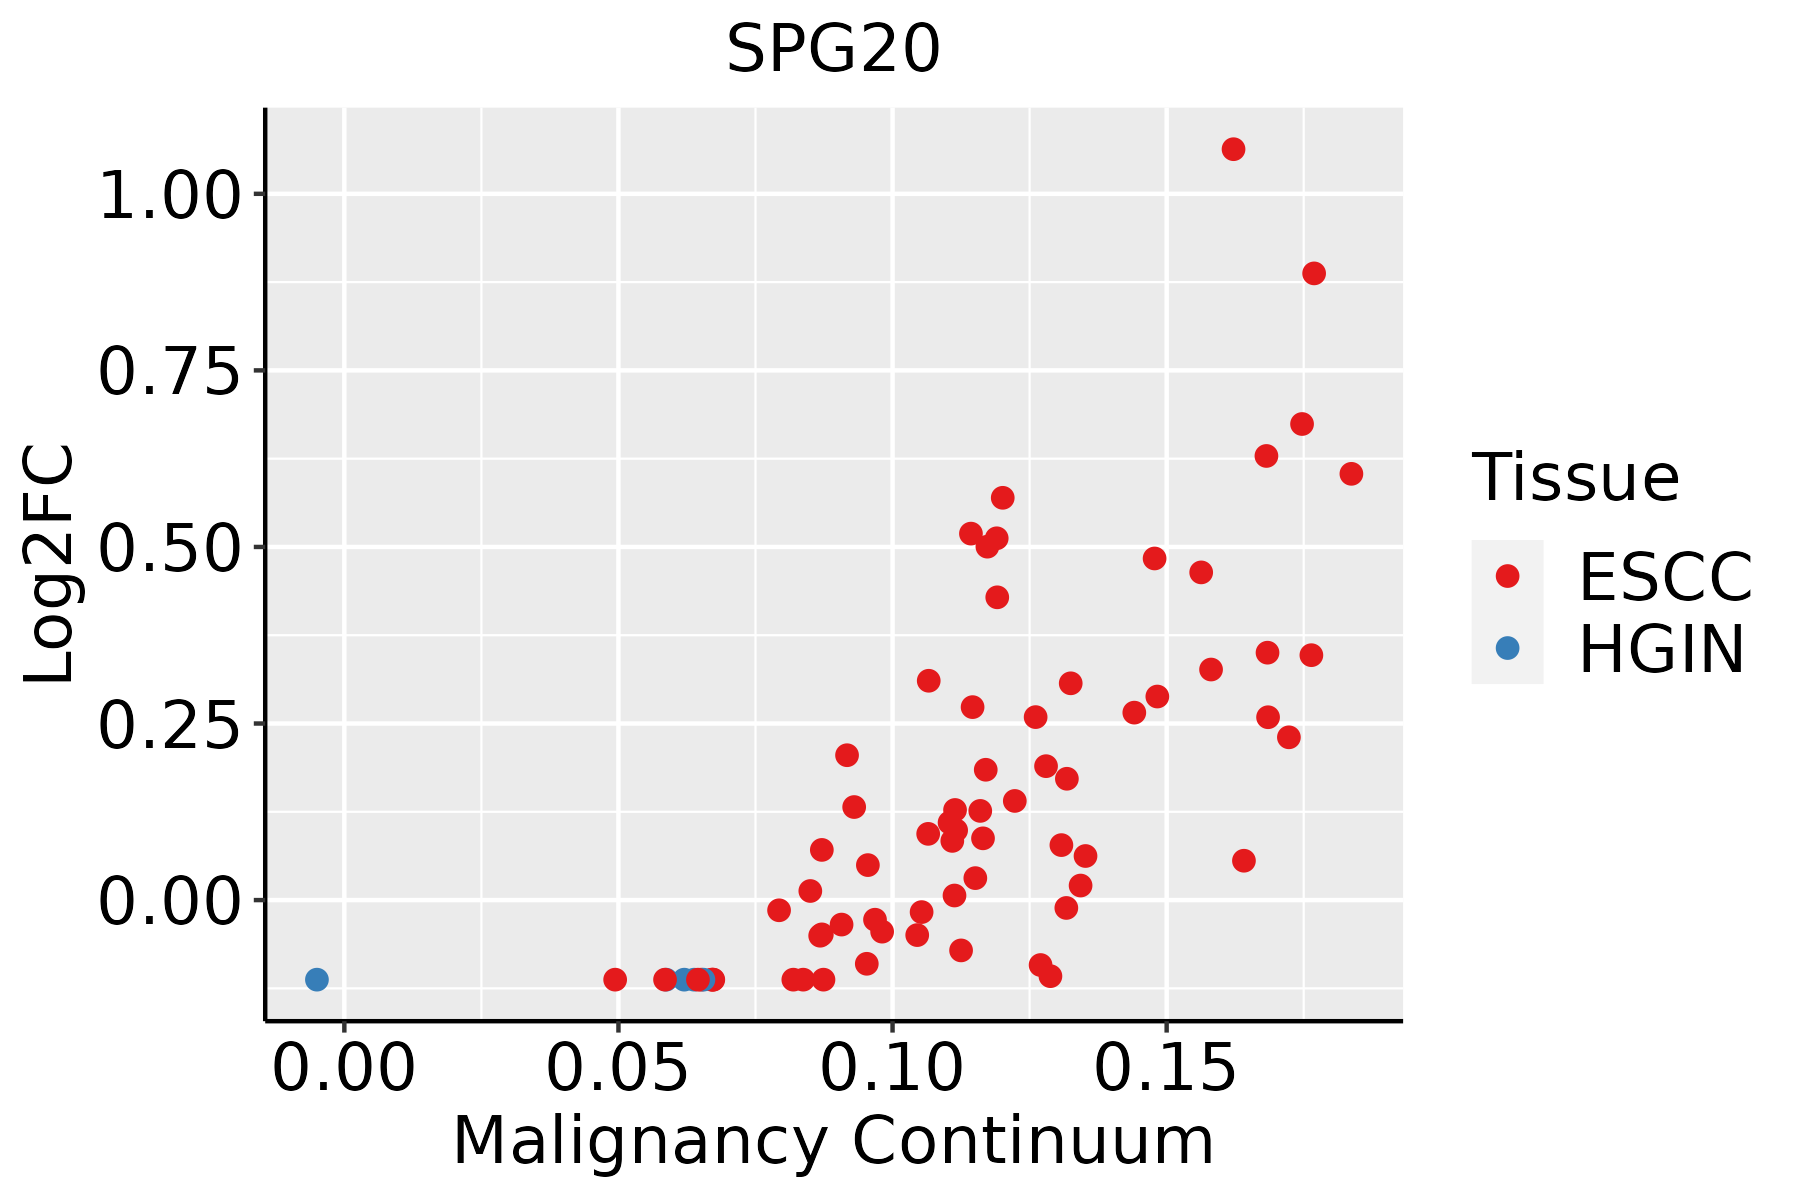 | ESCC: Esophageal squamous cell carcinoma |
| HGIN: High-grade intraepithelial neoplasias | ||
| LGIN: Low-grade intraepithelial neoplasias | ||
| Oral Cavity |  | EOLP: Erosive Oral lichen planus |
| LP: leukoplakia | ||
| NEOLP: Non-erosive oral lichen planus | ||
| OSCC: Oral squamous cell carcinoma | ||
| Prostate |  | BPH: Benign Prostatic Hyperplasia |
| ∗log2FC in expression of this searched gene in stem-like cells from each diseased tissue sample relative to stem-like cells in normal samples in each tissue plotted against the malignancy continuum. Samples are colored based on if they are from different disease stage. |
Top |
Malignant transformation related pathway analysis |
| Find out the enriched GO biological processes and KEGG pathways involved in transition from healthy to precancer to cancer |
| Tissue | Disease Stage | Enriched GO biological Processes |
| Colorectum | AD |  |
| Colorectum | SER |  |
| Colorectum | MSS |  |
| Colorectum | MSI-H |  |
| Colorectum | FAP |  |
| ∗Top 15 enriched GO BP terms are showed in the bar plot of each disease state in each tissue. Each row represents a significant GO biological process which is colored according to the -log10(p.adjust). |
| Page: 1 2 3 4 5 6 7 8 9 |
| GO ID | Tissue | Disease Stage | Description | Gene Ratio | Bg Ratio | pvalue | p.adjust | Count |
| Page: 1 |
| Pathway ID | Tissue | Disease Stage | Description | Gene Ratio | Bg Ratio | pvalue | p.adjust | qvalue | Count |
| hsa0414420 | Endometrium | AEH | Endocytosis | 56/1197 | 251/8465 | 2.58e-04 | 2.15e-03 | 1.57e-03 | 56 |
| hsa04144110 | Endometrium | AEH | Endocytosis | 56/1197 | 251/8465 | 2.58e-04 | 2.15e-03 | 1.57e-03 | 56 |
| hsa0414424 | Endometrium | EEC | Endocytosis | 57/1237 | 251/8465 | 3.34e-04 | 2.82e-03 | 2.10e-03 | 57 |
| hsa0414434 | Endometrium | EEC | Endocytosis | 57/1237 | 251/8465 | 3.34e-04 | 2.82e-03 | 2.10e-03 | 57 |
| Page: 1 |
Top |
Cell-cell communication analysis |
| Identification of potential cell-cell interactions between two cell types and their ligand-receptor pairs for different disease states |
| Ligand | Receptor | LRpair | Pathway | Tissue | Disease Stage |
| Page: 1 |
Top |
Single-cell gene regulatory network inference analysis |
| Find out the significant the regulons (TFs) and the target genes of each regulon across cell types for different disease states |
| TF | Cell Type | Tissue | Disease Stage | Target Gene | RSS | Regulon Activity |
| ∗The dot plots of a searched regulon are shown for all cell subpopulations in each disease state of each tissue based on the regulon specific score inferred using pySCENIC and by calculating the average expression. |
| Page: 1 |
Top |
Somatic mutation of malignant transformation related genes |
| Annotation of somatic variants for genes involved in malignant transformation |
| Hugo Symbol | Variant Class | Variant Classification | dbSNP RS | HGVSc | HGVSp | HGVSp Short | SWISSPROT | BIOTYPE | SIFT | PolyPhen | Tumor Sample Barcode | Tissue | Histology | Sex | Age | Stage | Therapy Types | Drugs | Outcome |
| SPG20 | SNV | Missense_Mutation | c.1350N>C | p.Gln450His | p.Q450H | Q8N0X7 | protein_coding | tolerated(1) | benign(0.018) | TCGA-AN-A0XW-01 | Breast | breast invasive carcinoma | Female | <65 | III/IV | Unknown | Unknown | SD | |
| SPG20 | SNV | Missense_Mutation | c.1064N>C | p.Arg355Thr | p.R355T | Q8N0X7 | protein_coding | tolerated(0.28) | benign(0.01) | TCGA-C8-A26Y-01 | Breast | breast invasive carcinoma | Female | >=65 | I/II | Unknown | Unknown | SD | |
| SPG20 | SNV | Missense_Mutation | c.8N>C | p.Gln3Pro | p.Q3P | Q8N0X7 | protein_coding | deleterious_low_confidence(0.04) | benign(0.001) | TCGA-C8-A27B-01 | Breast | breast invasive carcinoma | Female | <65 | I/II | Chemotherapy | 5-fluorouracil | CR | |
| SPG20 | insertion | Frame_Shift_Ins | novel | c.1379_1380insAACA | p.Gln461ThrfsTer11 | p.Q461Tfs*11 | Q8N0X7 | protein_coding | TCGA-A8-A07R-01 | Breast | breast invasive carcinoma | Female | >=65 | III/IV | Ancillary | zoledronic | SD | ||
| SPG20 | insertion | Frame_Shift_Ins | novel | c.1377_1378insCTAATTATGCTTTTGAACACTTTAATAA | p.Ile460LeufsTer20 | p.I460Lfs*20 | Q8N0X7 | protein_coding | TCGA-A8-A07R-01 | Breast | breast invasive carcinoma | Female | >=65 | III/IV | Ancillary | zoledronic | SD | ||
| SPG20 | SNV | Missense_Mutation | novel | c.1582G>T | p.Asp528Tyr | p.D528Y | Q8N0X7 | protein_coding | deleterious(0.05) | probably_damaging(1) | TCGA-2W-A8YY-01 | Cervix | cervical & endocervical cancer | Female | <65 | I/II | Chemotherapy | cisplatin | CR |
| SPG20 | SNV | Missense_Mutation | c.563N>A | p.Gly188Glu | p.G188E | Q8N0X7 | protein_coding | deleterious(0) | probably_damaging(0.999) | TCGA-C5-A3HE-01 | Cervix | cervical & endocervical cancer | Female | <65 | I/II | Unknown | Unknown | PD | |
| SPG20 | SNV | Missense_Mutation | c.103N>A | p.Glu35Lys | p.E35K | Q8N0X7 | protein_coding | deleterious(0) | probably_damaging(0.999) | TCGA-VS-A958-01 | Cervix | cervical & endocervical cancer | Female | <65 | I/II | Chemotherapy | cisplatin | CR | |
| SPG20 | insertion | Nonsense_Mutation | novel | c.560_561insG | p.Tyr187Ter | p.Y187* | Q8N0X7 | protein_coding | TCGA-C5-A3HD-01 | Cervix | cervical & endocervical cancer | Female | <65 | I/II | Chemotherapy | cisplatin | SD | ||
| SPG20 | insertion | In_Frame_Ins | novel | c.559_560insCCCACGTACCATTTAGAAGGTCAG | p.Tyr187delinsSerHisValProPheArgArgSerAsp | p.Y187delinsSHVPFRRSD | Q8N0X7 | protein_coding | TCGA-C5-A3HD-01 | Cervix | cervical & endocervical cancer | Female | <65 | I/II | Chemotherapy | cisplatin | SD |
| Page: 1 2 3 4 5 6 7 8 9 10 11 12 |
Top |
Related drugs of malignant transformation related genes |
| Identification of chemicals and drugs interact with genes involved in malignant transfromation |
| (DGIdb 4.0) |
| Entrez ID | Symbol | Category | Interaction Types | Drug Claim Name | Drug Name | PMIDs |
| Page: 1 |

Copyright 2023-Present -The University of Texas Health Science Center at Houston |