
|
|||||
|
 | |
| |
| |
| |
| |
| |
|
Gene: SPG11 |
Gene summary for SPG11 |
| Gene information | Species | Human | Gene symbol | SPG11 | Gene ID | 80208 |
| Gene name | SPG11 vesicle trafficking associated, spatacsin | |
| Gene Alias | ALS5 | |
| Cytomap | 15q21.1 | |
| Gene Type | protein-coding | GO ID | GO:0000902 | UniProtAcc | Q96JI7 |
Top |
Malignant transformation analysis |
| Identification of the aberrant gene expression in precancerous and cancerous lesions by comparing the gene expression of stem-like cells in diseased tissues with normal stem cells |
| Entrez ID | Symbol | Replicates | Species | Organ | Tissue | Adj P-value | Log2FC | Malignancy |
| 80208 | SPG11 | HTA11_347_2000001011 | Human | Colorectum | AD | 1.72e-10 | 5.69e-01 | -0.1954 |
| 80208 | SPG11 | HTA11_6818_2000001021 | Human | Colorectum | AD | 3.78e-02 | -3.69e-01 | 0.0588 |
| 80208 | SPG11 | HTA11_99999971662_82457 | Human | Colorectum | MSS | 2.57e-03 | -2.83e-01 | 0.3859 |
| 80208 | SPG11 | F007 | Human | Colorectum | FAP | 1.97e-06 | -4.76e-01 | 0.1176 |
| 80208 | SPG11 | A001-C-207 | Human | Colorectum | FAP | 1.40e-03 | -2.50e-01 | 0.1278 |
| 80208 | SPG11 | A015-C-203 | Human | Colorectum | FAP | 1.53e-31 | -3.16e-01 | -0.1294 |
| 80208 | SPG11 | A015-C-204 | Human | Colorectum | FAP | 7.72e-06 | -2.21e-01 | -0.0228 |
| 80208 | SPG11 | A014-C-040 | Human | Colorectum | FAP | 1.34e-03 | -2.09e-01 | -0.1184 |
| 80208 | SPG11 | A002-C-201 | Human | Colorectum | FAP | 4.80e-14 | -2.97e-01 | 0.0324 |
| 80208 | SPG11 | A002-C-203 | Human | Colorectum | FAP | 2.67e-07 | -1.77e-01 | 0.2786 |
| 80208 | SPG11 | A001-C-119 | Human | Colorectum | FAP | 1.43e-06 | -2.61e-01 | -0.1557 |
| 80208 | SPG11 | A001-C-108 | Human | Colorectum | FAP | 3.89e-16 | -1.11e-01 | -0.0272 |
| 80208 | SPG11 | A002-C-205 | Human | Colorectum | FAP | 6.30e-25 | -2.73e-01 | -0.1236 |
| 80208 | SPG11 | A001-C-104 | Human | Colorectum | FAP | 2.55e-04 | -7.82e-02 | 0.0184 |
| 80208 | SPG11 | A015-C-005 | Human | Colorectum | FAP | 3.85e-04 | -1.23e-01 | -0.0336 |
| 80208 | SPG11 | A015-C-006 | Human | Colorectum | FAP | 7.15e-18 | -1.86e-01 | -0.0994 |
| 80208 | SPG11 | A015-C-106 | Human | Colorectum | FAP | 1.47e-14 | -1.66e-01 | -0.0511 |
| 80208 | SPG11 | A002-C-114 | Human | Colorectum | FAP | 1.28e-19 | -2.96e-01 | -0.1561 |
| 80208 | SPG11 | A015-C-104 | Human | Colorectum | FAP | 5.07e-34 | -2.76e-01 | -0.1899 |
| 80208 | SPG11 | A001-C-014 | Human | Colorectum | FAP | 1.70e-18 | -2.98e-01 | 0.0135 |
| Page: 1 2 3 4 5 6 7 |
| Tissue | Expression Dynamics | Abbreviation |
| Colorectum (GSE201348) | 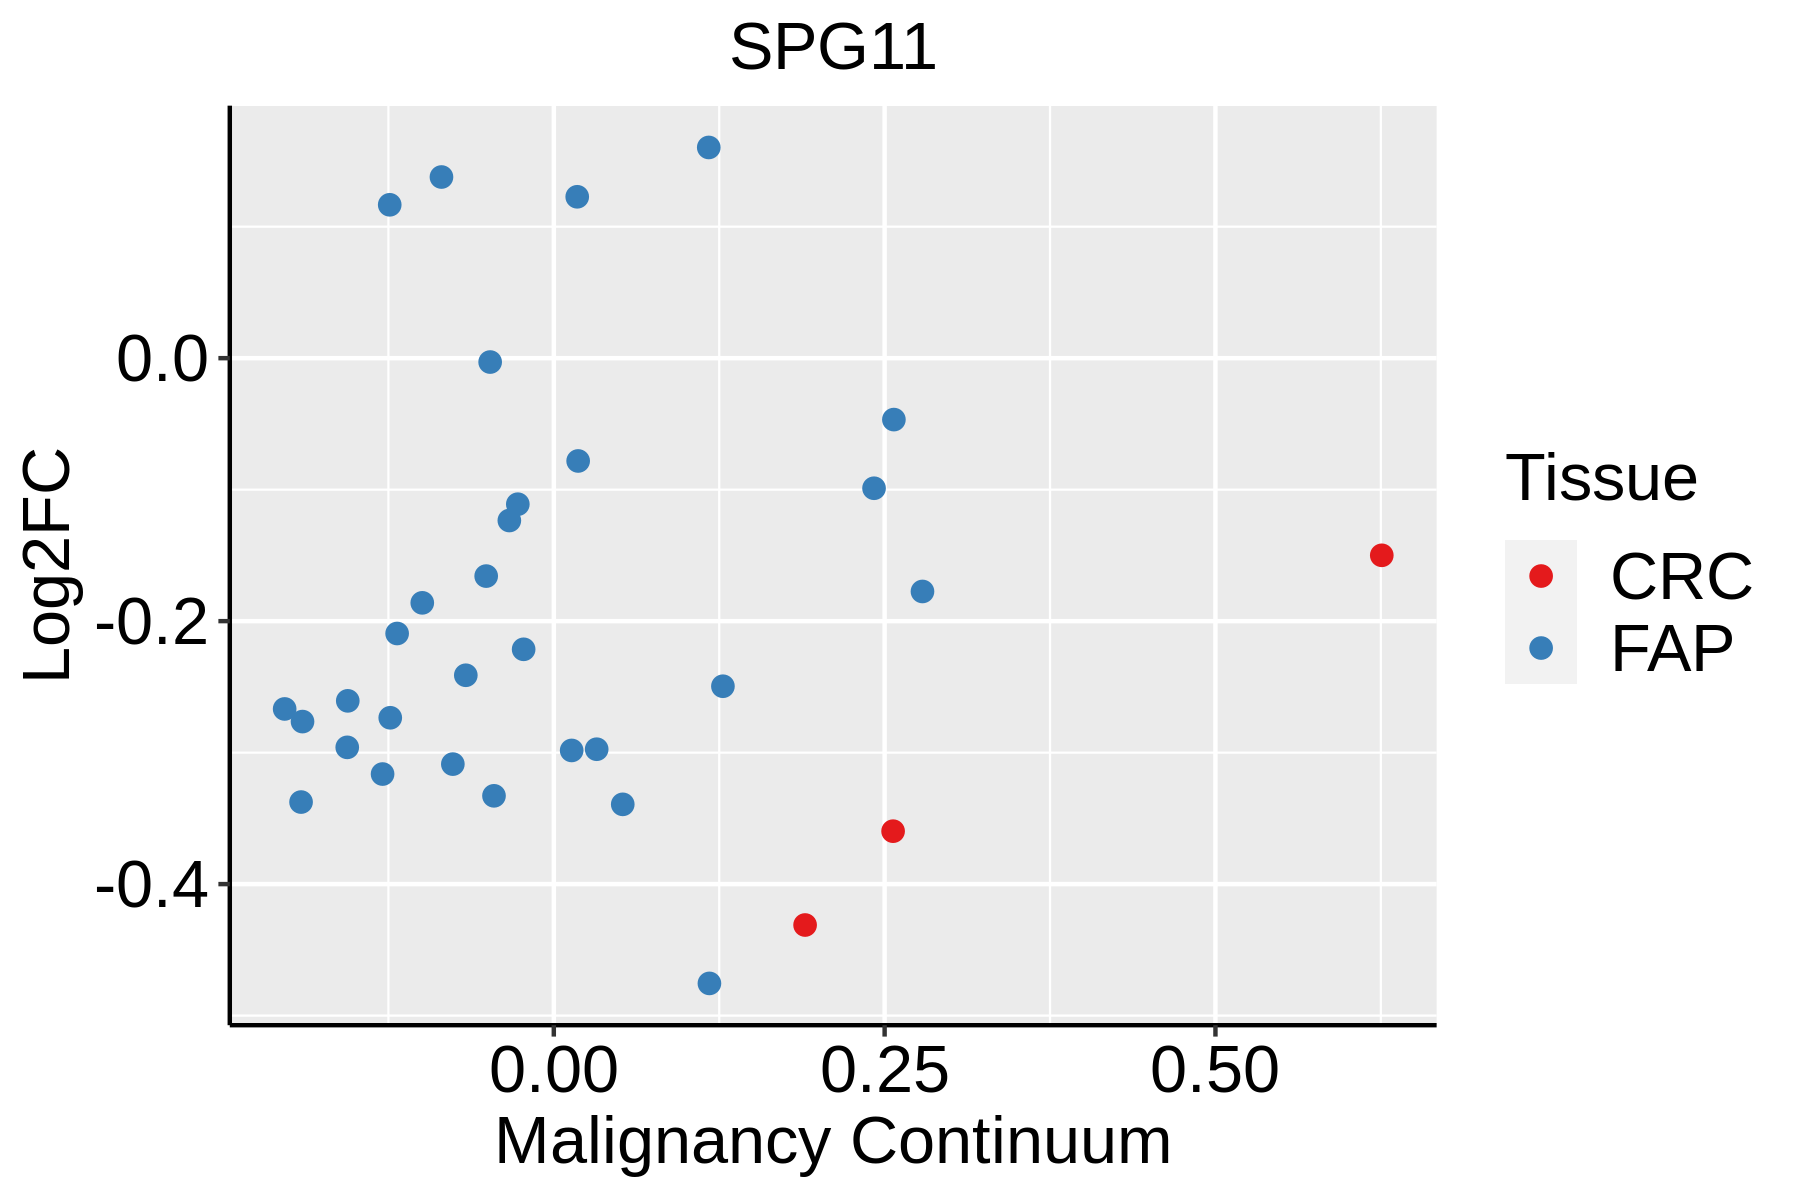 | FAP: Familial adenomatous polyposis |
| CRC: Colorectal cancer | ||
| Colorectum (HTA11) | 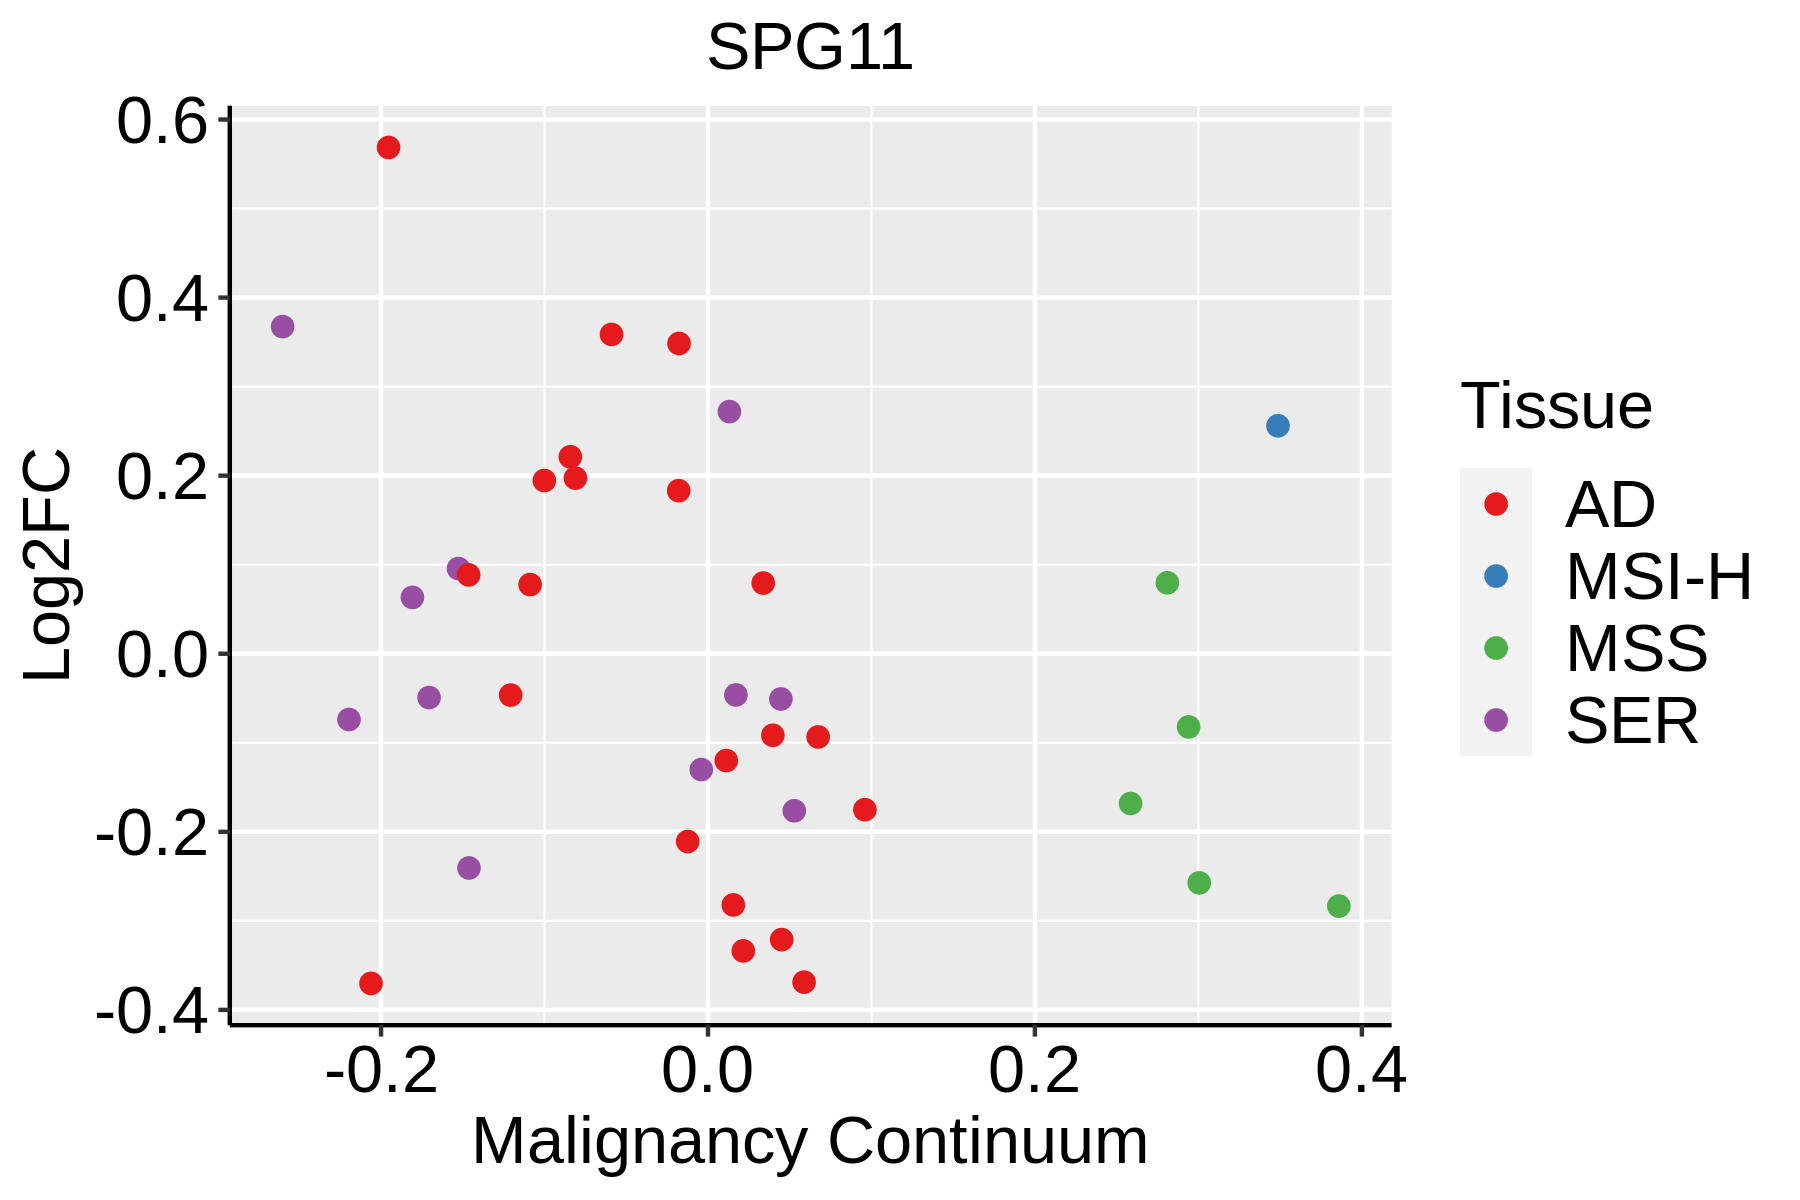 | AD: Adenomas |
| SER: Sessile serrated lesions | ||
| MSI-H: Microsatellite-high colorectal cancer | ||
| MSS: Microsatellite stable colorectal cancer | ||
| Esophagus |  | ESCC: Esophageal squamous cell carcinoma |
| HGIN: High-grade intraepithelial neoplasias | ||
| LGIN: Low-grade intraepithelial neoplasias | ||
| Liver | 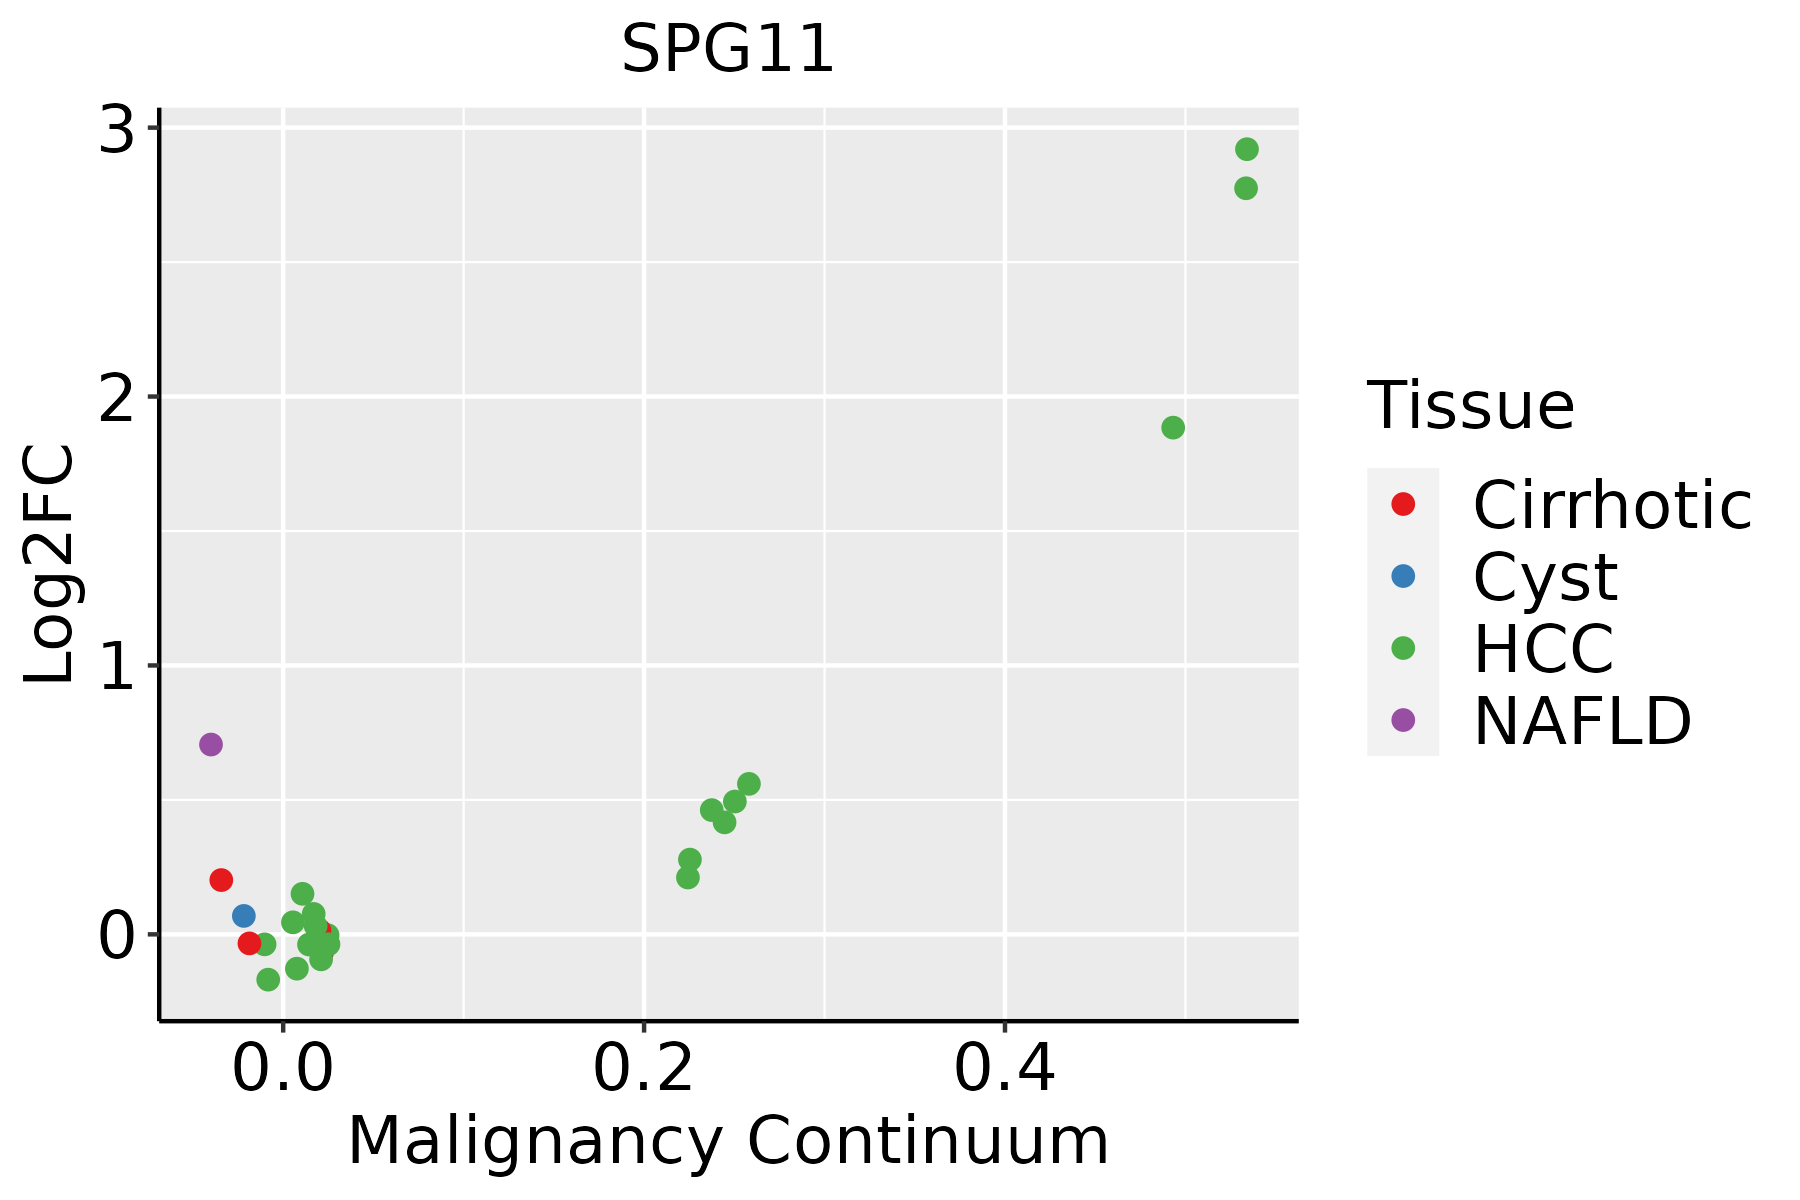 | HCC: Hepatocellular carcinoma |
| NAFLD: Non-alcoholic fatty liver disease | ||
| Lung | 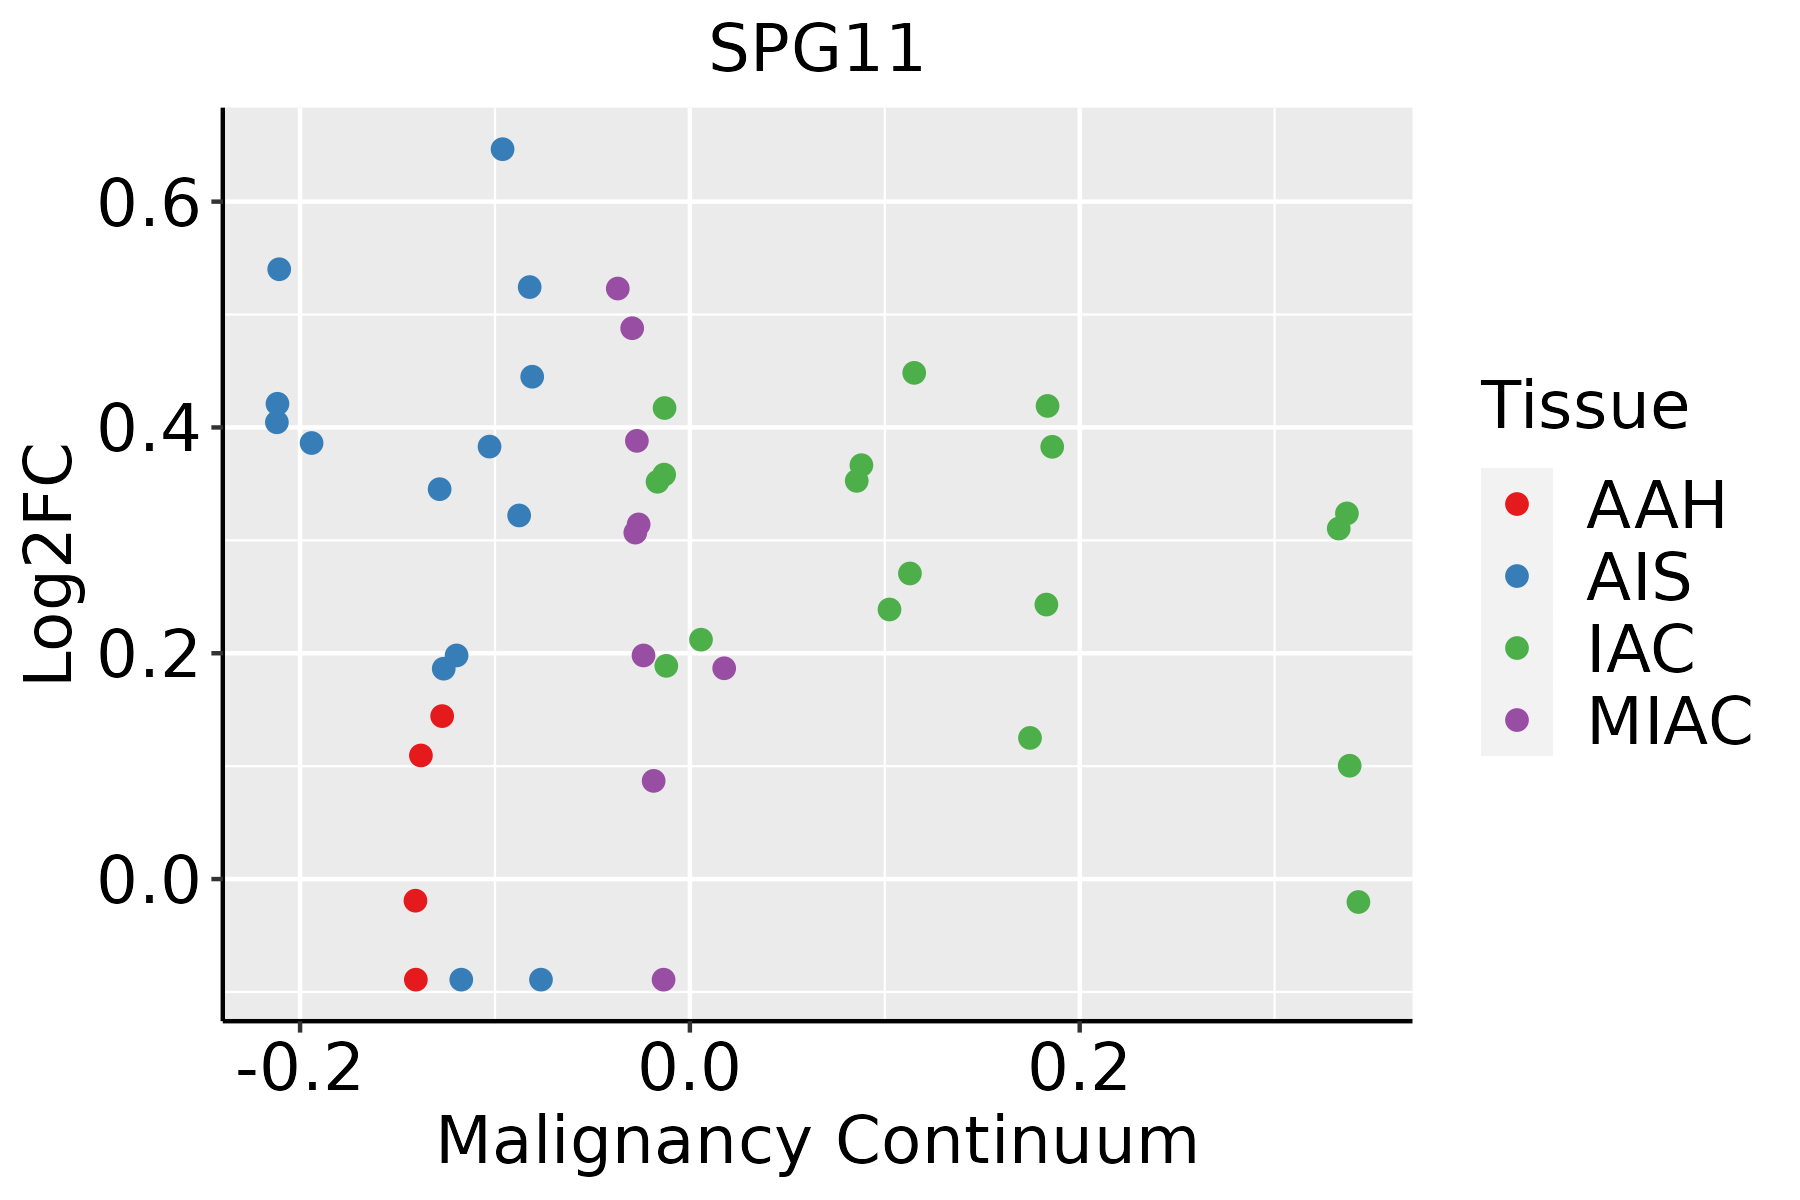 | AAH: Atypical adenomatous hyperplasia |
| AIS: Adenocarcinoma in situ | ||
| IAC: Invasive lung adenocarcinoma | ||
| MIA: Minimally invasive adenocarcinoma | ||
| Thyroid | 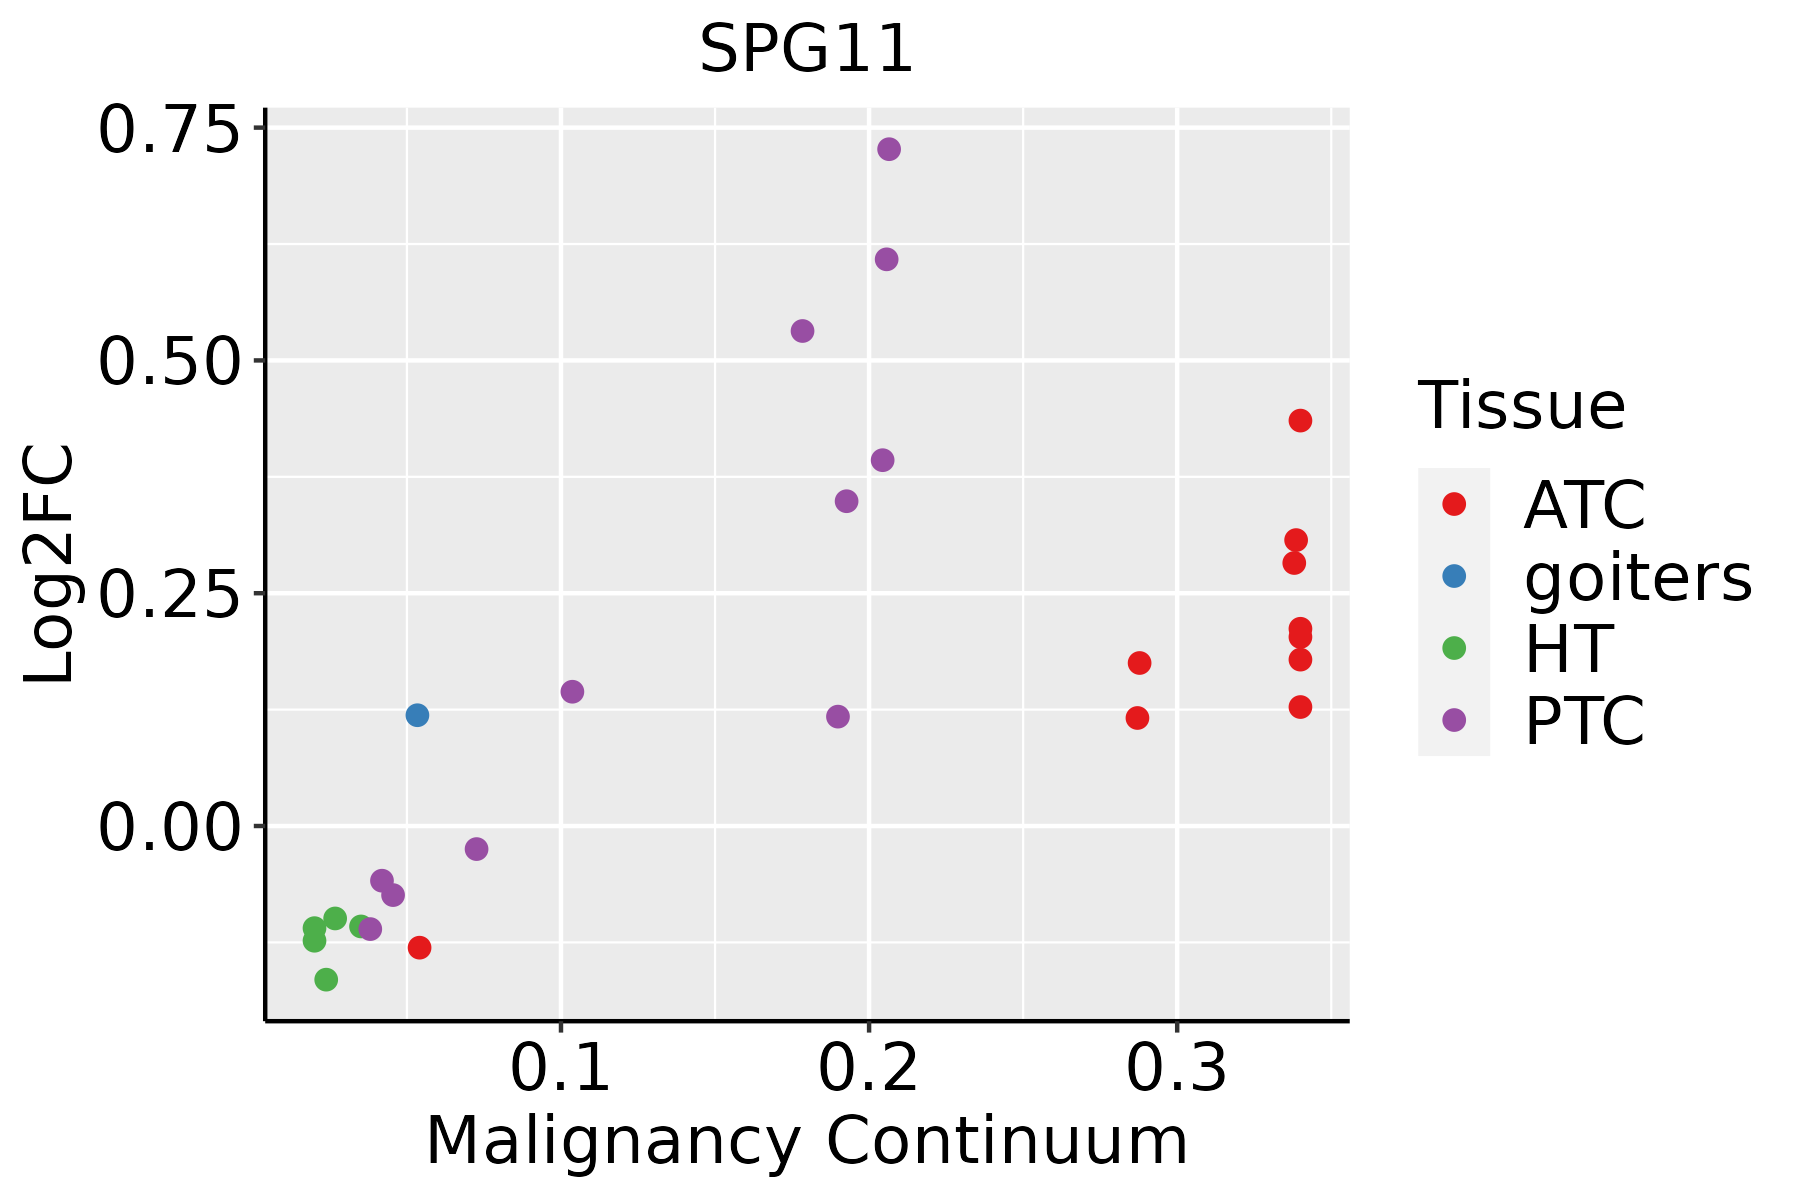 | ATC: Anaplastic thyroid cancer |
| HT: Hashimoto's thyroiditis | ||
| PTC: Papillary thyroid cancer |
| ∗log2FC in expression of this searched gene in stem-like cells from each diseased tissue sample relative to stem-like cells in normal samples in each tissue plotted against the malignancy continuum. Samples are colored based on if they are from different disease stage. |
Top |
Malignant transformation related pathway analysis |
| Find out the enriched GO biological processes and KEGG pathways involved in transition from healthy to precancer to cancer |
| Tissue | Disease Stage | Enriched GO biological Processes |
| Colorectum | AD |  |
| Colorectum | SER |  |
| Colorectum | MSS |  |
| Colorectum | MSI-H |  |
| Colorectum | FAP |  |
| ∗Top 15 enriched GO BP terms are showed in the bar plot of each disease state in each tissue. Each row represents a significant GO biological process which is colored according to the -log10(p.adjust). |
| Page: 1 2 3 4 5 6 7 8 9 |
| GO ID | Tissue | Disease Stage | Description | Gene Ratio | Bg Ratio | pvalue | p.adjust | Count |
| GO:0051656 | Colorectum | AD | establishment of organelle localization | 131/3918 | 390/18723 | 3.00e-09 | 2.06e-07 | 131 |
| GO:0016050 | Colorectum | AD | vesicle organization | 101/3918 | 300/18723 | 1.65e-07 | 7.17e-06 | 101 |
| GO:0016049 | Colorectum | AD | cell growth | 143/3918 | 482/18723 | 2.83e-06 | 8.09e-05 | 143 |
| GO:0051650 | Colorectum | AD | establishment of vesicle localization | 57/3918 | 161/18723 | 1.47e-05 | 3.15e-04 | 57 |
| GO:0007409 | Colorectum | AD | axonogenesis | 122/3918 | 418/18723 | 3.36e-05 | 6.15e-04 | 122 |
| GO:0051648 | Colorectum | AD | vesicle localization | 59/3918 | 177/18723 | 7.83e-05 | 1.25e-03 | 59 |
| GO:0061564 | Colorectum | AD | axon development | 132/3918 | 467/18723 | 8.40e-05 | 1.31e-03 | 132 |
| GO:0030705 | Colorectum | AD | cytoskeleton-dependent intracellular transport | 60/3918 | 195/18723 | 7.56e-04 | 7.59e-03 | 60 |
| GO:0048588 | Colorectum | AD | developmental cell growth | 67/3918 | 234/18723 | 3.03e-03 | 2.25e-02 | 67 |
| GO:0048675 | Colorectum | AD | axon extension | 38/3918 | 120/18723 | 3.76e-03 | 2.65e-02 | 38 |
| GO:0007033 | Colorectum | AD | vacuole organization | 53/3918 | 180/18723 | 4.18e-03 | 2.89e-02 | 53 |
| GO:0060560 | Colorectum | AD | developmental growth involved in morphogenesis | 66/3918 | 234/18723 | 4.75e-03 | 3.22e-02 | 66 |
| GO:0048284 | Colorectum | AD | organelle fusion | 42/3918 | 141/18723 | 8.04e-03 | 4.73e-02 | 42 |
| GO:00516562 | Colorectum | MSS | establishment of organelle localization | 115/3467 | 390/18723 | 7.30e-08 | 3.67e-06 | 115 |
| GO:00160502 | Colorectum | MSS | vesicle organization | 93/3467 | 300/18723 | 1.04e-07 | 4.97e-06 | 93 |
| GO:00516502 | Colorectum | MSS | establishment of vesicle localization | 51/3467 | 161/18723 | 3.92e-05 | 7.45e-04 | 51 |
| GO:00160492 | Colorectum | MSS | cell growth | 123/3467 | 482/18723 | 7.15e-05 | 1.21e-03 | 123 |
| GO:00516482 | Colorectum | MSS | vesicle localization | 53/3467 | 177/18723 | 1.47e-04 | 2.16e-03 | 53 |
| GO:00074092 | Colorectum | MSS | axonogenesis | 105/3467 | 418/18723 | 4.32e-04 | 5.23e-03 | 105 |
| GO:00615642 | Colorectum | MSS | axon development | 115/3467 | 467/18723 | 5.33e-04 | 6.00e-03 | 115 |
| Page: 1 2 3 4 5 6 7 8 9 10 |
| Pathway ID | Tissue | Disease Stage | Description | Gene Ratio | Bg Ratio | pvalue | p.adjust | qvalue | Count |
| hsa05014 | Colorectum | AD | Amyotrophic lateral sclerosis | 164/2092 | 364/8465 | 4.28e-18 | 1.27e-16 | 8.09e-17 | 164 |
| hsa05022 | Colorectum | AD | Pathways of neurodegeneration - multiple diseases | 201/2092 | 476/8465 | 4.54e-18 | 1.27e-16 | 8.09e-17 | 201 |
| hsa050141 | Colorectum | AD | Amyotrophic lateral sclerosis | 164/2092 | 364/8465 | 4.28e-18 | 1.27e-16 | 8.09e-17 | 164 |
| hsa050221 | Colorectum | AD | Pathways of neurodegeneration - multiple diseases | 201/2092 | 476/8465 | 4.54e-18 | 1.27e-16 | 8.09e-17 | 201 |
| hsa050224 | Colorectum | MSS | Pathways of neurodegeneration - multiple diseases | 192/1875 | 476/8465 | 2.79e-20 | 1.04e-18 | 6.36e-19 | 192 |
| hsa050144 | Colorectum | MSS | Amyotrophic lateral sclerosis | 156/1875 | 364/8465 | 1.43e-19 | 4.62e-18 | 2.83e-18 | 156 |
| hsa050225 | Colorectum | MSS | Pathways of neurodegeneration - multiple diseases | 192/1875 | 476/8465 | 2.79e-20 | 1.04e-18 | 6.36e-19 | 192 |
| hsa050145 | Colorectum | MSS | Amyotrophic lateral sclerosis | 156/1875 | 364/8465 | 1.43e-19 | 4.62e-18 | 2.83e-18 | 156 |
| hsa050228 | Colorectum | FAP | Pathways of neurodegeneration - multiple diseases | 117/1404 | 476/8465 | 2.81e-06 | 4.47e-05 | 2.72e-05 | 117 |
| hsa050148 | Colorectum | FAP | Amyotrophic lateral sclerosis | 91/1404 | 364/8465 | 1.84e-05 | 2.36e-04 | 1.44e-04 | 91 |
| hsa050229 | Colorectum | FAP | Pathways of neurodegeneration - multiple diseases | 117/1404 | 476/8465 | 2.81e-06 | 4.47e-05 | 2.72e-05 | 117 |
| hsa050149 | Colorectum | FAP | Amyotrophic lateral sclerosis | 91/1404 | 364/8465 | 1.84e-05 | 2.36e-04 | 1.44e-04 | 91 |
| hsa05014210 | Esophagus | ESCC | Amyotrophic lateral sclerosis | 266/4205 | 364/8465 | 1.31e-20 | 2.20e-18 | 1.13e-18 | 266 |
| hsa05022210 | Esophagus | ESCC | Pathways of neurodegeneration - multiple diseases | 318/4205 | 476/8465 | 6.10e-15 | 2.04e-13 | 1.05e-13 | 318 |
| hsa0501438 | Esophagus | ESCC | Amyotrophic lateral sclerosis | 266/4205 | 364/8465 | 1.31e-20 | 2.20e-18 | 1.13e-18 | 266 |
| hsa0502238 | Esophagus | ESCC | Pathways of neurodegeneration - multiple diseases | 318/4205 | 476/8465 | 6.10e-15 | 2.04e-13 | 1.05e-13 | 318 |
| hsa0501422 | Liver | HCC | Amyotrophic lateral sclerosis | 252/4020 | 364/8465 | 8.85e-18 | 7.41e-16 | 4.12e-16 | 252 |
| hsa0502222 | Liver | HCC | Pathways of neurodegeneration - multiple diseases | 298/4020 | 476/8465 | 6.59e-12 | 1.30e-10 | 7.22e-11 | 298 |
| hsa0501432 | Liver | HCC | Amyotrophic lateral sclerosis | 252/4020 | 364/8465 | 8.85e-18 | 7.41e-16 | 4.12e-16 | 252 |
| hsa0502232 | Liver | HCC | Pathways of neurodegeneration - multiple diseases | 298/4020 | 476/8465 | 6.59e-12 | 1.30e-10 | 7.22e-11 | 298 |
| Page: 1 |
Top |
Cell-cell communication analysis |
| Identification of potential cell-cell interactions between two cell types and their ligand-receptor pairs for different disease states |
| Ligand | Receptor | LRpair | Pathway | Tissue | Disease Stage |
| Page: 1 |
Top |
Single-cell gene regulatory network inference analysis |
| Find out the significant the regulons (TFs) and the target genes of each regulon across cell types for different disease states |
| TF | Cell Type | Tissue | Disease Stage | Target Gene | RSS | Regulon Activity |
| ∗The dot plots of a searched regulon are shown for all cell subpopulations in each disease state of each tissue based on the regulon specific score inferred using pySCENIC and by calculating the average expression. |
| Page: 1 |
Top |
Somatic mutation of malignant transformation related genes |
| Annotation of somatic variants for genes involved in malignant transformation |
| Hugo Symbol | Variant Class | Variant Classification | dbSNP RS | HGVSc | HGVSp | HGVSp Short | SWISSPROT | BIOTYPE | SIFT | PolyPhen | Tumor Sample Barcode | Tissue | Histology | Sex | Age | Stage | Therapy Types | Drugs | Outcome |
| SPG11 | SNV | Missense_Mutation | novel | c.3438C>G | p.Ile1146Met | p.I1146M | Q96JI7 | protein_coding | deleterious(0) | benign(0.028) | TCGA-3C-AALI-01 | Breast | breast invasive carcinoma | Female | <65 | I/II | Unspecific | Poly E | Complete Response |
| SPG11 | SNV | Missense_Mutation | c.6256C>G | p.Leu2086Val | p.L2086V | Q96JI7 | protein_coding | deleterious(0) | probably_damaging(0.999) | TCGA-A2-A0EV-01 | Breast | breast invasive carcinoma | Female | >=65 | I/II | Unknown | Unknown | SD | |
| SPG11 | SNV | Missense_Mutation | c.6092G>A | p.Arg2031Gln | p.R2031Q | Q96JI7 | protein_coding | deleterious(0) | possibly_damaging(0.809) | TCGA-AC-A5XS-01 | Breast | breast invasive carcinoma | Female | >=65 | I/II | Hormone Therapy | femara | SD | |
| SPG11 | SNV | Missense_Mutation | rs753466044 | c.7015G>A | p.Glu2339Lys | p.E2339K | Q96JI7 | protein_coding | deleterious(0) | possibly_damaging(0.661) | TCGA-B6-A0WZ-01 | Breast | breast invasive carcinoma | Female | <65 | I/II | Unknown | Unknown | PD |
| SPG11 | SNV | Missense_Mutation | rs758008249 | c.6621N>G | p.Ile2207Met | p.I2207M | Q96JI7 | protein_coding | deleterious(0) | probably_damaging(0.992) | TCGA-BH-A0B6-01 | Breast | breast invasive carcinoma | Female | <65 | I/II | Unknown | Unknown | SD |
| SPG11 | SNV | Missense_Mutation | c.1028N>T | p.Ser343Leu | p.S343L | Q96JI7 | protein_coding | tolerated(0.23) | benign(0.009) | TCGA-BH-A0WA-01 | Breast | breast invasive carcinoma | Female | >=65 | I/II | Unknown | Unknown | SD | |
| SPG11 | SNV | Missense_Mutation | c.1694N>G | p.Ser565Cys | p.S565C | Q96JI7 | protein_coding | deleterious(0.01) | benign(0.213) | TCGA-GM-A2DO-01 | Breast | breast invasive carcinoma | Female | <65 | I/II | Hormone Therapy | tamoxiphen | CR | |
| SPG11 | insertion | In_Frame_Ins | novel | c.7000_7001insACT | p.Ala2334delinsAspSer | p.A2334delinsDS | Q96JI7 | protein_coding | TCGA-A8-A090-01 | Breast | breast invasive carcinoma | Female | >=65 | I/II | Unknown | Unknown | SD | ||
| SPG11 | insertion | Frame_Shift_Ins | novel | c.7000-1_7000insCCTGGGCAACAGAGTAA | p.Ala2334ProfsTer28 | p.A2334Pfs*28 | Q96JI7 | protein_coding | TCGA-A8-A090-01 | Breast | breast invasive carcinoma | Female | >=65 | I/II | Unknown | Unknown | SD | ||
| SPG11 | insertion | Nonsense_Mutation | novel | c.4167_4168insGTAAGTACCCAGAGAACAATAGAATAAGTAATGAGG | p.Lys1389_Ser1390insValSerThrGlnArgThrIleGluTerValMetArg | p.K1389_S1390insVSTQRTIE*VMR | Q96JI7 | protein_coding | TCGA-AN-A03Y-01 | Breast | breast invasive carcinoma | Female | >=65 | I/II | Unknown | Unknown | SD |
| Page: 1 2 3 4 5 6 7 8 9 10 11 12 13 14 15 16 17 18 19 20 21 |
Top |
Related drugs of malignant transformation related genes |
| Identification of chemicals and drugs interact with genes involved in malignant transfromation |
| (DGIdb 4.0) |
| Entrez ID | Symbol | Category | Interaction Types | Drug Claim Name | Drug Name | PMIDs |
| Page: 1 |

Copyright 2023-Present -The University of Texas Health Science Center at Houston |