
|
|||||
|
 | |
| |
| |
| |
| |
| |
|
Gene: SPECC1 |
Gene summary for SPECC1 |
| Gene information | Species | Human | Gene symbol | SPECC1 | Gene ID | 92521 |
| Gene name | sperm antigen with calponin homology and coiled-coil domains 1 | |
| Gene Alias | CYTSB | |
| Cytomap | 17p11.2 | |
| Gene Type | protein-coding | GO ID | GO:0006996 | UniProtAcc | A0A024QYY9 |
Top |
Malignant transformation analysis |
| Identification of the aberrant gene expression in precancerous and cancerous lesions by comparing the gene expression of stem-like cells in diseased tissues with normal stem cells |
| Entrez ID | Symbol | Replicates | Species | Organ | Tissue | Adj P-value | Log2FC | Malignancy |
| 92521 | SPECC1 | AEH-subject1 | Human | Endometrium | AEH | 6.52e-20 | 6.28e-01 | -0.3059 |
| 92521 | SPECC1 | AEH-subject2 | Human | Endometrium | AEH | 7.85e-22 | 6.66e-01 | -0.2525 |
| 92521 | SPECC1 | AEH-subject3 | Human | Endometrium | AEH | 1.78e-21 | 6.57e-01 | -0.2576 |
| 92521 | SPECC1 | AEH-subject4 | Human | Endometrium | AEH | 1.53e-13 | 4.93e-01 | -0.2657 |
| 92521 | SPECC1 | AEH-subject5 | Human | Endometrium | AEH | 3.65e-03 | 3.35e-01 | -0.2953 |
| 92521 | SPECC1 | EEC-subject1 | Human | Endometrium | EEC | 1.98e-06 | 3.66e-01 | -0.2682 |
| 92521 | SPECC1 | EEC-subject2 | Human | Endometrium | EEC | 5.91e-10 | 5.32e-01 | -0.2607 |
| 92521 | SPECC1 | EEC-subject4 | Human | Endometrium | EEC | 3.46e-20 | 6.15e-01 | -0.2571 |
| 92521 | SPECC1 | EEC-subject5 | Human | Endometrium | EEC | 4.29e-33 | 8.40e-01 | -0.249 |
| 92521 | SPECC1 | GSM5276937 | Human | Endometrium | EEC | 3.60e-02 | -3.39e-02 | -0.0897 |
| 92521 | SPECC1 | GSM6177620_NYU_UCEC1_lib1_lib1 | Human | Endometrium | EEC | 5.96e-15 | 9.62e-02 | -0.1869 |
| 92521 | SPECC1 | GSM6177620_NYU_UCEC1_lib2_lib2 | Human | Endometrium | EEC | 2.18e-12 | 7.19e-02 | -0.1875 |
| 92521 | SPECC1 | GSM6177620_NYU_UCEC1_lib3_lib3 | Human | Endometrium | EEC | 1.21e-12 | 3.77e-02 | -0.1883 |
| 92521 | SPECC1 | GSM6177621_NYU_UCEC2_lib1_lib1 | Human | Endometrium | EEC | 1.13e-03 | 2.85e-02 | -0.1934 |
| 92521 | SPECC1 | GSM6177622_NYU_UCEC3_lib1_lib1 | Human | Endometrium | EEC | 4.51e-12 | 6.71e-02 | -0.1917 |
| 92521 | SPECC1 | GSM6177622_NYU_UCEC3_lib2_lib2 | Human | Endometrium | EEC | 8.64e-13 | 1.12e-01 | -0.1916 |
| 92521 | SPECC1 | LZE4T | Human | Esophagus | ESCC | 1.01e-07 | 2.48e-01 | 0.0811 |
| 92521 | SPECC1 | LZE5T | Human | Esophagus | ESCC | 4.52e-02 | 2.00e-01 | 0.0514 |
| 92521 | SPECC1 | LZE7T | Human | Esophagus | ESCC | 4.52e-04 | 1.73e-01 | 0.0667 |
| 92521 | SPECC1 | LZE8T | Human | Esophagus | ESCC | 3.91e-05 | 1.11e-01 | 0.067 |
| Page: 1 2 3 4 5 |
| Tissue | Expression Dynamics | Abbreviation |
| Endometrium | 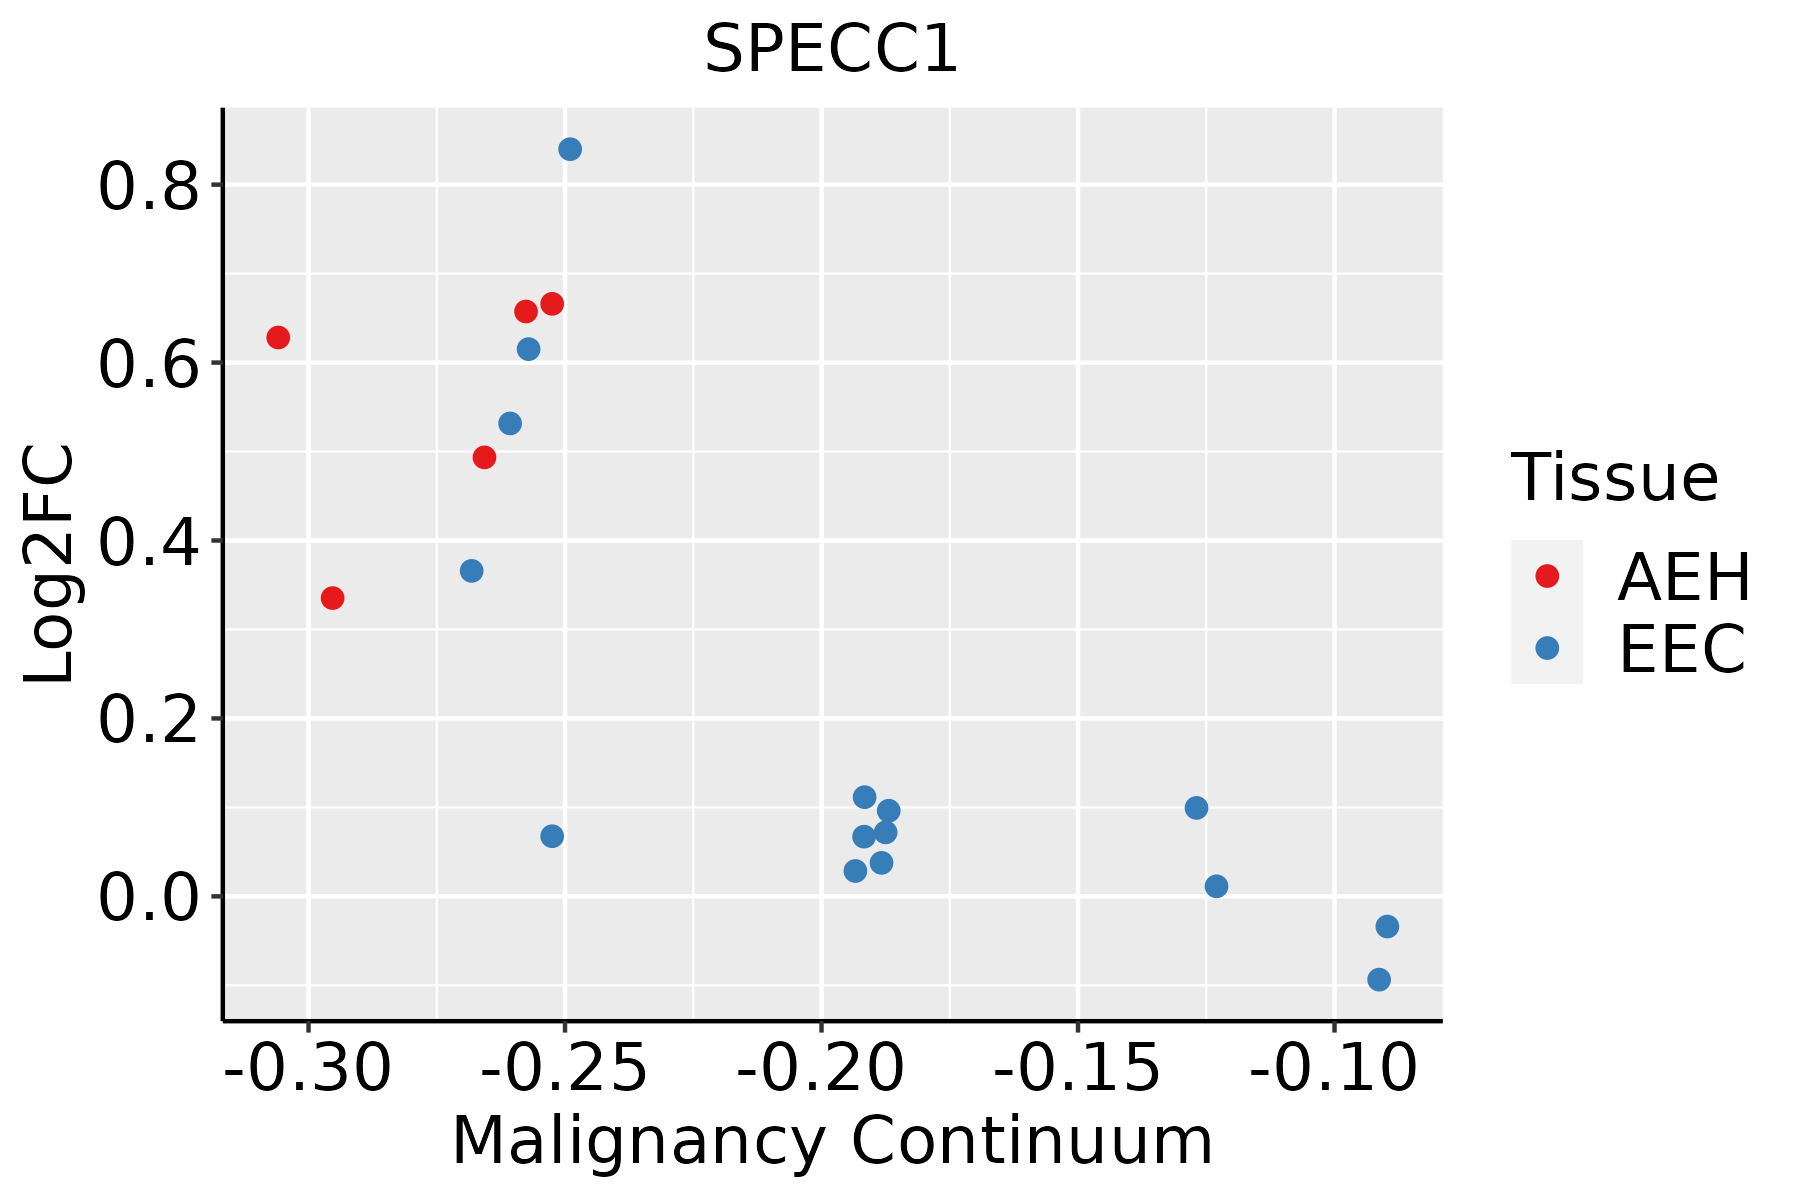 | AEH: Atypical endometrial hyperplasia |
| EEC: Endometrioid Cancer | ||
| Esophagus | 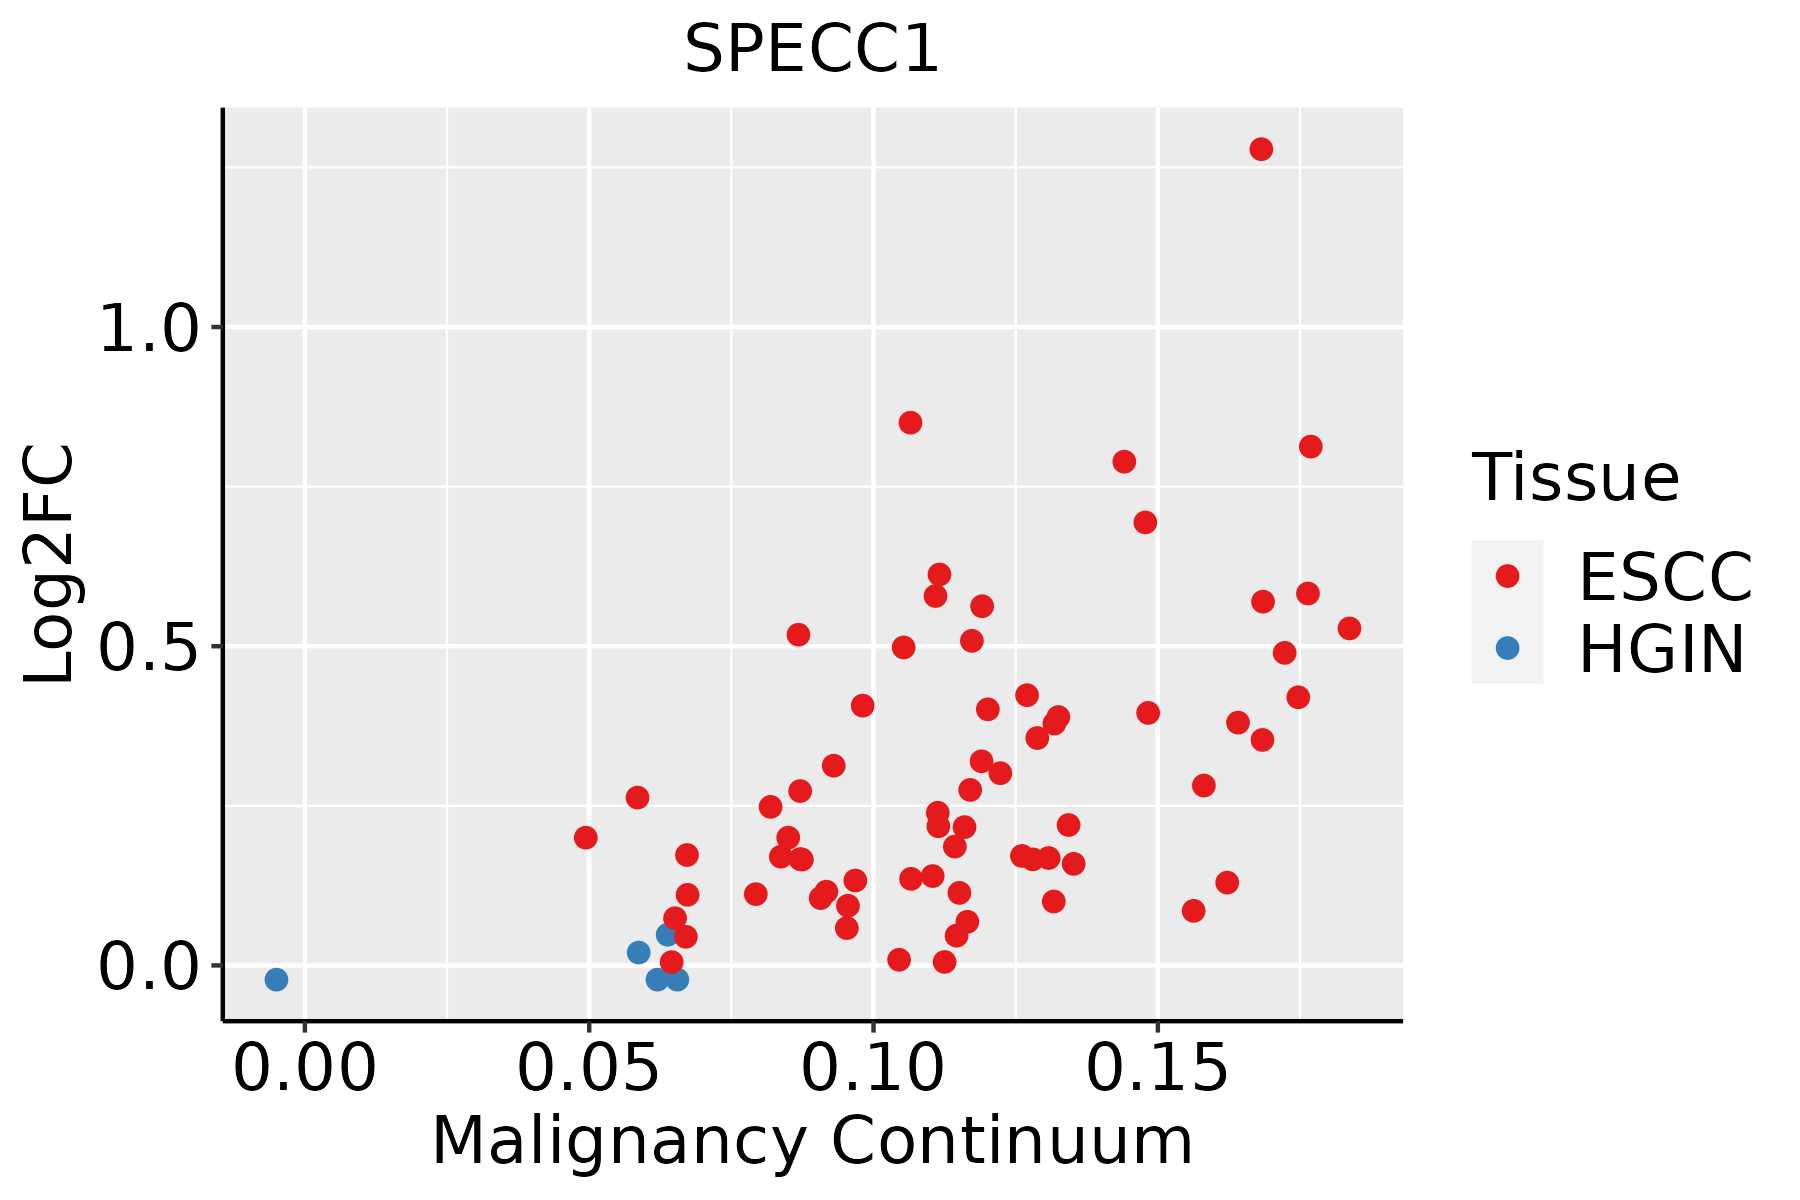 | ESCC: Esophageal squamous cell carcinoma |
| HGIN: High-grade intraepithelial neoplasias | ||
| LGIN: Low-grade intraepithelial neoplasias | ||
| Oral Cavity | 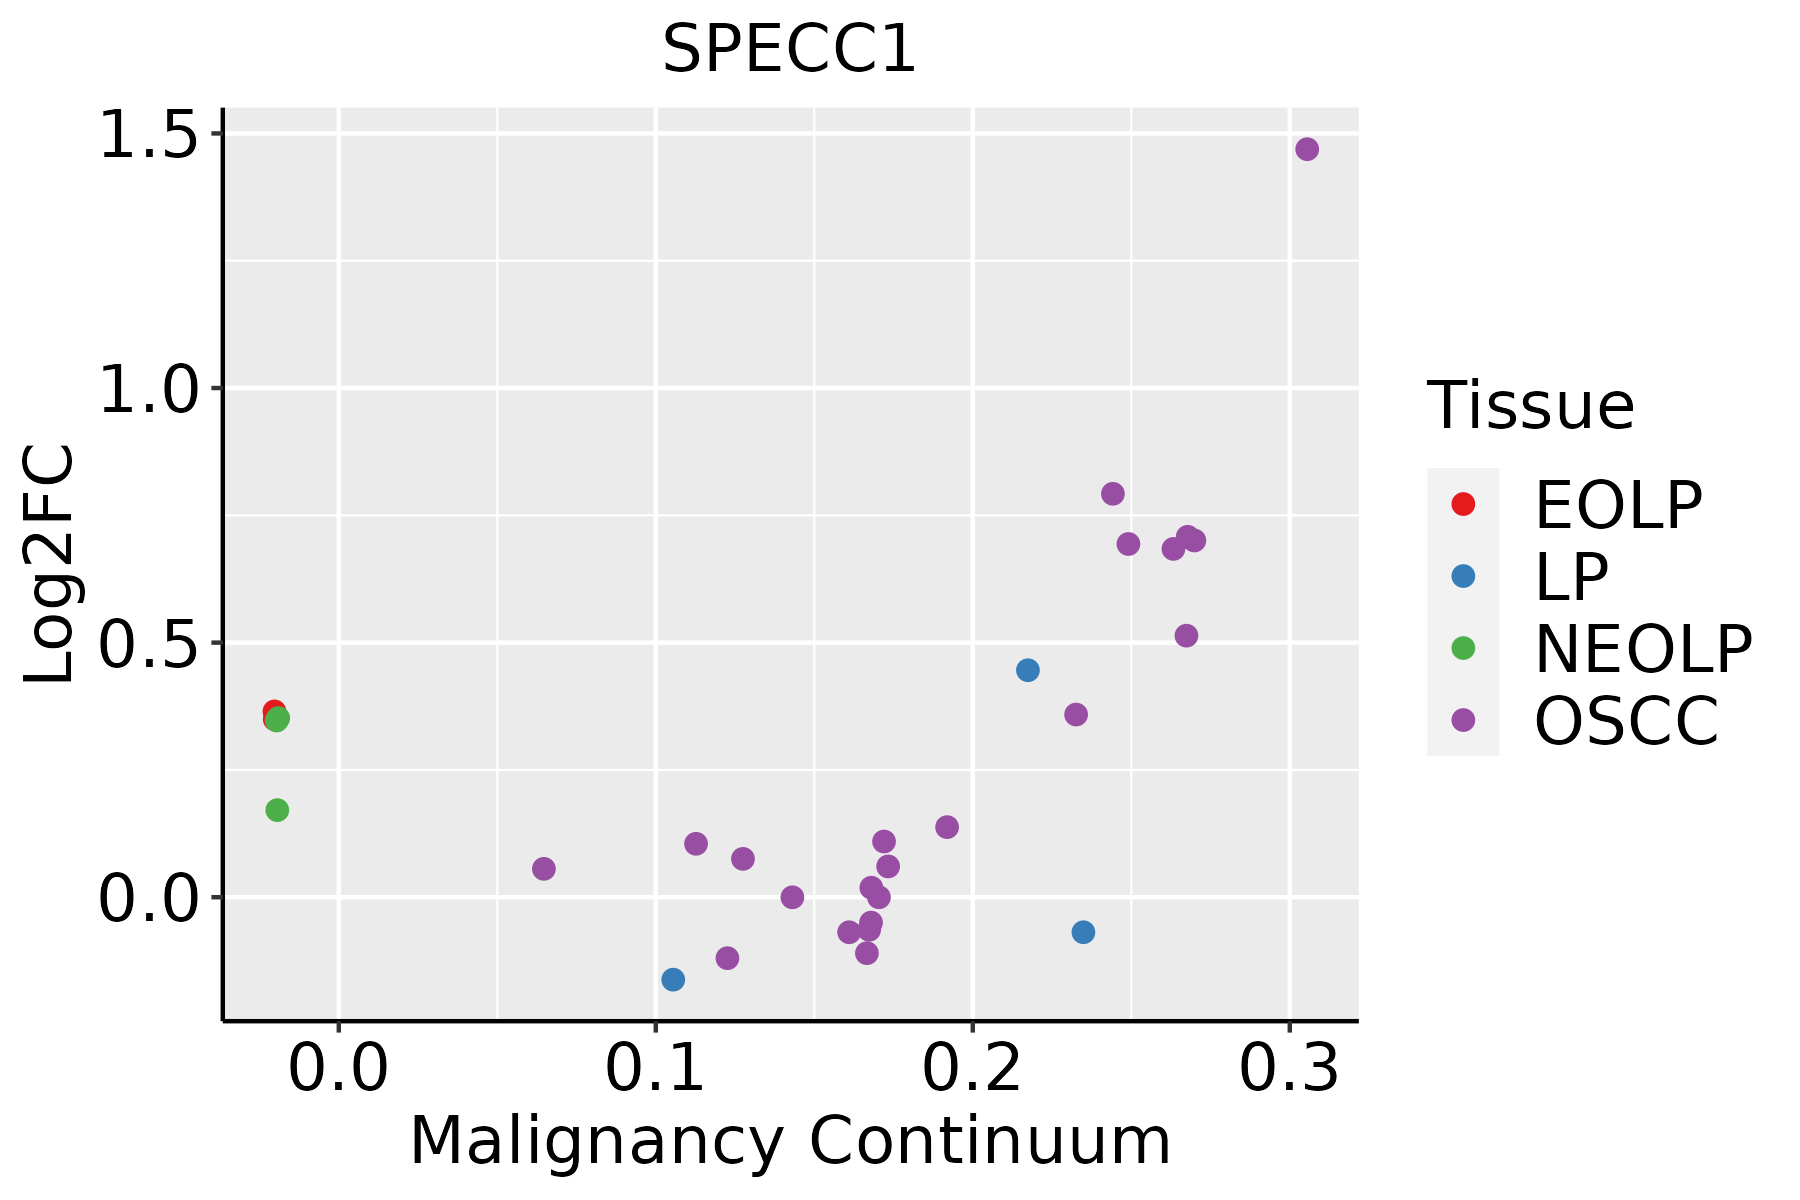 | EOLP: Erosive Oral lichen planus |
| LP: leukoplakia | ||
| NEOLP: Non-erosive oral lichen planus | ||
| OSCC: Oral squamous cell carcinoma | ||
| Thyroid | 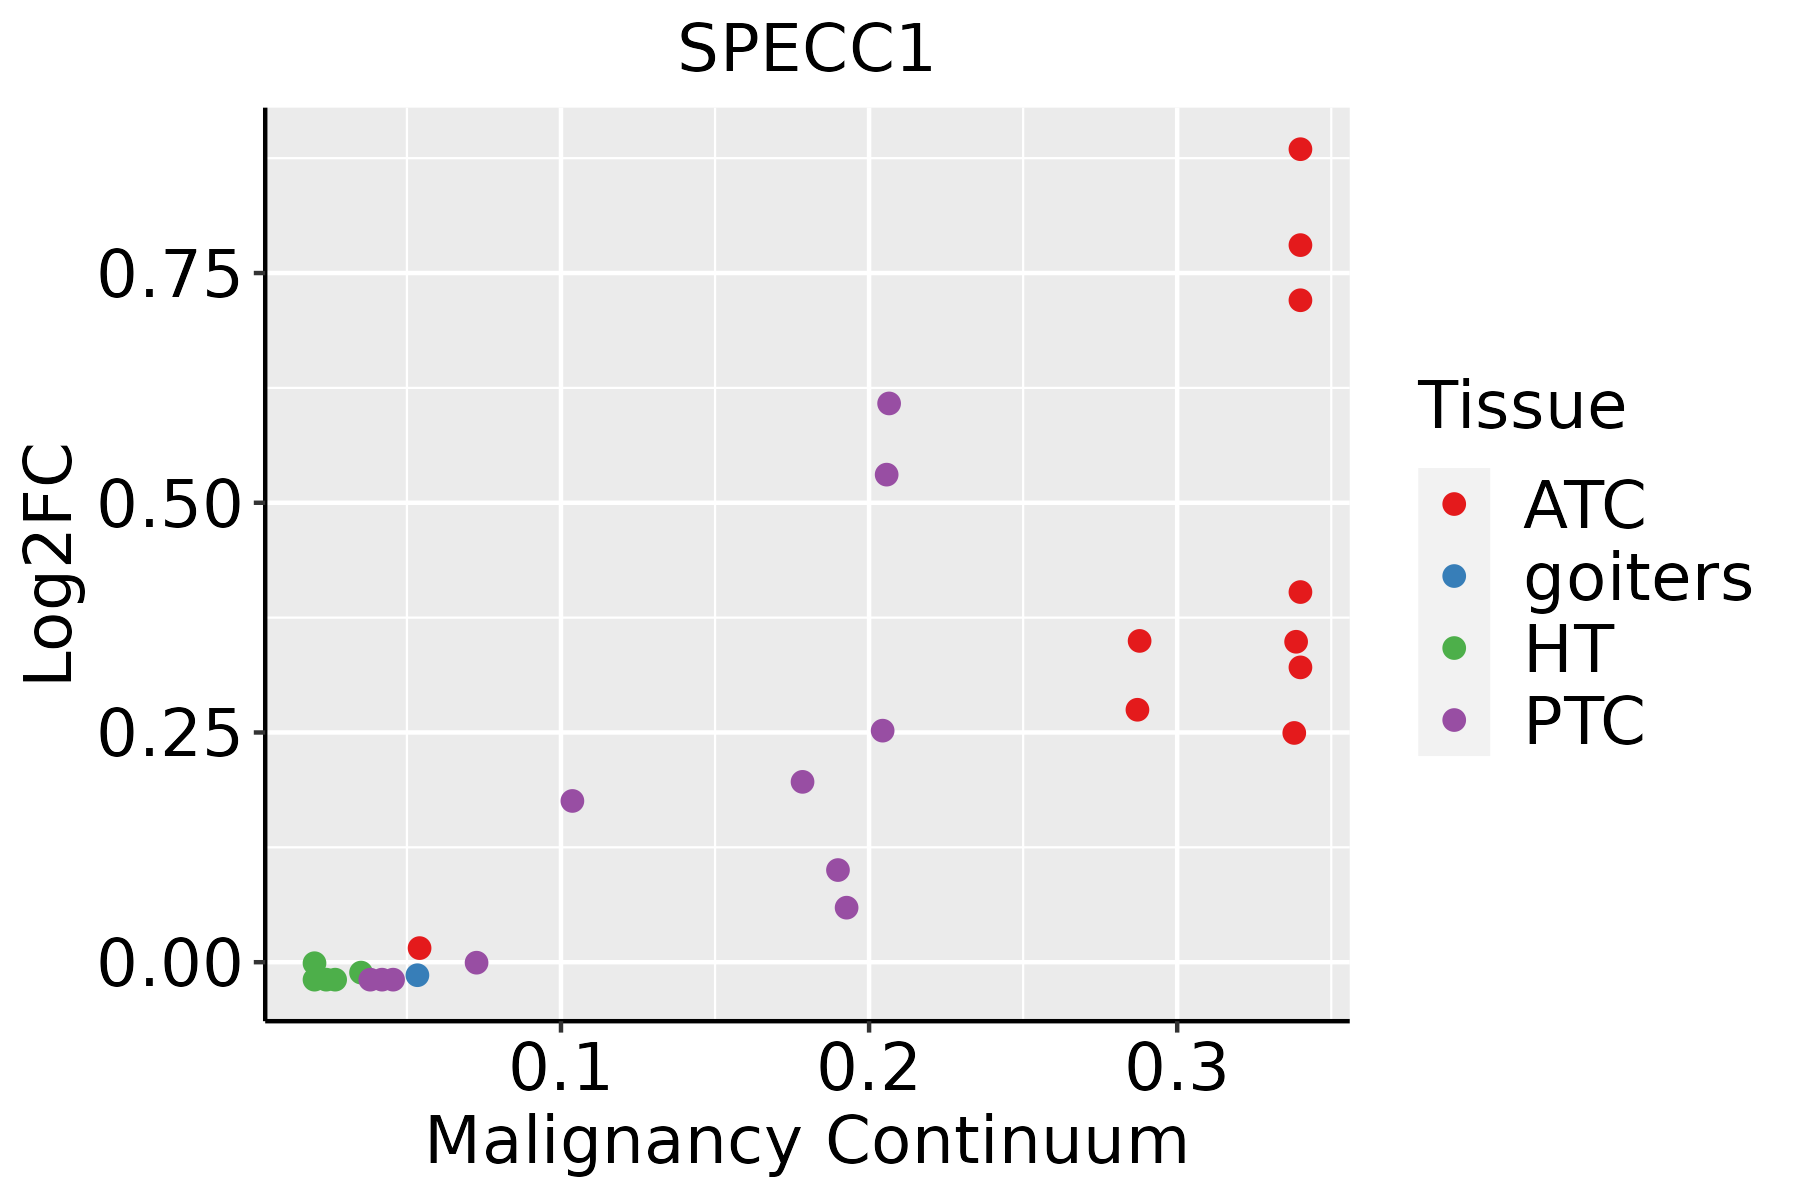 | ATC: Anaplastic thyroid cancer |
| HT: Hashimoto's thyroiditis | ||
| PTC: Papillary thyroid cancer |
| ∗log2FC in expression of this searched gene in stem-like cells from each diseased tissue sample relative to stem-like cells in normal samples in each tissue plotted against the malignancy continuum. Samples are colored based on if they are from different disease stage. |
Top |
Malignant transformation related pathway analysis |
| Find out the enriched GO biological processes and KEGG pathways involved in transition from healthy to precancer to cancer |
| Tissue | Disease Stage | Enriched GO biological Processes |
| Colorectum | AD |  |
| Colorectum | SER |  |
| Colorectum | MSS |  |
| Colorectum | MSI-H |  |
| Colorectum | FAP |  |
| ∗Top 15 enriched GO BP terms are showed in the bar plot of each disease state in each tissue. Each row represents a significant GO biological process which is colored according to the -log10(p.adjust). |
| Page: 1 2 3 4 5 6 7 8 9 |
| GO ID | Tissue | Disease Stage | Description | Gene Ratio | Bg Ratio | pvalue | p.adjust | Count |
| Page: 1 |
| Pathway ID | Tissue | Disease Stage | Description | Gene Ratio | Bg Ratio | pvalue | p.adjust | qvalue | Count |
| Page: 1 |
Top |
Cell-cell communication analysis |
| Identification of potential cell-cell interactions between two cell types and their ligand-receptor pairs for different disease states |
| Ligand | Receptor | LRpair | Pathway | Tissue | Disease Stage |
| Page: 1 |
Top |
Single-cell gene regulatory network inference analysis |
| Find out the significant the regulons (TFs) and the target genes of each regulon across cell types for different disease states |
| TF | Cell Type | Tissue | Disease Stage | Target Gene | RSS | Regulon Activity |
| ∗The dot plots of a searched regulon are shown for all cell subpopulations in each disease state of each tissue based on the regulon specific score inferred using pySCENIC and by calculating the average expression. |
| Page: 1 |
Top |
Somatic mutation of malignant transformation related genes |
| Annotation of somatic variants for genes involved in malignant transformation |
| Hugo Symbol | Variant Class | Variant Classification | dbSNP RS | HGVSc | HGVSp | HGVSp Short | SWISSPROT | BIOTYPE | SIFT | PolyPhen | Tumor Sample Barcode | Tissue | Histology | Sex | Age | Stage | Therapy Types | Drugs | Outcome |
| SPECC1 | SNV | Missense_Mutation | rs565518088 | c.3151N>A | p.Asp1051Asn | p.D1051N | Q5M775 | protein_coding | deleterious(0.03) | probably_damaging(0.996) | TCGA-5L-AAT1-01 | Breast | breast invasive carcinoma | Female | <65 | III/IV | Hormone Therapy | letrozol | SD |
| SPECC1 | SNV | Missense_Mutation | novel | c.1689N>T | p.Gln563His | p.Q563H | Q5M775 | protein_coding | deleterious(0) | probably_damaging(0.993) | TCGA-AN-A046-01 | Breast | breast invasive carcinoma | Female | >=65 | I/II | Unknown | Unknown | SD |
| SPECC1 | SNV | Missense_Mutation | rs771455889 | c.2285G>A | p.Arg762Gln | p.R762Q | Q5M775 | protein_coding | tolerated(0.05) | benign(0.279) | TCGA-AO-A03O-01 | Breast | breast invasive carcinoma | Female | >=65 | I/II | Chemotherapy | doxorubicin | SD |
| SPECC1 | SNV | Missense_Mutation | c.576G>C | p.Lys192Asn | p.K192N | Q5M775 | protein_coding | deleterious(0) | benign(0.269) | TCGA-AR-A0TU-01 | Breast | breast invasive carcinoma | Female | <65 | I/II | Unspecific | Doxorubicin | SD | |
| SPECC1 | SNV | Missense_Mutation | c.2893C>A | p.Arg965Ser | p.R965S | Q5M775 | protein_coding | deleterious(0) | probably_damaging(0.997) | TCGA-E9-A24A-01 | Breast | breast invasive carcinoma | Female | >=65 | I/II | Hormone Therapy | tamoxiphen | SD | |
| SPECC1 | SNV | Missense_Mutation | rs374473392 | c.431N>T | p.Thr144Met | p.T144M | Q5M775 | protein_coding | deleterious(0.02) | possibly_damaging(0.871) | TCGA-OK-A5Q2-01 | Breast | breast invasive carcinoma | Female | <65 | I/II | Unknown | Unknown | SD |
| SPECC1 | insertion | Frame_Shift_Ins | novel | c.575_576insCC | p.Lys192AsnfsTer10 | p.K192Nfs*10 | Q5M775 | protein_coding | TCGA-AR-A0TU-01 | Breast | breast invasive carcinoma | Female | <65 | I/II | Unspecific | Doxorubicin | SD | ||
| SPECC1 | insertion | Frame_Shift_Ins | novel | c.1145_1146insGGGC | p.Asn383GlyfsTer5 | p.N383Gfs*5 | Q5M775 | protein_coding | TCGA-BH-A0HL-01 | Breast | breast invasive carcinoma | Female | <65 | I/II | Chemotherapy | cyclophosphamide | SD | ||
| SPECC1 | insertion | Frame_Shift_Ins | novel | c.1146_1147insGCAAGTCACACTGGCGACAGCAGCTGCCC | p.Asn383AlafsTer36 | p.N383Afs*36 | Q5M775 | protein_coding | TCGA-BH-A0HL-01 | Breast | breast invasive carcinoma | Female | <65 | I/II | Chemotherapy | cyclophosphamide | SD | ||
| SPECC1 | deletion | Frame_Shift_Del | novel | c.1571delN | p.Glu524AspfsTer9 | p.E524Dfs*9 | Q5M775 | protein_coding | TCGA-D8-A27V-01 | Breast | breast invasive carcinoma | Female | <65 | I/II | Hormone Therapy | tamoxiphen | SD |
| Page: 1 2 3 4 5 6 7 8 9 10 11 12 13 14 15 16 17 18 |
Top |
Related drugs of malignant transformation related genes |
| Identification of chemicals and drugs interact with genes involved in malignant transfromation |
| (DGIdb 4.0) |
| Entrez ID | Symbol | Category | Interaction Types | Drug Claim Name | Drug Name | PMIDs |
| Page: 1 |

Copyright 2023-Present -The University of Texas Health Science Center at Houston |