
|
|||||
|
 | |
| |
| |
| |
| |
| |
|
Gene: SPDYE2 |
Gene summary for SPDYE2 |
| Gene information | Species | Human | Gene symbol | SPDYE2 | Gene ID | 441273 |
| Gene name | speedy/RINGO cell cycle regulator family member E2 | |
| Gene Alias | SPDYB2-L1 | |
| Cytomap | 7q22.1 | |
| Gene Type | protein-coding | GO ID | GO:0003674 | UniProtAcc | I6XC90 |
Top |
Malignant transformation analysis |
| Identification of the aberrant gene expression in precancerous and cancerous lesions by comparing the gene expression of stem-like cells in diseased tissues with normal stem cells |
| Entrez ID | Symbol | Replicates | Species | Organ | Tissue | Adj P-value | Log2FC | Malignancy |
| 441273 | SPDYE2 | RNA-P17T-P17T-2 | Human | Lung | IAC | 6.80e-05 | 7.19e-01 | 0.3371 |
| 441273 | SPDYE2 | RNA-P17T-P17T-4 | Human | Lung | IAC | 1.13e-06 | 7.54e-01 | 0.343 |
| 441273 | SPDYE2 | RNA-P17T-P17T-6 | Human | Lung | IAC | 4.28e-05 | 7.27e-01 | 0.3385 |
| 441273 | SPDYE2 | RNA-P17T-P17T-8 | Human | Lung | IAC | 1.77e-07 | 8.11e-01 | 0.3329 |
| 441273 | SPDYE2 | RNA-P6T2-P6T2-1 | Human | Lung | IAC | 4.91e-11 | 3.77e-01 | -0.0166 |
| 441273 | SPDYE2 | RNA-P6T2-P6T2-2 | Human | Lung | IAC | 5.22e-22 | 6.10e-01 | -0.0132 |
| 441273 | SPDYE2 | RNA-P6T2-P6T2-3 | Human | Lung | IAC | 2.03e-21 | 5.69e-01 | -0.013 |
| 441273 | SPDYE2 | RNA-P6T2-P6T2-4 | Human | Lung | IAC | 8.40e-12 | 4.25e-01 | -0.0121 |
| 441273 | SPDYE2 | RNA-P7T1-P7T1-1 | Human | Lung | AIS | 1.98e-07 | 5.98e-01 | -0.0961 |
| 441273 | SPDYE2 | RNA-P7T1-P7T1-2 | Human | Lung | AIS | 8.94e-07 | 4.92e-01 | -0.0876 |
| 441273 | SPDYE2 | RNA-P7T1-P7T1-3 | Human | Lung | AIS | 1.01e-04 | 5.34e-01 | -0.0822 |
| 441273 | SPDYE2 | RNA-P7T1-P7T1-4 | Human | Lung | AIS | 1.58e-07 | 5.46e-01 | -0.0809 |
| Page: 1 |
| Tissue | Expression Dynamics | Abbreviation |
| Lung | 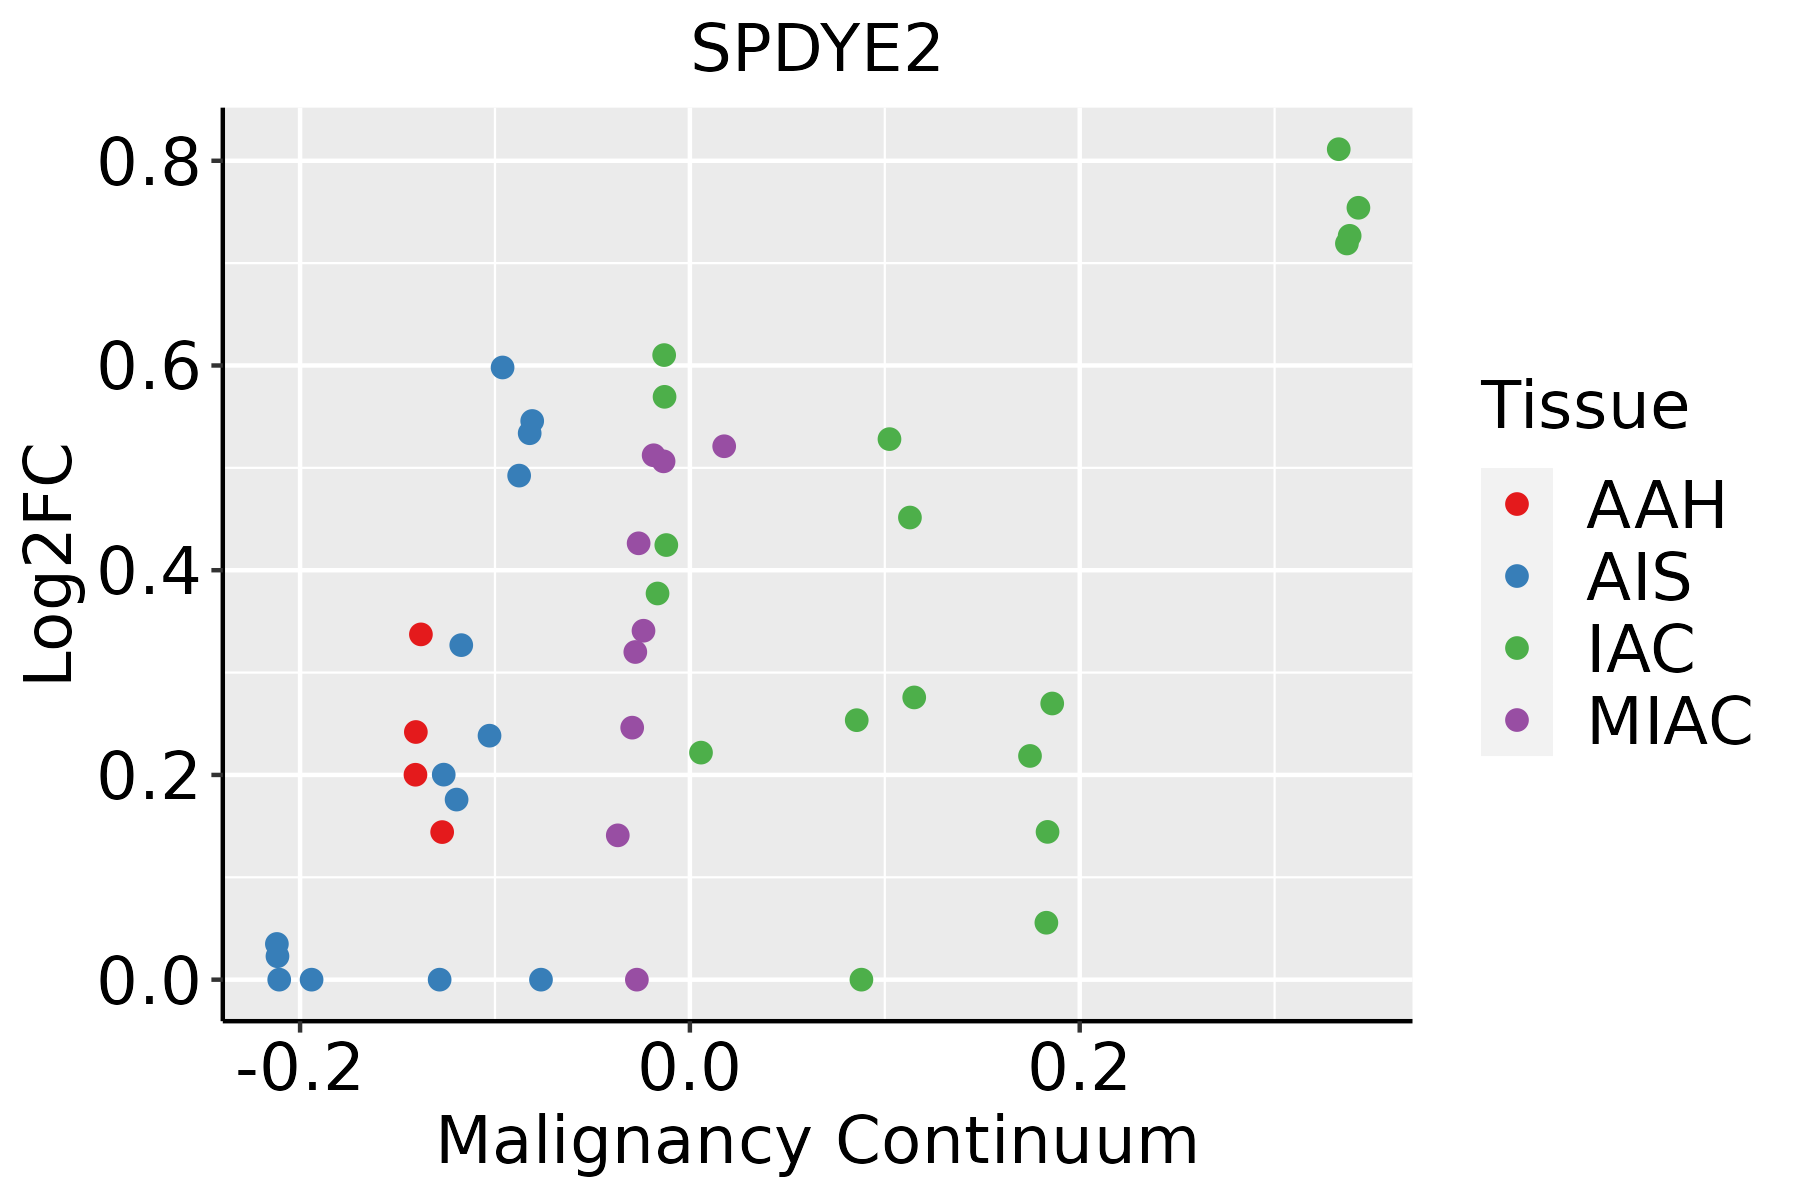 | AAH: Atypical adenomatous hyperplasia |
| AIS: Adenocarcinoma in situ | ||
| IAC: Invasive lung adenocarcinoma | ||
| MIA: Minimally invasive adenocarcinoma |
| ∗log2FC in expression of this searched gene in stem-like cells from each diseased tissue sample relative to stem-like cells in normal samples in each tissue plotted against the malignancy continuum. Samples are colored based on if they are from different disease stage. |
Top |
Malignant transformation related pathway analysis |
| Find out the enriched GO biological processes and KEGG pathways involved in transition from healthy to precancer to cancer |
| Tissue | Disease Stage | Enriched GO biological Processes |
| Colorectum | AD |  |
| Colorectum | SER |  |
| Colorectum | MSS |  |
| Colorectum | MSI-H |  |
| Colorectum | FAP |  |
| ∗Top 15 enriched GO BP terms are showed in the bar plot of each disease state in each tissue. Each row represents a significant GO biological process which is colored according to the -log10(p.adjust). |
| Page: 1 2 3 4 5 6 7 8 9 |
| GO ID | Tissue | Disease Stage | Description | Gene Ratio | Bg Ratio | pvalue | p.adjust | Count |
| Page: 1 |
| Pathway ID | Tissue | Disease Stage | Description | Gene Ratio | Bg Ratio | pvalue | p.adjust | qvalue | Count |
| Page: 1 |
Top |
Cell-cell communication analysis |
| Identification of potential cell-cell interactions between two cell types and their ligand-receptor pairs for different disease states |
| Ligand | Receptor | LRpair | Pathway | Tissue | Disease Stage |
| Page: 1 |
Top |
Single-cell gene regulatory network inference analysis |
| Find out the significant the regulons (TFs) and the target genes of each regulon across cell types for different disease states |
| TF | Cell Type | Tissue | Disease Stage | Target Gene | RSS | Regulon Activity |
| ∗The dot plots of a searched regulon are shown for all cell subpopulations in each disease state of each tissue based on the regulon specific score inferred using pySCENIC and by calculating the average expression. |
| Page: 1 |
Top |
Somatic mutation of malignant transformation related genes |
| Annotation of somatic variants for genes involved in malignant transformation |
| Hugo Symbol | Variant Class | Variant Classification | dbSNP RS | HGVSc | HGVSp | HGVSp Short | SWISSPROT | BIOTYPE | SIFT | PolyPhen | Tumor Sample Barcode | Tissue | Histology | Sex | Age | Stage | Therapy Types | Drugs | Outcome |
| SPDYE2 | SNV | Missense_Mutation | novel | c.236A>C | p.Glu79Ala | p.E79A | Q495Y8 | protein_coding | tolerated(0.12) | benign(0) | TCGA-BH-A0W4-01 | Breast | breast invasive carcinoma | Female | <65 | I/II | Unknown | Unknown | SD |
| SPDYE2 | SNV | Missense_Mutation | novel | c.271N>C | p.Glu91Gln | p.E91Q | Q495Y8 | protein_coding | tolerated(0.3) | probably_damaging(0.954) | TCGA-VS-A9UZ-01 | Cervix | cervical & endocervical cancer | Female | <65 | I/II | Unknown | Unknown | SD |
| SPDYE2 | SNV | Missense_Mutation | novel | c.244C>T | p.Pro82Ser | p.P82S | Q495Y8 | protein_coding | tolerated(0.55) | benign(0.167) | TCGA-AG-A002-01 | Colorectum | rectum adenocarcinoma | Male | <65 | I/II | Unknown | Unknown | SD |
| SPDYE2 | SNV | Missense_Mutation | novel | c.245N>T | p.Pro82Leu | p.P82L | Q495Y8 | protein_coding | tolerated(0.42) | benign(0.001) | TCGA-AP-A0LT-01 | Endometrium | uterine corpus endometrioid carcinoma | Female | <65 | I/II | Unknown | Unknown | SD |
| SPDYE2 | SNV | Missense_Mutation | novel | c.633N>A | p.Phe211Leu | p.F211L | Q495Y8 | protein_coding | deleterious(0.03) | benign(0.268) | TCGA-B5-A0JY-01 | Endometrium | uterine corpus endometrioid carcinoma | Female | <65 | III/IV | Chemotherapy | doxorubicin | SD |
| SPDYE2 | SNV | Missense_Mutation | novel | c.213N>C | p.Lys71Asn | p.K71N | Q495Y8 | protein_coding | deleterious(0.02) | probably_damaging(0.966) | TCGA-B5-A11R-01 | Endometrium | uterine corpus endometrioid carcinoma | Female | <65 | I/II | Chemotherapy | paclitaxel | SD |
| SPDYE2 | SNV | Missense_Mutation | novel | c.276N>T | p.Glu92Asp | p.E92D | Q495Y8 | protein_coding | tolerated(0.59) | probably_damaging(0.931) | TCGA-EO-A3B0-01 | Endometrium | uterine corpus endometrioid carcinoma | Female | <65 | III/IV | Unknown | Unknown | SD |
| SPDYE2 | SNV | Missense_Mutation | novel | c.180C>A | p.Ser60Arg | p.S60R | Q495Y8 | protein_coding | tolerated(0.17) | benign(0.001) | TCGA-55-6969-01 | Lung | lung adenocarcinoma | Male | <65 | I/II | Unknown | Unknown | SD |
| SPDYE2 | SNV | Missense_Mutation | novel | c.244C>A | p.Pro82Thr | p.P82T | Q495Y8 | protein_coding | tolerated(0.22) | benign(0.094) | TCGA-CN-A63U-01 | Oral cavity | head & neck squamous cell carcinoma | Male | <65 | I/II | Unknown | Unknown | SD |
| SPDYE2 | SNV | Missense_Mutation | novel | c.662N>T | p.Ser221Leu | p.S221L | Q495Y8 | protein_coding | deleterious(0.01) | probably_damaging(0.939) | TCGA-XK-AAIW-01 | Prostate | prostate adenocarcinoma | Male | >=65 | 9 | Unknown | Unknown | PD |
| Page: 1 |
Top |
Related drugs of malignant transformation related genes |
| Identification of chemicals and drugs interact with genes involved in malignant transfromation |
| (DGIdb 4.0) |
| Entrez ID | Symbol | Category | Interaction Types | Drug Claim Name | Drug Name | PMIDs |
| Page: 1 |

Copyright 2023-Present -The University of Texas Health Science Center at Houston |