
|
|||||
|
 | |
| |
| |
| |
| |
| |
|
Gene: SPDL1 |
Gene summary for SPDL1 |
| Gene information | Species | Human | Gene symbol | SPDL1 | Gene ID | 54908 |
| Gene name | spindle apparatus coiled-coil protein 1 | |
| Gene Alias | CCDC99 | |
| Cytomap | 5q35.1 | |
| Gene Type | protein-coding | GO ID | GO:0000070 | UniProtAcc | Q96EA4 |
Top |
Malignant transformation analysis |
| Identification of the aberrant gene expression in precancerous and cancerous lesions by comparing the gene expression of stem-like cells in diseased tissues with normal stem cells |
| Entrez ID | Symbol | Replicates | Species | Organ | Tissue | Adj P-value | Log2FC | Malignancy |
| 54908 | SPDL1 | LZE24T | Human | Esophagus | ESCC | 2.76e-07 | 2.27e-01 | 0.0596 |
| 54908 | SPDL1 | P2T-E | Human | Esophagus | ESCC | 6.15e-08 | 1.87e-01 | 0.1177 |
| 54908 | SPDL1 | P4T-E | Human | Esophagus | ESCC | 5.13e-05 | 1.17e-01 | 0.1323 |
| 54908 | SPDL1 | P5T-E | Human | Esophagus | ESCC | 4.58e-14 | 2.93e-01 | 0.1327 |
| 54908 | SPDL1 | P8T-E | Human | Esophagus | ESCC | 6.46e-08 | 1.14e-01 | 0.0889 |
| 54908 | SPDL1 | P9T-E | Human | Esophagus | ESCC | 1.43e-02 | 8.85e-02 | 0.1131 |
| 54908 | SPDL1 | P10T-E | Human | Esophagus | ESCC | 1.97e-10 | 1.98e-01 | 0.116 |
| 54908 | SPDL1 | P12T-E | Human | Esophagus | ESCC | 9.18e-05 | 1.58e-01 | 0.1122 |
| 54908 | SPDL1 | P15T-E | Human | Esophagus | ESCC | 7.31e-09 | 2.18e-01 | 0.1149 |
| 54908 | SPDL1 | P16T-E | Human | Esophagus | ESCC | 3.90e-03 | 1.19e-01 | 0.1153 |
| 54908 | SPDL1 | P17T-E | Human | Esophagus | ESCC | 2.91e-04 | 3.46e-01 | 0.1278 |
| 54908 | SPDL1 | P19T-E | Human | Esophagus | ESCC | 8.68e-04 | 3.33e-01 | 0.1662 |
| 54908 | SPDL1 | P22T-E | Human | Esophagus | ESCC | 1.43e-06 | 9.40e-02 | 0.1236 |
| 54908 | SPDL1 | P23T-E | Human | Esophagus | ESCC | 2.74e-04 | 1.58e-01 | 0.108 |
| 54908 | SPDL1 | P24T-E | Human | Esophagus | ESCC | 1.96e-05 | 1.70e-01 | 0.1287 |
| 54908 | SPDL1 | P26T-E | Human | Esophagus | ESCC | 4.97e-04 | 1.24e-01 | 0.1276 |
| 54908 | SPDL1 | P27T-E | Human | Esophagus | ESCC | 1.86e-11 | 1.15e-01 | 0.1055 |
| 54908 | SPDL1 | P28T-E | Human | Esophagus | ESCC | 2.29e-06 | 1.62e-01 | 0.1149 |
| 54908 | SPDL1 | P30T-E | Human | Esophagus | ESCC | 1.13e-04 | 2.43e-01 | 0.137 |
| 54908 | SPDL1 | P31T-E | Human | Esophagus | ESCC | 1.59e-03 | 1.66e-01 | 0.1251 |
| Page: 1 2 3 4 |
| Tissue | Expression Dynamics | Abbreviation |
| Esophagus | 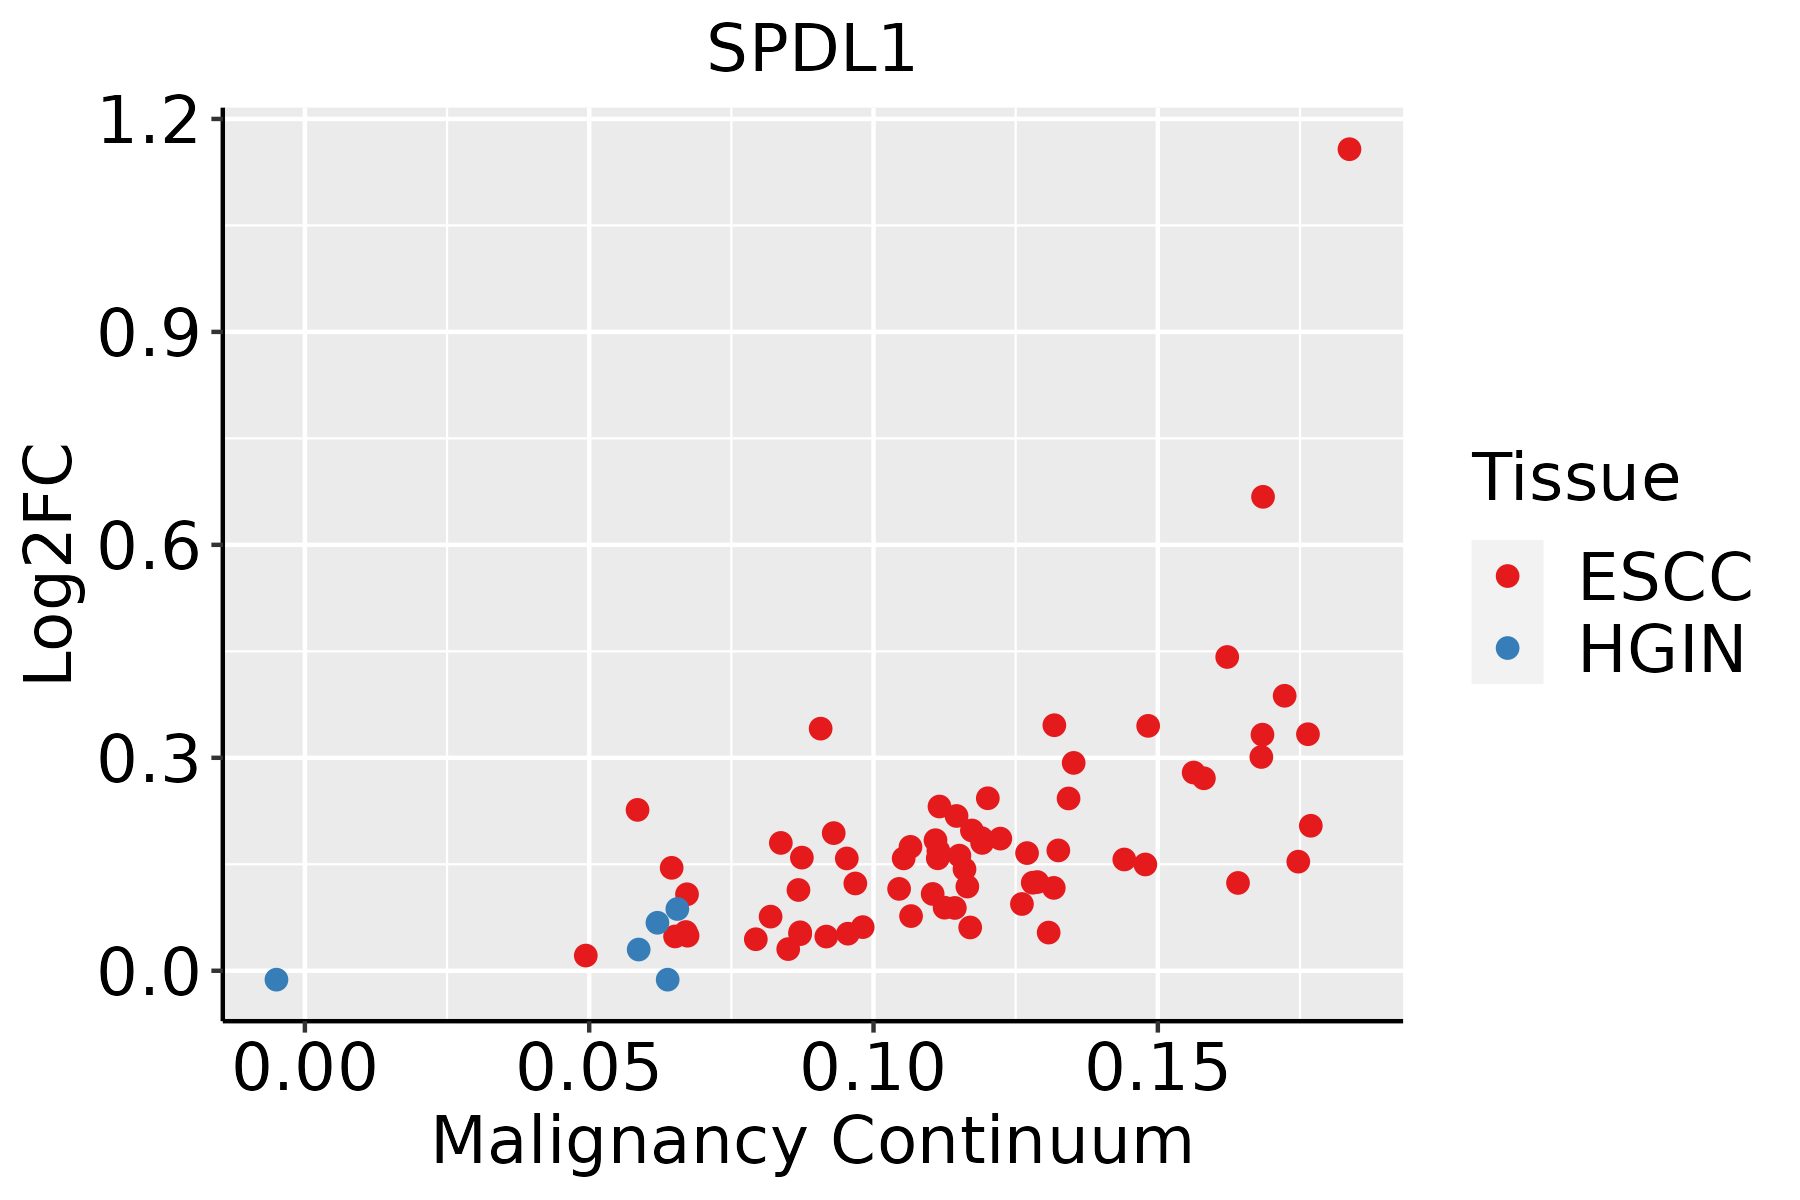 | ESCC: Esophageal squamous cell carcinoma |
| HGIN: High-grade intraepithelial neoplasias | ||
| LGIN: Low-grade intraepithelial neoplasias | ||
| Liver | 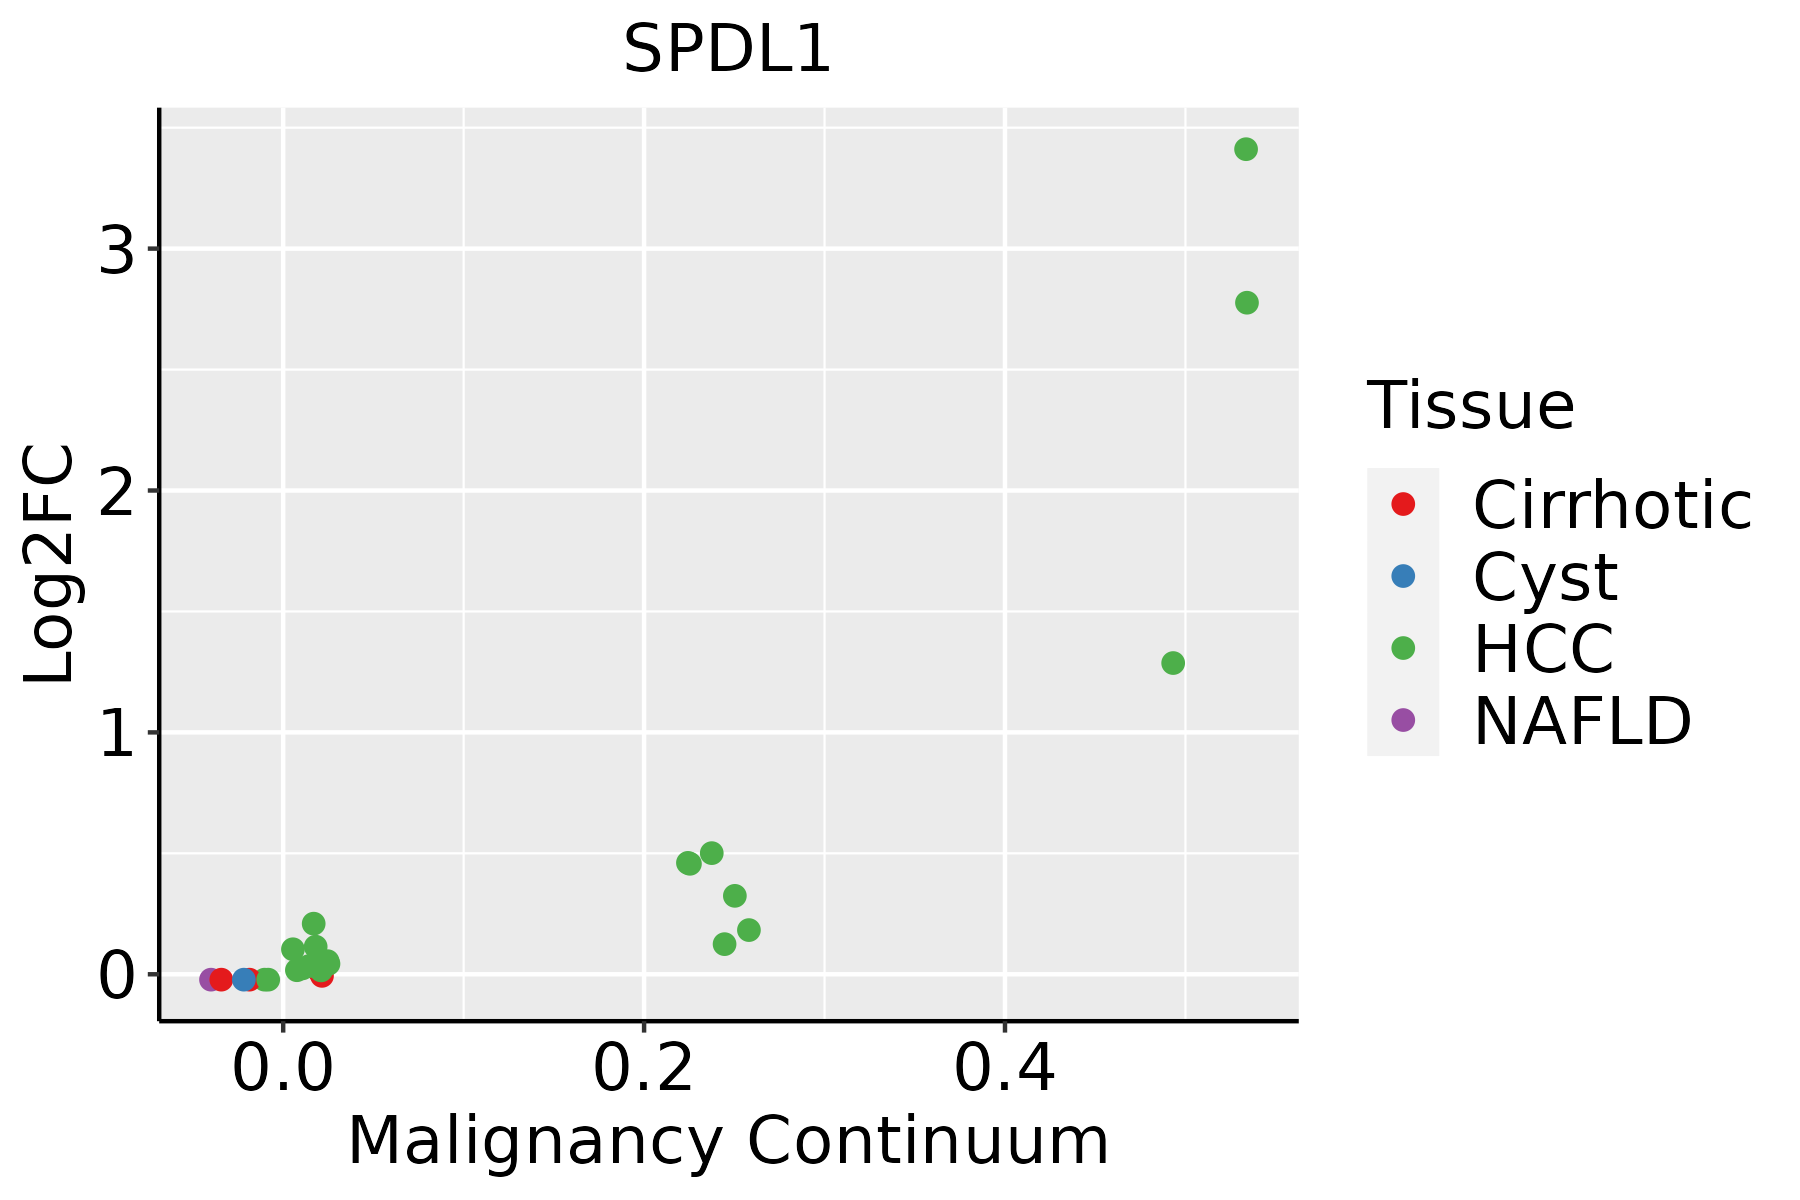 | HCC: Hepatocellular carcinoma |
| NAFLD: Non-alcoholic fatty liver disease | ||
| Oral Cavity | 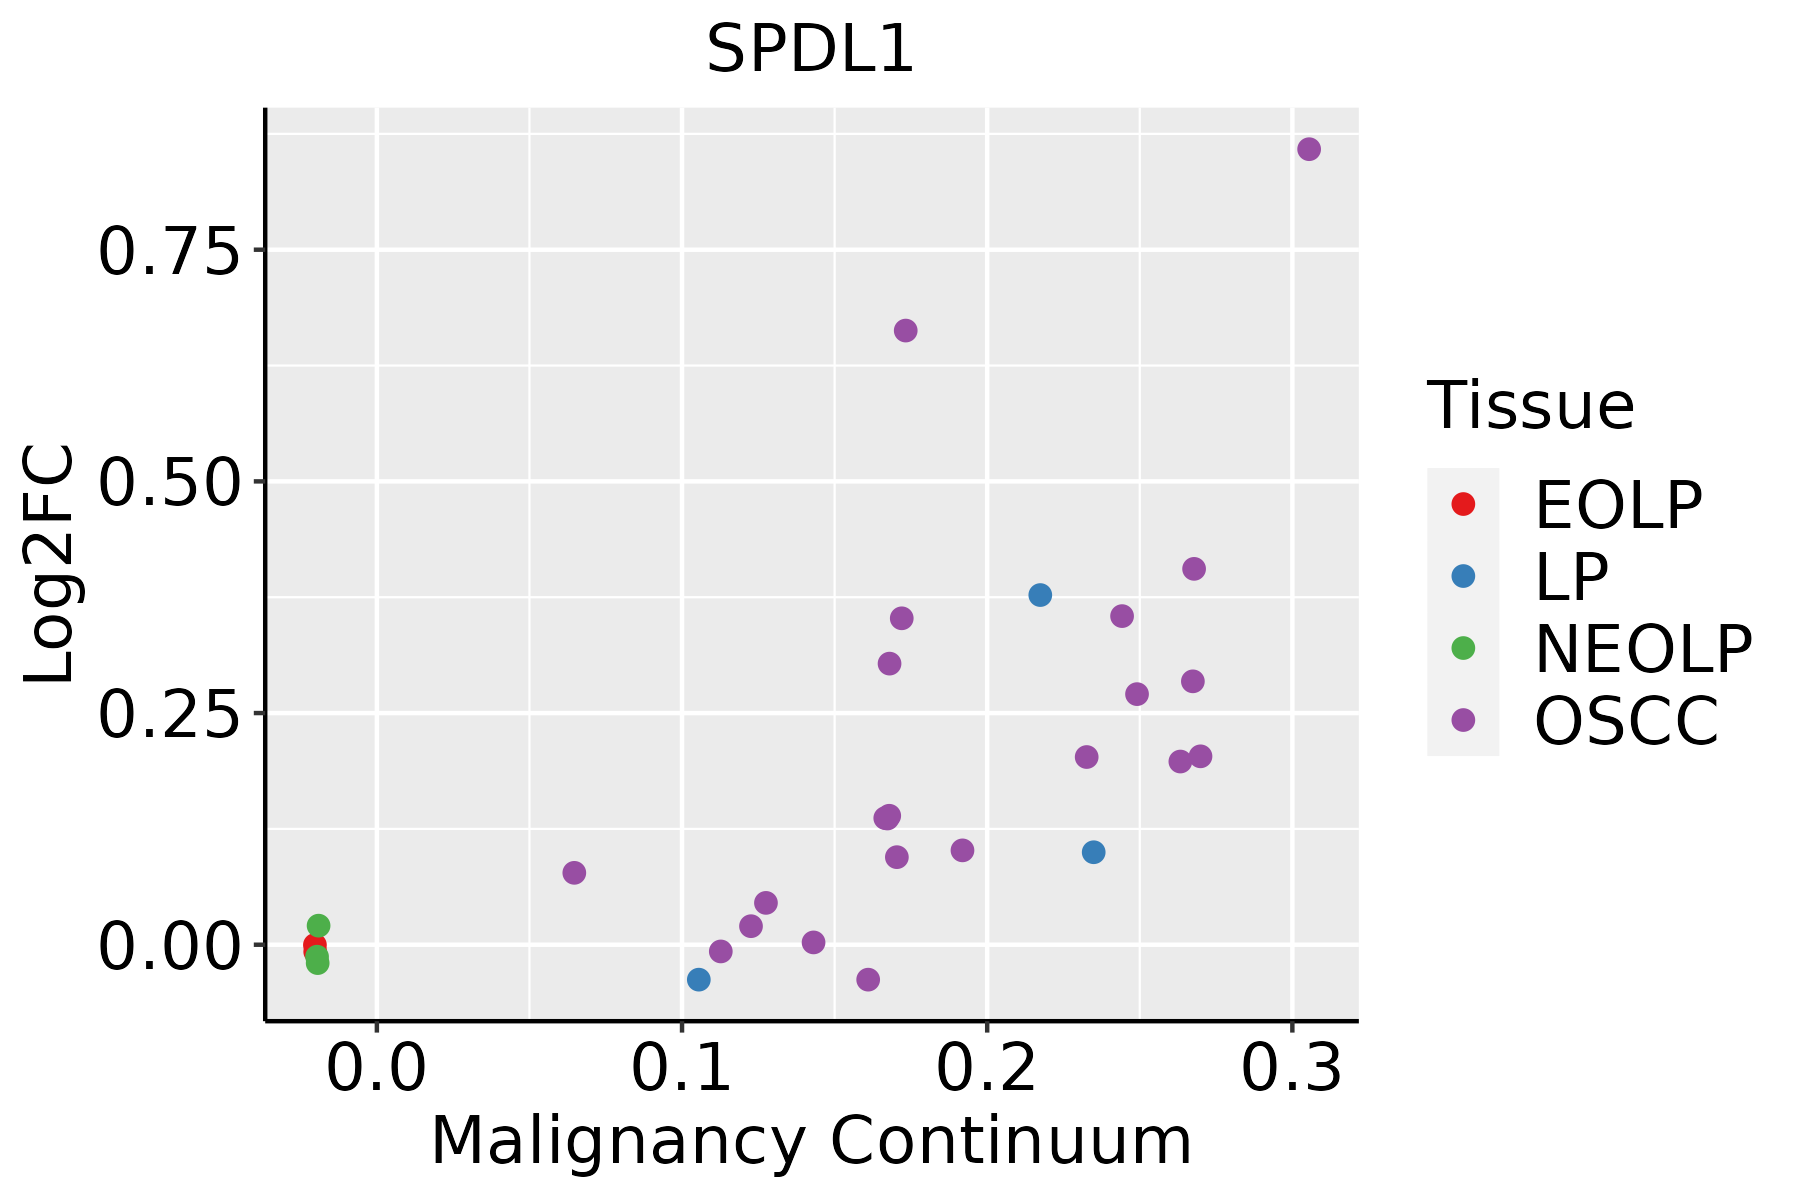 | EOLP: Erosive Oral lichen planus |
| LP: leukoplakia | ||
| NEOLP: Non-erosive oral lichen planus | ||
| OSCC: Oral squamous cell carcinoma | ||
| Thyroid | 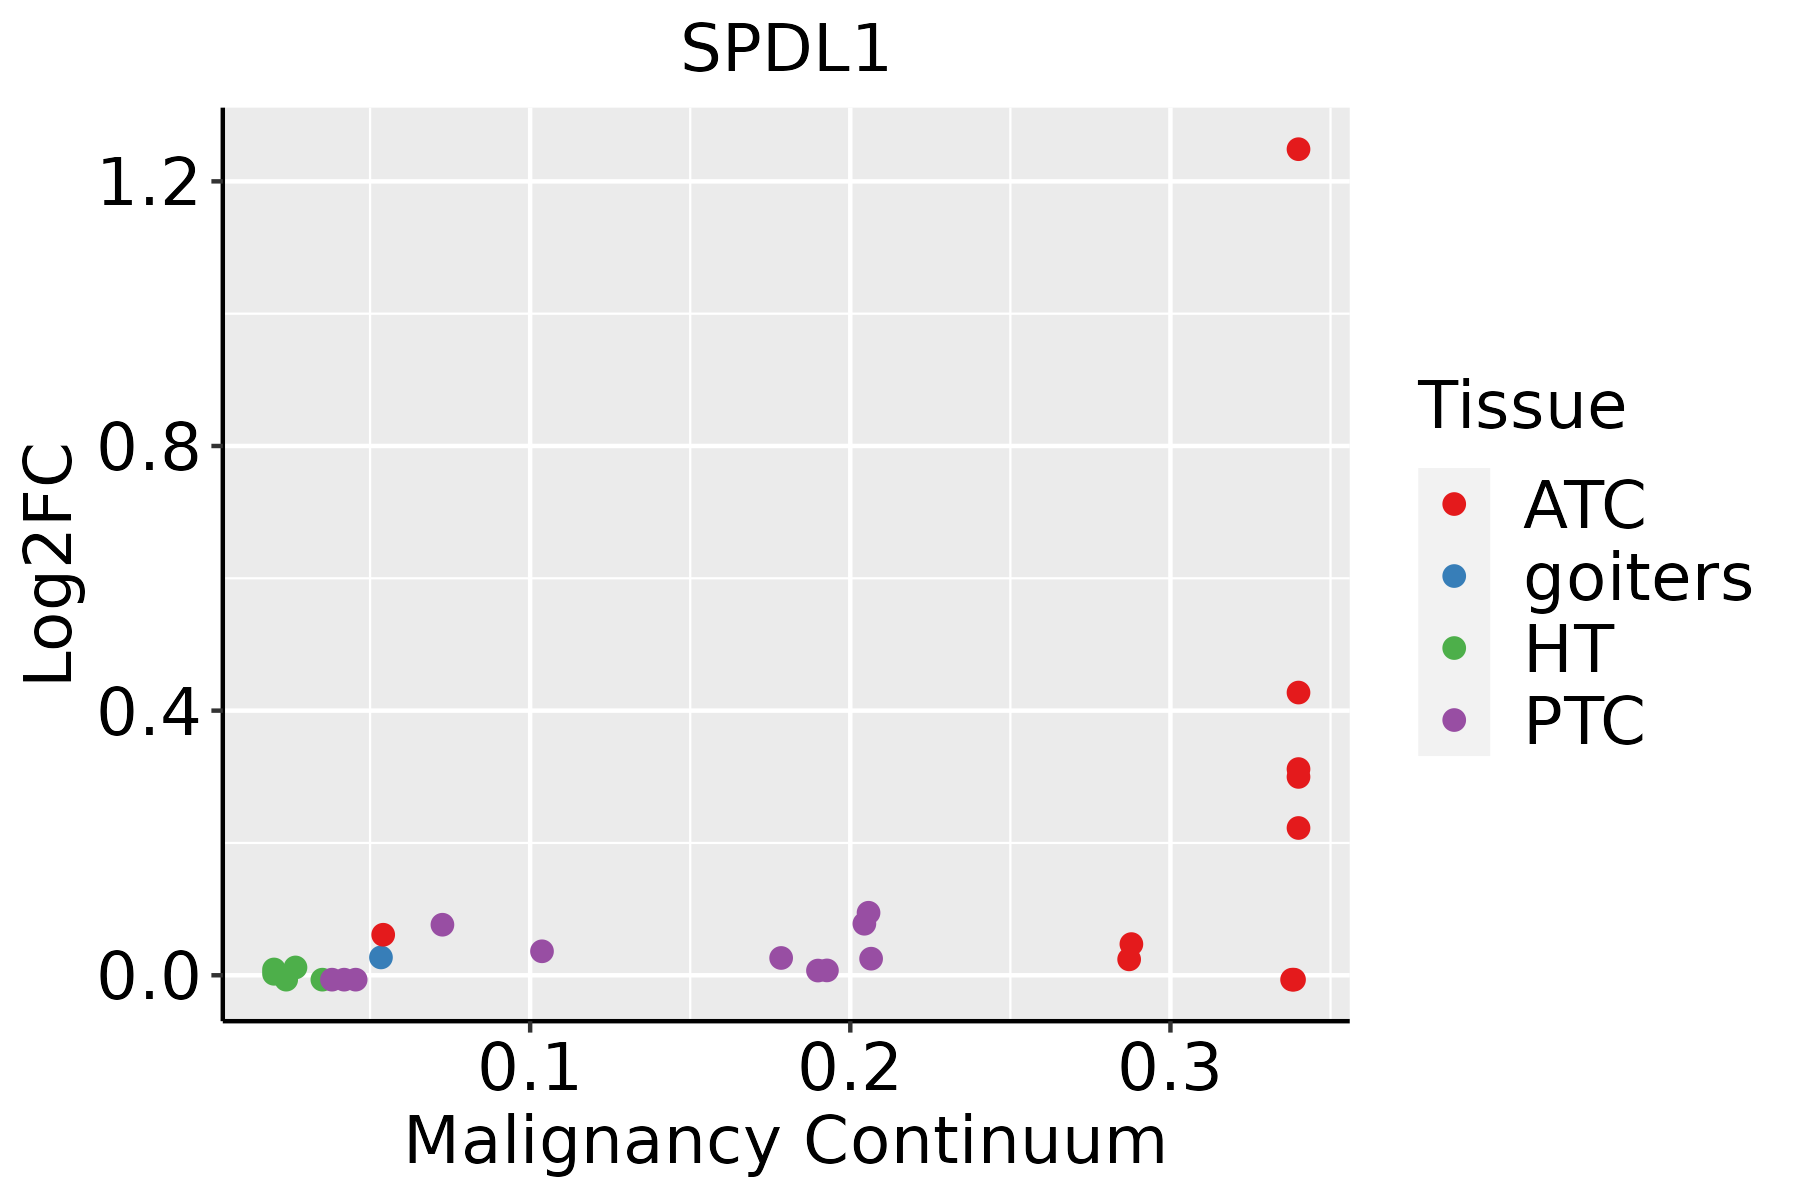 | ATC: Anaplastic thyroid cancer |
| HT: Hashimoto's thyroiditis | ||
| PTC: Papillary thyroid cancer |
| ∗log2FC in expression of this searched gene in stem-like cells from each diseased tissue sample relative to stem-like cells in normal samples in each tissue plotted against the malignancy continuum. Samples are colored based on if they are from different disease stage. |
Top |
Malignant transformation related pathway analysis |
| Find out the enriched GO biological processes and KEGG pathways involved in transition from healthy to precancer to cancer |
| Tissue | Disease Stage | Enriched GO biological Processes |
| Colorectum | AD |  |
| Colorectum | SER |  |
| Colorectum | MSS |  |
| Colorectum | MSI-H |  |
| Colorectum | FAP |  |
| ∗Top 15 enriched GO BP terms are showed in the bar plot of each disease state in each tissue. Each row represents a significant GO biological process which is colored according to the -log10(p.adjust). |
| Page: 1 2 3 4 5 6 7 8 9 |
| GO ID | Tissue | Disease Stage | Description | Gene Ratio | Bg Ratio | pvalue | p.adjust | Count |
| GO:014001414 | Esophagus | ESCC | mitotic nuclear division | 218/8552 | 287/18723 | 6.17e-26 | 1.78e-23 | 218 |
| GO:005165617 | Esophagus | ESCC | establishment of organelle localization | 273/8552 | 390/18723 | 9.13e-23 | 1.81e-20 | 273 |
| GO:000007011 | Esophagus | ESCC | mitotic sister chromatid segregation | 138/8552 | 168/18723 | 1.37e-22 | 2.63e-20 | 138 |
| GO:00008194 | Esophagus | ESCC | sister chromatid segregation | 157/8552 | 202/18723 | 8.41e-21 | 1.33e-18 | 157 |
| GO:003304416 | Esophagus | ESCC | regulation of chromosome organization | 145/8552 | 187/18723 | 3.80e-19 | 4.31e-17 | 145 |
| GO:000705911 | Esophagus | ESCC | chromosome segregation | 238/8552 | 346/18723 | 1.72e-18 | 1.82e-16 | 238 |
| GO:004477216 | Esophagus | ESCC | mitotic cell cycle phase transition | 281/8552 | 424/18723 | 4.63e-18 | 4.45e-16 | 281 |
| GO:190285015 | Esophagus | ESCC | microtubule cytoskeleton organization involved in mitosis | 116/8552 | 147/18723 | 1.25e-16 | 9.91e-15 | 116 |
| GO:000734615 | Esophagus | ESCC | regulation of mitotic cell cycle | 293/8552 | 457/18723 | 8.00e-16 | 5.64e-14 | 293 |
| GO:005131011 | Esophagus | ESCC | metaphase plate congression | 58/8552 | 65/18723 | 1.81e-13 | 8.63e-12 | 58 |
| GO:000708011 | Esophagus | ESCC | mitotic metaphase plate congression | 47/8552 | 50/18723 | 3.15e-13 | 1.47e-11 | 47 |
| GO:00482853 | Esophagus | ESCC | organelle fission | 301/8552 | 488/18723 | 4.64e-13 | 2.12e-11 | 301 |
| GO:00988133 | Esophagus | ESCC | nuclear chromosome segregation | 187/8552 | 281/18723 | 1.00e-12 | 4.36e-11 | 187 |
| GO:005130311 | Esophagus | ESCC | establishment of chromosome localization | 67/8552 | 80/18723 | 1.92e-12 | 8.09e-11 | 67 |
| GO:005000011 | Esophagus | ESCC | chromosome localization | 68/8552 | 82/18723 | 3.37e-12 | 1.32e-10 | 68 |
| GO:00002802 | Esophagus | ESCC | nuclear division | 270/8552 | 439/18723 | 1.17e-11 | 4.24e-10 | 270 |
| GO:190198713 | Esophagus | ESCC | regulation of cell cycle phase transition | 242/8552 | 390/18723 | 3.86e-11 | 1.26e-09 | 242 |
| GO:190199013 | Esophagus | ESCC | regulation of mitotic cell cycle phase transition | 191/8552 | 299/18723 | 1.35e-10 | 3.94e-09 | 191 |
| GO:00457865 | Esophagus | ESCC | negative regulation of cell cycle | 236/8552 | 385/18723 | 3.62e-10 | 9.93e-09 | 236 |
| GO:00000754 | Esophagus | ESCC | cell cycle checkpoint | 117/8552 | 169/18723 | 4.47e-10 | 1.17e-08 | 117 |
| Page: 1 2 3 4 5 6 7 8 9 10 11 12 13 14 |
| Pathway ID | Tissue | Disease Stage | Description | Gene Ratio | Bg Ratio | pvalue | p.adjust | qvalue | Count |
| Page: 1 |
Top |
Cell-cell communication analysis |
| Identification of potential cell-cell interactions between two cell types and their ligand-receptor pairs for different disease states |
| Ligand | Receptor | LRpair | Pathway | Tissue | Disease Stage |
| Page: 1 |
Top |
Single-cell gene regulatory network inference analysis |
| Find out the significant the regulons (TFs) and the target genes of each regulon across cell types for different disease states |
| TF | Cell Type | Tissue | Disease Stage | Target Gene | RSS | Regulon Activity |
| ∗The dot plots of a searched regulon are shown for all cell subpopulations in each disease state of each tissue based on the regulon specific score inferred using pySCENIC and by calculating the average expression. |
| Page: 1 |
Top |
Somatic mutation of malignant transformation related genes |
| Annotation of somatic variants for genes involved in malignant transformation |
| Hugo Symbol | Variant Class | Variant Classification | dbSNP RS | HGVSc | HGVSp | HGVSp Short | SWISSPROT | BIOTYPE | SIFT | PolyPhen | Tumor Sample Barcode | Tissue | Histology | Sex | Age | Stage | Therapy Types | Drugs | Outcome |
| SPDL1 | SNV | Missense_Mutation | c.272N>A | p.Leu91Gln | p.L91Q | Q96EA4 | protein_coding | deleterious(0.01) | probably_damaging(0.999) | TCGA-AR-A250-01 | Breast | breast invasive carcinoma | Female | <65 | I/II | Chemotherapy | doxorubicin | SD | |
| SPDL1 | SNV | Missense_Mutation | rs750996171 | c.1420N>A | p.Gly474Arg | p.G474R | Q96EA4 | protein_coding | tolerated(0.5) | benign(0.003) | TCGA-Z7-A8R5-01 | Breast | breast invasive carcinoma | Female | <65 | III/IV | Chemotherapy | adriamycin | PD |
| SPDL1 | SNV | Missense_Mutation | c.496C>G | p.Leu166Val | p.L166V | Q96EA4 | protein_coding | tolerated(0.19) | possibly_damaging(0.853) | TCGA-IR-A3LA-01 | Cervix | cervical & endocervical cancer | Female | <65 | I/II | Chemotherapy | cisplatin | CR | |
| SPDL1 | SNV | Missense_Mutation | rs774516530 | c.997N>G | p.Leu333Val | p.L333V | Q96EA4 | protein_coding | deleterious(0) | probably_damaging(0.997) | TCGA-IR-A3LH-01 | Cervix | cervical & endocervical cancer | Female | <65 | I/II | Chemotherapy | cisplatin | CR |
| SPDL1 | SNV | Missense_Mutation | rs759699420 | c.1333N>A | p.Glu445Lys | p.E445K | Q96EA4 | protein_coding | tolerated(1) | benign(0.003) | TCGA-IR-A3LK-01 | Cervix | cervical & endocervical cancer | Female | >=65 | I/II | Chemotherapy | cisplatin | PD |
| SPDL1 | SNV | Missense_Mutation | rs143182474 | c.1564G>A | p.Val522Met | p.V522M | Q96EA4 | protein_coding | tolerated(0.6) | benign(0) | TCGA-AA-3837-01 | Colorectum | colon adenocarcinoma | Male | >=65 | I/II | Unknown | Unknown | SD |
| SPDL1 | SNV | Missense_Mutation | rs201660793 | c.689N>A | p.Arg230His | p.R230H | Q96EA4 | protein_coding | tolerated(0.05) | benign(0.191) | TCGA-AA-3947-01 | Colorectum | colon adenocarcinoma | Female | <65 | I/II | Unknown | Unknown | SD |
| SPDL1 | SNV | Missense_Mutation | rs373642839 | c.212N>A | p.Arg71Gln | p.R71Q | Q96EA4 | protein_coding | deleterious(0) | probably_damaging(0.997) | TCGA-AA-A00N-01 | Colorectum | colon adenocarcinoma | Male | >=65 | I/II | Unknown | Unknown | PD |
| SPDL1 | SNV | Missense_Mutation | rs747766603 | c.1436N>A | p.Arg479Gln | p.R479Q | Q96EA4 | protein_coding | tolerated(0.7) | benign(0.199) | TCGA-AA-A00N-01 | Colorectum | colon adenocarcinoma | Male | >=65 | I/II | Unknown | Unknown | PD |
| SPDL1 | SNV | Missense_Mutation | c.1175N>G | p.Gln392Arg | p.Q392R | Q96EA4 | protein_coding | deleterious(0) | probably_damaging(0.975) | TCGA-AA-A01P-01 | Colorectum | colon adenocarcinoma | Female | >=65 | III/IV | Unknown | Unknown | PD |
| Page: 1 2 3 4 5 6 7 |
Top |
Related drugs of malignant transformation related genes |
| Identification of chemicals and drugs interact with genes involved in malignant transfromation |
| (DGIdb 4.0) |
| Entrez ID | Symbol | Category | Interaction Types | Drug Claim Name | Drug Name | PMIDs |
| Page: 1 |

Copyright 2023-Present -The University of Texas Health Science Center at Houston |