
|
|||||
|
 | |
| |
| |
| |
| |
| |
|
Gene: SPDEF |
Gene summary for SPDEF |
| Gene information | Species | Human | Gene symbol | SPDEF | Gene ID | 25803 |
| Gene name | SAM pointed domain containing ETS transcription factor | |
| Gene Alias | PDEF | |
| Cytomap | 6p21.31 | |
| Gene Type | protein-coding | GO ID | GO:0000122 | UniProtAcc | O95238 |
Top |
Malignant transformation analysis |
| Identification of the aberrant gene expression in precancerous and cancerous lesions by comparing the gene expression of stem-like cells in diseased tissues with normal stem cells |
| Entrez ID | Symbol | Replicates | Species | Organ | Tissue | Adj P-value | Log2FC | Malignancy |
| 25803 | SPDEF | GSM4909282 | Human | Breast | IDC | 8.30e-08 | -2.24e-01 | -0.0288 |
| 25803 | SPDEF | GSM4909285 | Human | Breast | IDC | 8.46e-03 | -1.97e-01 | 0.21 |
| 25803 | SPDEF | GSM4909287 | Human | Breast | IDC | 2.83e-03 | -1.97e-01 | 0.2057 |
| 25803 | SPDEF | GSM4909290 | Human | Breast | IDC | 6.21e-22 | 6.66e-01 | 0.2096 |
| 25803 | SPDEF | GSM4909291 | Human | Breast | IDC | 6.74e-16 | 6.19e-01 | 0.1753 |
| 25803 | SPDEF | GSM4909293 | Human | Breast | IDC | 9.57e-27 | 5.48e-01 | 0.1581 |
| 25803 | SPDEF | GSM4909294 | Human | Breast | IDC | 3.43e-19 | 6.76e-01 | 0.2022 |
| 25803 | SPDEF | GSM4909297 | Human | Breast | IDC | 6.54e-04 | 3.04e-01 | 0.1517 |
| 25803 | SPDEF | GSM4909298 | Human | Breast | IDC | 7.98e-17 | 4.59e-01 | 0.1551 |
| 25803 | SPDEF | GSM4909302 | Human | Breast | IDC | 6.67e-04 | 3.23e-01 | 0.1545 |
| 25803 | SPDEF | GSM4909303 | Human | Breast | IDC | 4.19e-05 | 5.19e-01 | 0.0438 |
| 25803 | SPDEF | GSM4909304 | Human | Breast | IDC | 1.87e-24 | 5.28e-01 | 0.1636 |
| 25803 | SPDEF | GSM4909306 | Human | Breast | IDC | 7.09e-12 | 4.63e-01 | 0.1564 |
| 25803 | SPDEF | GSM4909308 | Human | Breast | IDC | 4.03e-02 | 2.54e-01 | 0.158 |
| 25803 | SPDEF | GSM4909311 | Human | Breast | IDC | 5.95e-10 | 8.94e-02 | 0.1534 |
| 25803 | SPDEF | GSM4909312 | Human | Breast | IDC | 1.55e-25 | 7.19e-01 | 0.1552 |
| 25803 | SPDEF | GSM4909315 | Human | Breast | IDC | 2.58e-05 | 3.79e-01 | 0.21 |
| 25803 | SPDEF | GSM4909317 | Human | Breast | IDC | 1.85e-19 | 6.05e-01 | 0.1355 |
| 25803 | SPDEF | GSM4909318 | Human | Breast | IDC | 3.41e-03 | 5.39e-01 | 0.2031 |
| 25803 | SPDEF | GSM4909319 | Human | Breast | IDC | 2.15e-12 | 1.20e-01 | 0.1563 |
| Page: 1 2 |
| Tissue | Expression Dynamics | Abbreviation |
| Breast |  | IDC: Invasive ductal carcinoma |
| DCIS: Ductal carcinoma in situ | ||
| Precancer(BRCA1-mut): Precancerous lesion from BRCA1 mutation carriers | ||
| Colorectum (GSE201348) |  | FAP: Familial adenomatous polyposis |
| CRC: Colorectal cancer | ||
| Colorectum (HTA11) |  | AD: Adenomas |
| SER: Sessile serrated lesions | ||
| MSI-H: Microsatellite-high colorectal cancer | ||
| MSS: Microsatellite stable colorectal cancer | ||
| Esophagus |  | ESCC: Esophageal squamous cell carcinoma |
| HGIN: High-grade intraepithelial neoplasias | ||
| LGIN: Low-grade intraepithelial neoplasias | ||
| Prostate | 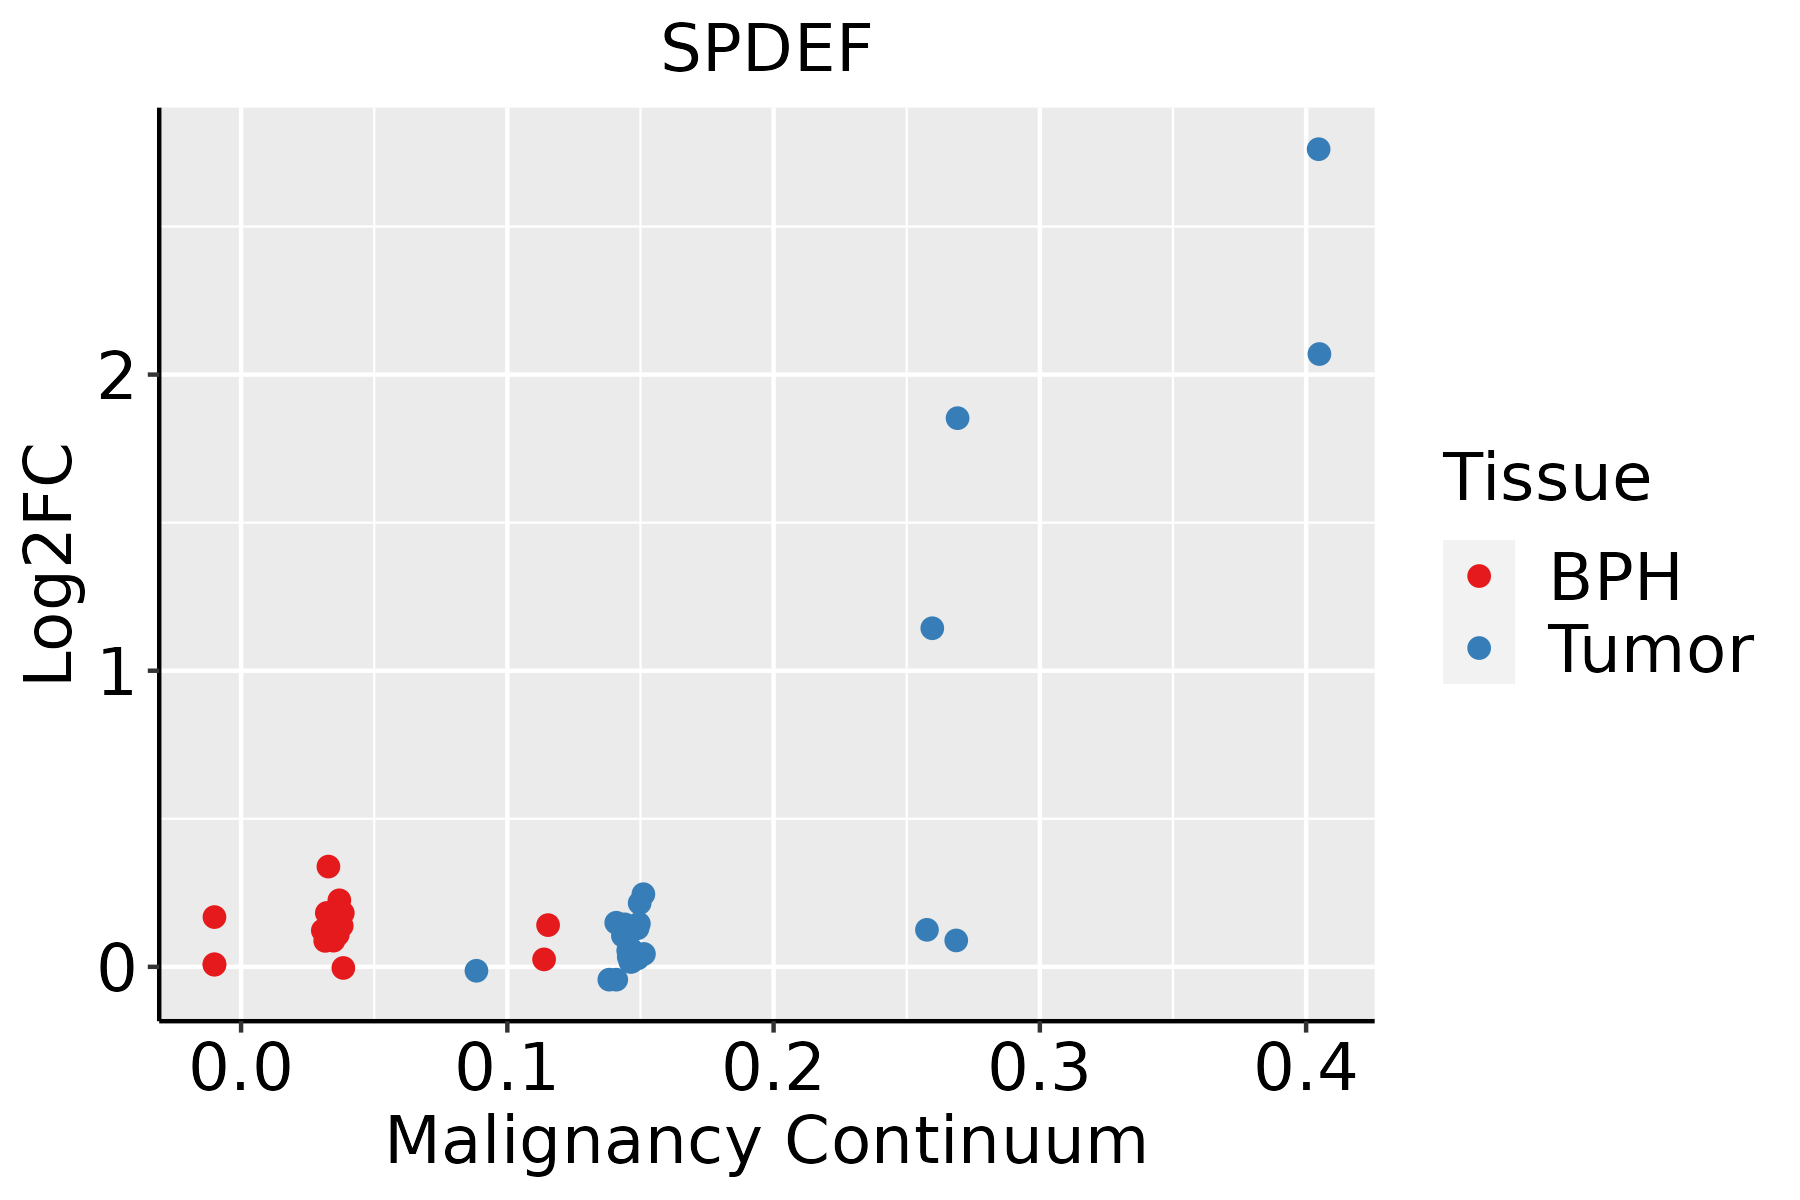 | BPH: Benign Prostatic Hyperplasia |
| ∗log2FC in expression of this searched gene in stem-like cells from each diseased tissue sample relative to stem-like cells in normal samples in each tissue plotted against the malignancy continuum. Samples are colored based on if they are from different disease stage. |
Top |
Malignant transformation related pathway analysis |
| Find out the enriched GO biological processes and KEGG pathways involved in transition from healthy to precancer to cancer |
| Tissue | Disease Stage | Enriched GO biological Processes |
| Colorectum | AD |  |
| Colorectum | SER |  |
| Colorectum | MSS |  |
| Colorectum | MSI-H |  |
| Colorectum | FAP |  |
| ∗Top 15 enriched GO BP terms are showed in the bar plot of each disease state in each tissue. Each row represents a significant GO biological process which is colored according to the -log10(p.adjust). |
| Page: 1 2 3 4 5 6 7 8 9 |
| GO ID | Tissue | Disease Stage | Description | Gene Ratio | Bg Ratio | pvalue | p.adjust | Count |
| GO:00604792 | Breast | Precancer | lung cell differentiation | 6/1080 | 24/18723 | 1.99e-03 | 1.90e-02 | 6 |
| GO:00020649 | Breast | Precancer | epithelial cell development | 23/1080 | 220/18723 | 4.28e-03 | 3.35e-02 | 23 |
| GO:00303244 | Breast | IDC | lung development | 28/1434 | 177/18723 | 1.90e-04 | 3.15e-03 | 28 |
| GO:00303234 | Breast | IDC | respiratory tube development | 28/1434 | 181/18723 | 2.78e-04 | 4.26e-03 | 28 |
| GO:00605412 | Breast | IDC | respiratory system development | 30/1434 | 203/18723 | 3.85e-04 | 5.40e-03 | 30 |
| GO:000206414 | Breast | IDC | epithelial cell development | 28/1434 | 220/18723 | 5.53e-03 | 4.05e-02 | 28 |
| GO:003032413 | Breast | DCIS | lung development | 27/1390 | 177/18723 | 2.73e-04 | 4.09e-03 | 27 |
| GO:003032313 | Breast | DCIS | respiratory tube development | 27/1390 | 181/18723 | 3.93e-04 | 5.41e-03 | 27 |
| GO:006054111 | Breast | DCIS | respiratory system development | 28/1390 | 203/18723 | 1.10e-03 | 1.19e-02 | 28 |
| GO:006047911 | Breast | DCIS | lung cell differentiation | 6/1390 | 24/18723 | 6.97e-03 | 4.78e-02 | 6 |
| GO:0002064 | Colorectum | AD | epithelial cell development | 89/3918 | 220/18723 | 2.98e-11 | 3.52e-09 | 89 |
| GO:000206420 | Esophagus | ESCC | epithelial cell development | 136/8552 | 220/18723 | 9.50e-07 | 1.21e-05 | 136 |
| GO:00303239 | Esophagus | ESCC | respiratory tube development | 112/8552 | 181/18723 | 7.82e-06 | 7.69e-05 | 112 |
| GO:00605417 | Esophagus | ESCC | respiratory system development | 123/8552 | 203/18723 | 1.26e-05 | 1.15e-04 | 123 |
| GO:00303249 | Esophagus | ESCC | lung development | 109/8552 | 177/18723 | 1.40e-05 | 1.27e-04 | 109 |
| GO:00604284 | Esophagus | ESCC | lung epithelium development | 27/8552 | 37/18723 | 7.00e-04 | 3.66e-03 | 27 |
| GO:00605763 | Esophagus | ESCC | intestinal epithelial cell development | 12/8552 | 14/18723 | 2.51e-03 | 1.08e-02 | 12 |
| GO:006047913 | Esophagus | ESCC | lung cell differentiation | 18/8552 | 24/18723 | 3.43e-03 | 1.41e-02 | 18 |
| GO:0002066 | Esophagus | ESCC | columnar/cuboidal epithelial cell development | 29/8552 | 44/18723 | 5.41e-03 | 2.02e-02 | 29 |
| GO:00604872 | Esophagus | ESCC | lung epithelial cell differentiation | 17/8552 | 23/18723 | 5.73e-03 | 2.13e-02 | 17 |
| Page: 1 2 |
| Pathway ID | Tissue | Disease Stage | Description | Gene Ratio | Bg Ratio | pvalue | p.adjust | qvalue | Count |
| Page: 1 |
Top |
Cell-cell communication analysis |
| Identification of potential cell-cell interactions between two cell types and their ligand-receptor pairs for different disease states |
| Ligand | Receptor | LRpair | Pathway | Tissue | Disease Stage |
| Page: 1 |
Top |
Single-cell gene regulatory network inference analysis |
| Find out the significant the regulons (TFs) and the target genes of each regulon across cell types for different disease states |
| TF | Cell Type | Tissue | Disease Stage | Target Gene | RSS | Regulon Activity |
| SPDEF | KER | Cervix | Healthy | CXCL5,MUC5B,CXCL6, etc. | 2.65e-01 |  |
| SPDEF | IMGOB | Colorectum | AD | TFF3,SPINK4,FCGBP, etc. | 1.76e-01 |  |
| SPDEF | GOB | Colorectum | ADJ | MUC2,ANO7,CAPN9, etc. | 2.64e-01 |  |
| SPDEF | IMGOB | Colorectum | ADJ | MUC2,ANO7,CAPN9, etc. | 1.15e-01 | |
| SPDEF | GOB | Colorectum | CRC | MUC2,ANO7,CAPN9, etc. | 3.52e-02 |  |
| SPDEF | GOB | Colorectum | MSI-H | TFF3,SPINK4,FCGBP, etc. | 4.51e-01 |  |
| SPDEF | IMGOB | Colorectum | MSI-H | TFF3,SPINK4,FCGBP, etc. | 2.39e-01 | |
| SPDEF | IMGOB | Colorectum | MSS | TFF3,SPINK4,FCGBP, etc. | 1.41e-01 |  |
| SPDEF | GOB | Colorectum | MSS | TFF3,SPINK4,FCGBP, etc. | 1.50e-01 | |
| SPDEF | IMGOB | Colorectum | SER | TFF3,SPINK4,FCGBP, etc. | 5.85e-02 |  |
| ∗The dot plots of a searched regulon are shown for all cell subpopulations in each disease state of each tissue based on the regulon specific score inferred using pySCENIC and by calculating the average expression. |
| Page: 1 2 |
Top |
Somatic mutation of malignant transformation related genes |
| Annotation of somatic variants for genes involved in malignant transformation |
| Hugo Symbol | Variant Class | Variant Classification | dbSNP RS | HGVSc | HGVSp | HGVSp Short | SWISSPROT | BIOTYPE | SIFT | PolyPhen | Tumor Sample Barcode | Tissue | Histology | Sex | Age | Stage | Therapy Types | Drugs | Outcome |
| SPDEF | SNV | Missense_Mutation | rs776586725 | c.928N>T | p.Arg310Cys | p.R310C | O95238 | protein_coding | deleterious(0) | probably_damaging(0.999) | TCGA-AR-A1AQ-01 | Breast | breast invasive carcinoma | Female | <65 | I/II | Chemotherapy | doxorubicin | SD |
| SPDEF | SNV | Missense_Mutation | novel | c.289N>C | p.Asp97His | p.D97H | O95238 | protein_coding | deleterious(0) | probably_damaging(0.972) | TCGA-BH-A0B6-01 | Breast | breast invasive carcinoma | Female | <65 | I/II | Unknown | Unknown | SD |
| SPDEF | SNV | Missense_Mutation | c.573C>A | p.Phe191Leu | p.F191L | O95238 | protein_coding | tolerated(0.06) | possibly_damaging(0.88) | TCGA-D8-A1JA-01 | Breast | breast invasive carcinoma | Female | <65 | III/IV | Chemotherapy | adriamycin | PD | |
| SPDEF | SNV | Missense_Mutation | rs755931546 | c.154G>A | p.Glu52Lys | p.E52K | O95238 | protein_coding | deleterious_low_confidence(0.02) | possibly_damaging(0.797) | TCGA-D8-A1JA-01 | Breast | breast invasive carcinoma | Female | <65 | III/IV | Chemotherapy | adriamycin | PD |
| SPDEF | SNV | Missense_Mutation | novel | c.281N>G | p.Pro94Arg | p.P94R | O95238 | protein_coding | deleterious(0) | probably_damaging(0.97) | TCGA-DS-A1OB-01 | Cervix | cervical & endocervical cancer | Female | <65 | I/II | Chemotherapy | carboplatin | PD |
| SPDEF | insertion | Frame_Shift_Ins | novel | c.278_279insGGCTT | p.Cys93TrpfsTer22 | p.C93Wfs*22 | O95238 | protein_coding | TCGA-DS-A1OB-01 | Cervix | cervical & endocervical cancer | Female | <65 | I/II | Chemotherapy | carboplatin | PD | ||
| SPDEF | SNV | Missense_Mutation | c.350N>G | p.His117Arg | p.H117R | O95238 | protein_coding | tolerated(0.83) | benign(0.001) | TCGA-AA-3715-01 | Colorectum | colon adenocarcinoma | Male | >=65 | I/II | Unknown | Unknown | PD | |
| SPDEF | SNV | Missense_Mutation | novel | c.721N>A | p.Asp241Asn | p.D241N | O95238 | protein_coding | tolerated(0.06) | benign(0.383) | TCGA-AA-3984-01 | Colorectum | colon adenocarcinoma | Female | <65 | I/II | Unknown | Unknown | SD |
| SPDEF | SNV | Missense_Mutation | c.784C>T | p.Pro262Ser | p.P262S | O95238 | protein_coding | deleterious(0.03) | probably_damaging(0.967) | TCGA-DM-A1HB-01 | Colorectum | colon adenocarcinoma | Male | >=65 | III/IV | Unknown | Unknown | SD | |
| SPDEF | SNV | Missense_Mutation | c.572N>C | p.Phe191Ser | p.F191S | O95238 | protein_coding | deleterious(0.02) | probably_damaging(0.99) | TCGA-G4-6320-01 | Colorectum | colon adenocarcinoma | Male | >=65 | III/IV | Chemotherapy | oxaliplatin | SD |
| Page: 1 2 3 |
Top |
Related drugs of malignant transformation related genes |
| Identification of chemicals and drugs interact with genes involved in malignant transfromation |
| (DGIdb 4.0) |
| Entrez ID | Symbol | Category | Interaction Types | Drug Claim Name | Drug Name | PMIDs |
| Page: 1 |

Copyright 2023-Present -The University of Texas Health Science Center at Houston |