
|
|||||
|
 | |
| |
| |
| |
| |
| |
|
Gene: SPCS1 |
Gene summary for SPCS1 |
| Gene information | Species | Human | Gene symbol | SPCS1 | Gene ID | 28972 |
| Gene name | signal peptidase complex subunit 1 | |
| Gene Alias | HSPC033 | |
| Cytomap | 3p21.1 | |
| Gene Type | protein-coding | GO ID | GO:0006465 | UniProtAcc | Q9Y6A9 |
Top |
Malignant transformation analysis |
| Identification of the aberrant gene expression in precancerous and cancerous lesions by comparing the gene expression of stem-like cells in diseased tissues with normal stem cells |
| Entrez ID | Symbol | Replicates | Species | Organ | Tissue | Adj P-value | Log2FC | Malignancy |
| 28972 | SPCS1 | CA_HPV_1 | Human | Cervix | CC | 1.46e-15 | -1.16e-01 | 0.0264 |
| 28972 | SPCS1 | CA_HPV_2 | Human | Cervix | CC | 9.63e-06 | -3.38e-01 | 0.0391 |
| 28972 | SPCS1 | CA_HPV_3 | Human | Cervix | CC | 1.93e-03 | -8.86e-03 | 0.0414 |
| 28972 | SPCS1 | CCI_1 | Human | Cervix | CC | 1.03e-20 | -9.76e-01 | 0.528 |
| 28972 | SPCS1 | CCI_2 | Human | Cervix | CC | 1.67e-06 | -6.94e-01 | 0.5249 |
| 28972 | SPCS1 | CCI_3 | Human | Cervix | CC | 1.03e-16 | -8.54e-01 | 0.516 |
| 28972 | SPCS1 | CCII_1 | Human | Cervix | CC | 1.46e-32 | -9.64e-01 | 0.3249 |
| 28972 | SPCS1 | Tumor | Human | Cervix | CC | 1.05e-10 | -3.99e-01 | 0.1241 |
| 28972 | SPCS1 | sample3 | Human | Cervix | CC | 1.77e-13 | -3.90e-01 | 0.1387 |
| 28972 | SPCS1 | L1 | Human | Cervix | CC | 2.24e-07 | -2.26e-01 | 0.0802 |
| 28972 | SPCS1 | T1 | Human | Cervix | CC | 6.86e-13 | -5.18e-01 | 0.0918 |
| 28972 | SPCS1 | T3 | Human | Cervix | CC | 6.62e-13 | -4.09e-01 | 0.1389 |
| 28972 | SPCS1 | HTA11_3410_2000001011 | Human | Colorectum | AD | 8.48e-07 | 2.03e-01 | 0.0155 |
| 28972 | SPCS1 | HTA11_2487_2000001011 | Human | Colorectum | SER | 1.98e-11 | 4.81e-01 | -0.1808 |
| 28972 | SPCS1 | HTA11_1938_2000001011 | Human | Colorectum | AD | 1.05e-09 | 5.05e-01 | -0.0811 |
| 28972 | SPCS1 | HTA11_78_2000001011 | Human | Colorectum | AD | 2.33e-07 | 3.25e-01 | -0.1088 |
| 28972 | SPCS1 | HTA11_347_2000001011 | Human | Colorectum | AD | 7.79e-21 | 4.73e-01 | -0.1954 |
| 28972 | SPCS1 | HTA11_411_2000001011 | Human | Colorectum | SER | 2.94e-06 | 7.61e-01 | -0.2602 |
| 28972 | SPCS1 | HTA11_3361_2000001011 | Human | Colorectum | AD | 3.07e-05 | 3.52e-01 | -0.1207 |
| 28972 | SPCS1 | HTA11_83_2000001011 | Human | Colorectum | SER | 5.97e-08 | 3.52e-01 | -0.1526 |
| Page: 1 2 3 4 5 6 7 8 9 10 11 12 |
| Tissue | Expression Dynamics | Abbreviation |
| Cervix | 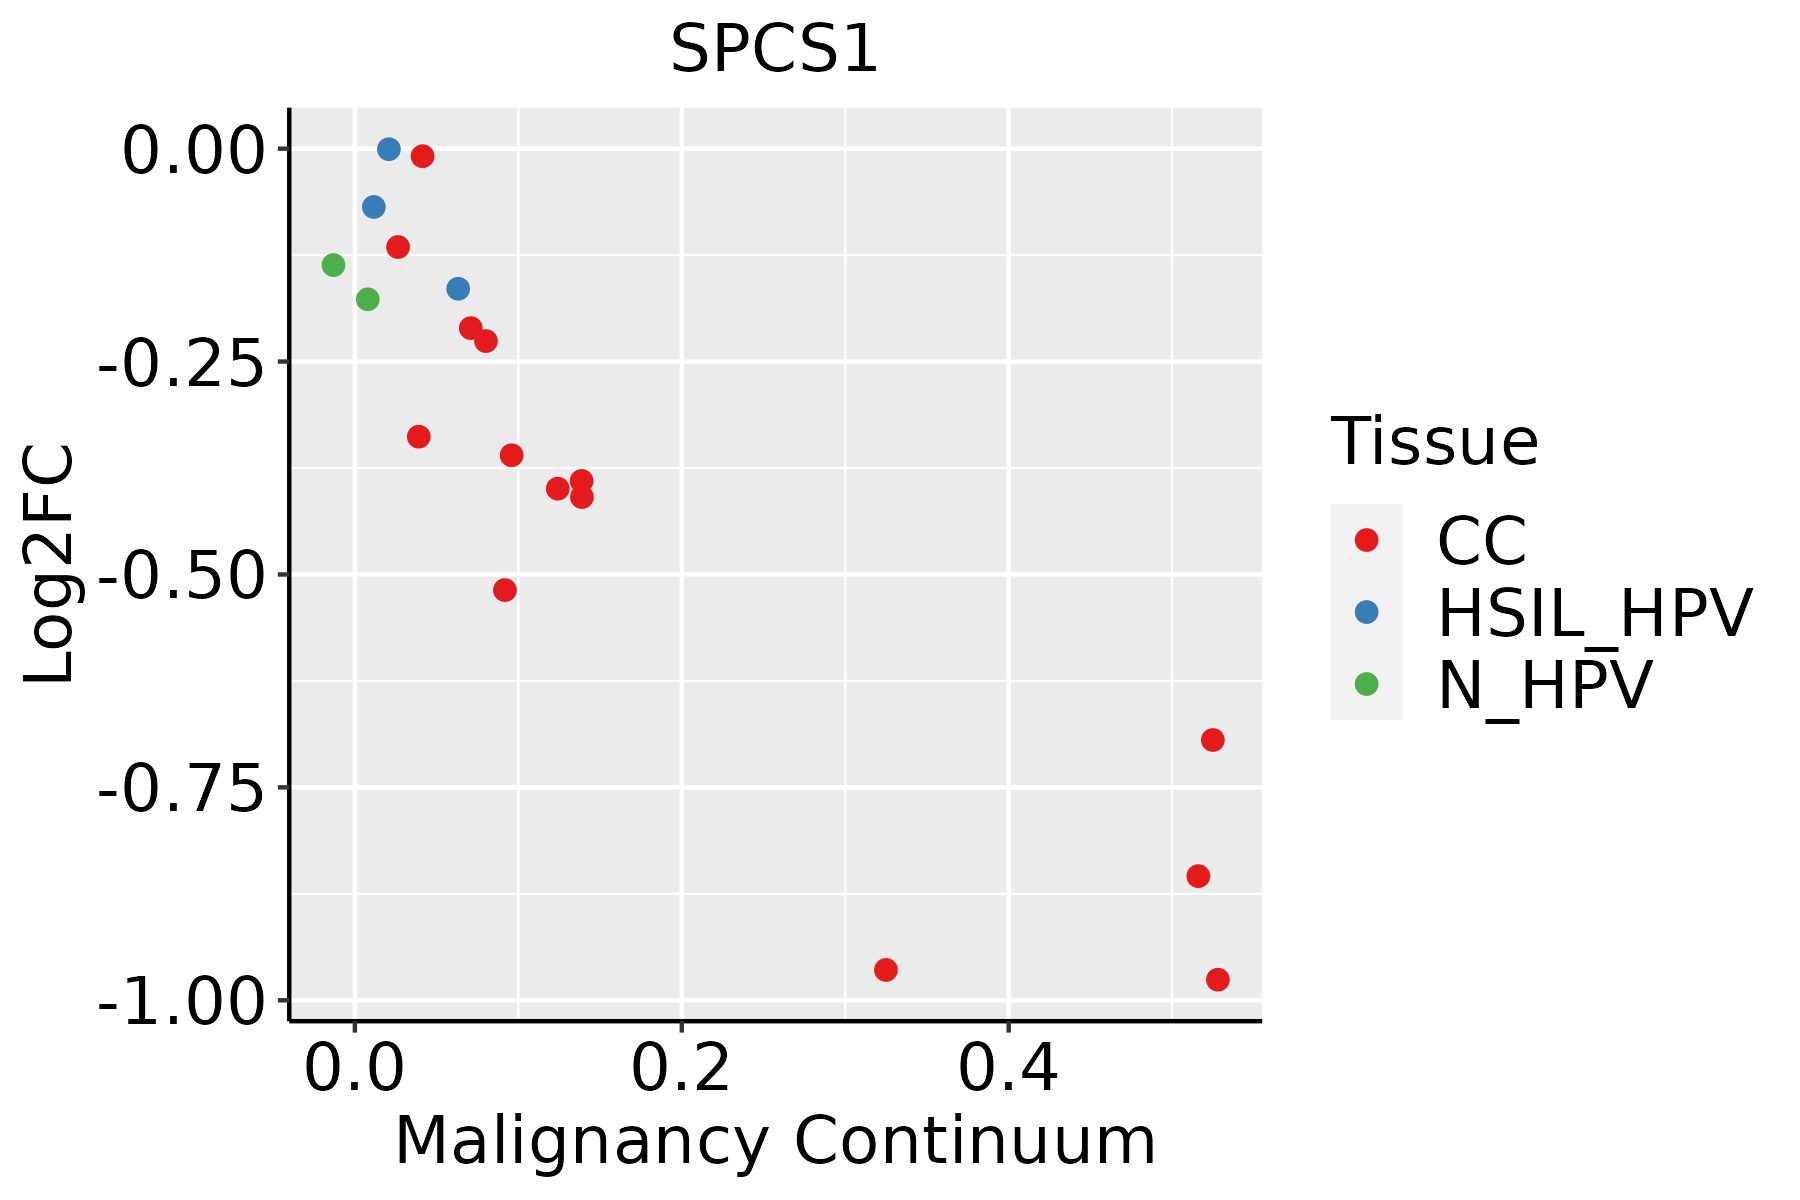 | CC: Cervix cancer |
| HSIL_HPV: HPV-infected high-grade squamous intraepithelial lesions | ||
| N_HPV: HPV-infected normal cervix | ||
| Colorectum (GSE201348) |  | FAP: Familial adenomatous polyposis |
| CRC: Colorectal cancer | ||
| Colorectum (HTA11) |  | AD: Adenomas |
| SER: Sessile serrated lesions | ||
| MSI-H: Microsatellite-high colorectal cancer | ||
| MSS: Microsatellite stable colorectal cancer | ||
| Endometrium |  | AEH: Atypical endometrial hyperplasia |
| EEC: Endometrioid Cancer | ||
| Esophagus | 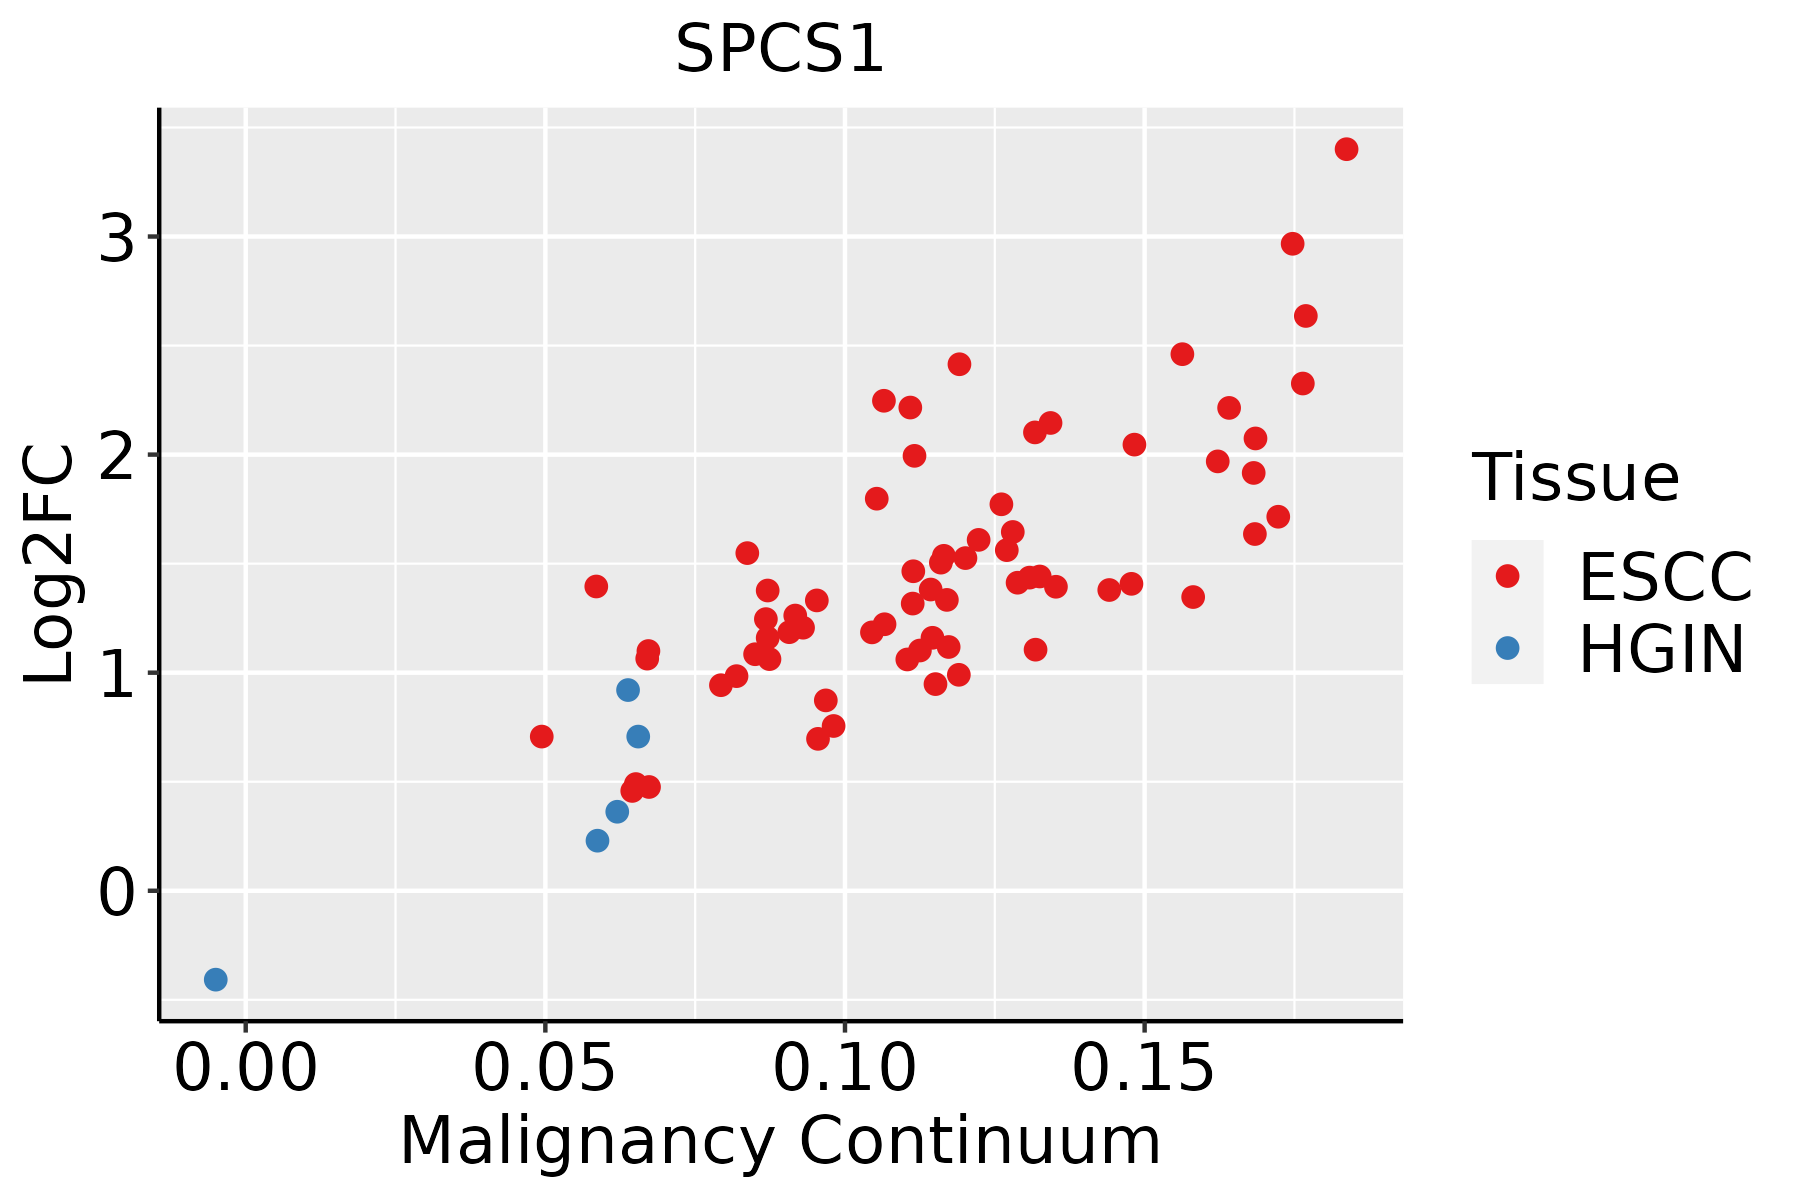 | ESCC: Esophageal squamous cell carcinoma |
| HGIN: High-grade intraepithelial neoplasias | ||
| LGIN: Low-grade intraepithelial neoplasias | ||
| GC | 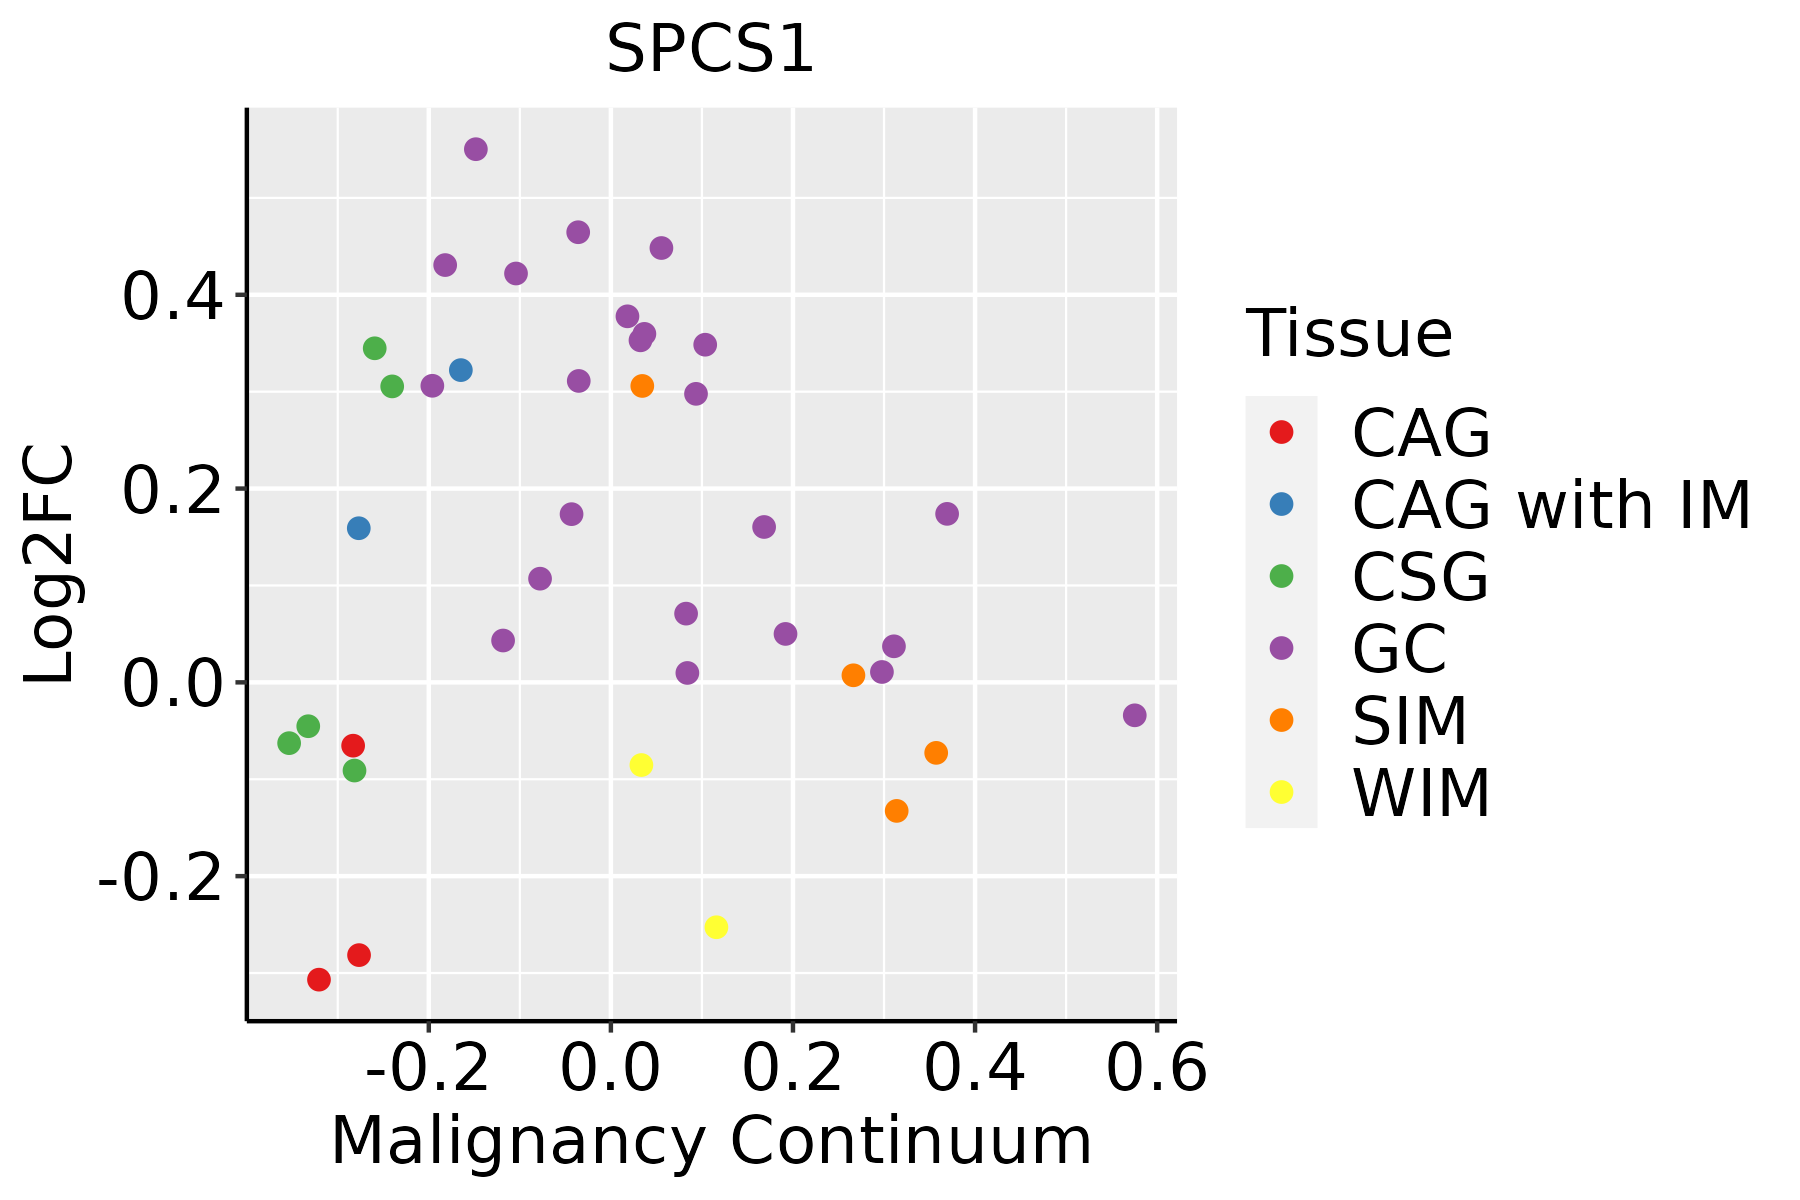 | CAG: Chronic atrophic gastritis |
| CAG with IM: Chronic atrophic gastritis with intestinal metaplasia | ||
| CSG: Chronic superficial gastritis | ||
| GC: Gastric cancer | ||
| SIM: Severe intestinal metaplasia | ||
| WIM: Wild intestinal metaplasia | ||
| Liver | 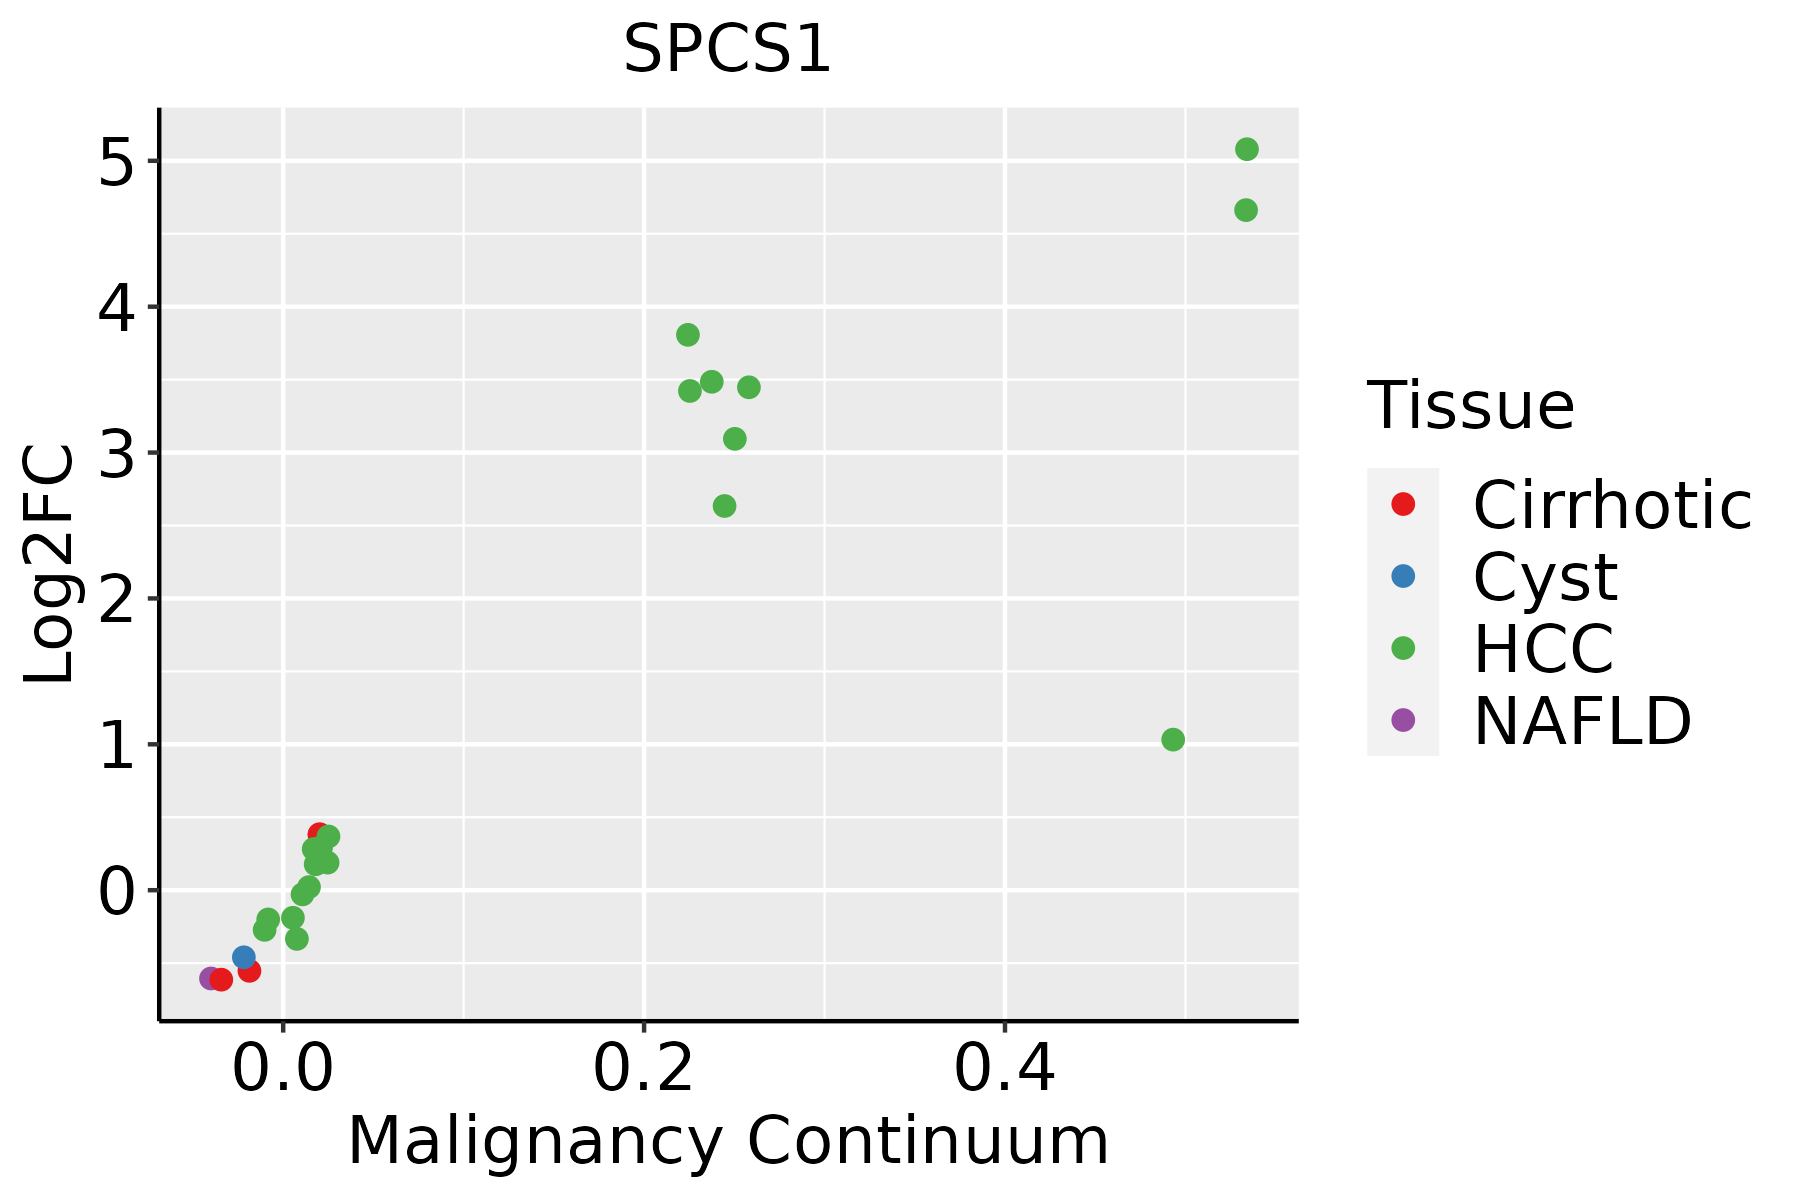 | HCC: Hepatocellular carcinoma |
| NAFLD: Non-alcoholic fatty liver disease | ||
| Oral Cavity |  | EOLP: Erosive Oral lichen planus |
| LP: leukoplakia | ||
| NEOLP: Non-erosive oral lichen planus | ||
| OSCC: Oral squamous cell carcinoma | ||
| Prostate |  | BPH: Benign Prostatic Hyperplasia |
| Skin | 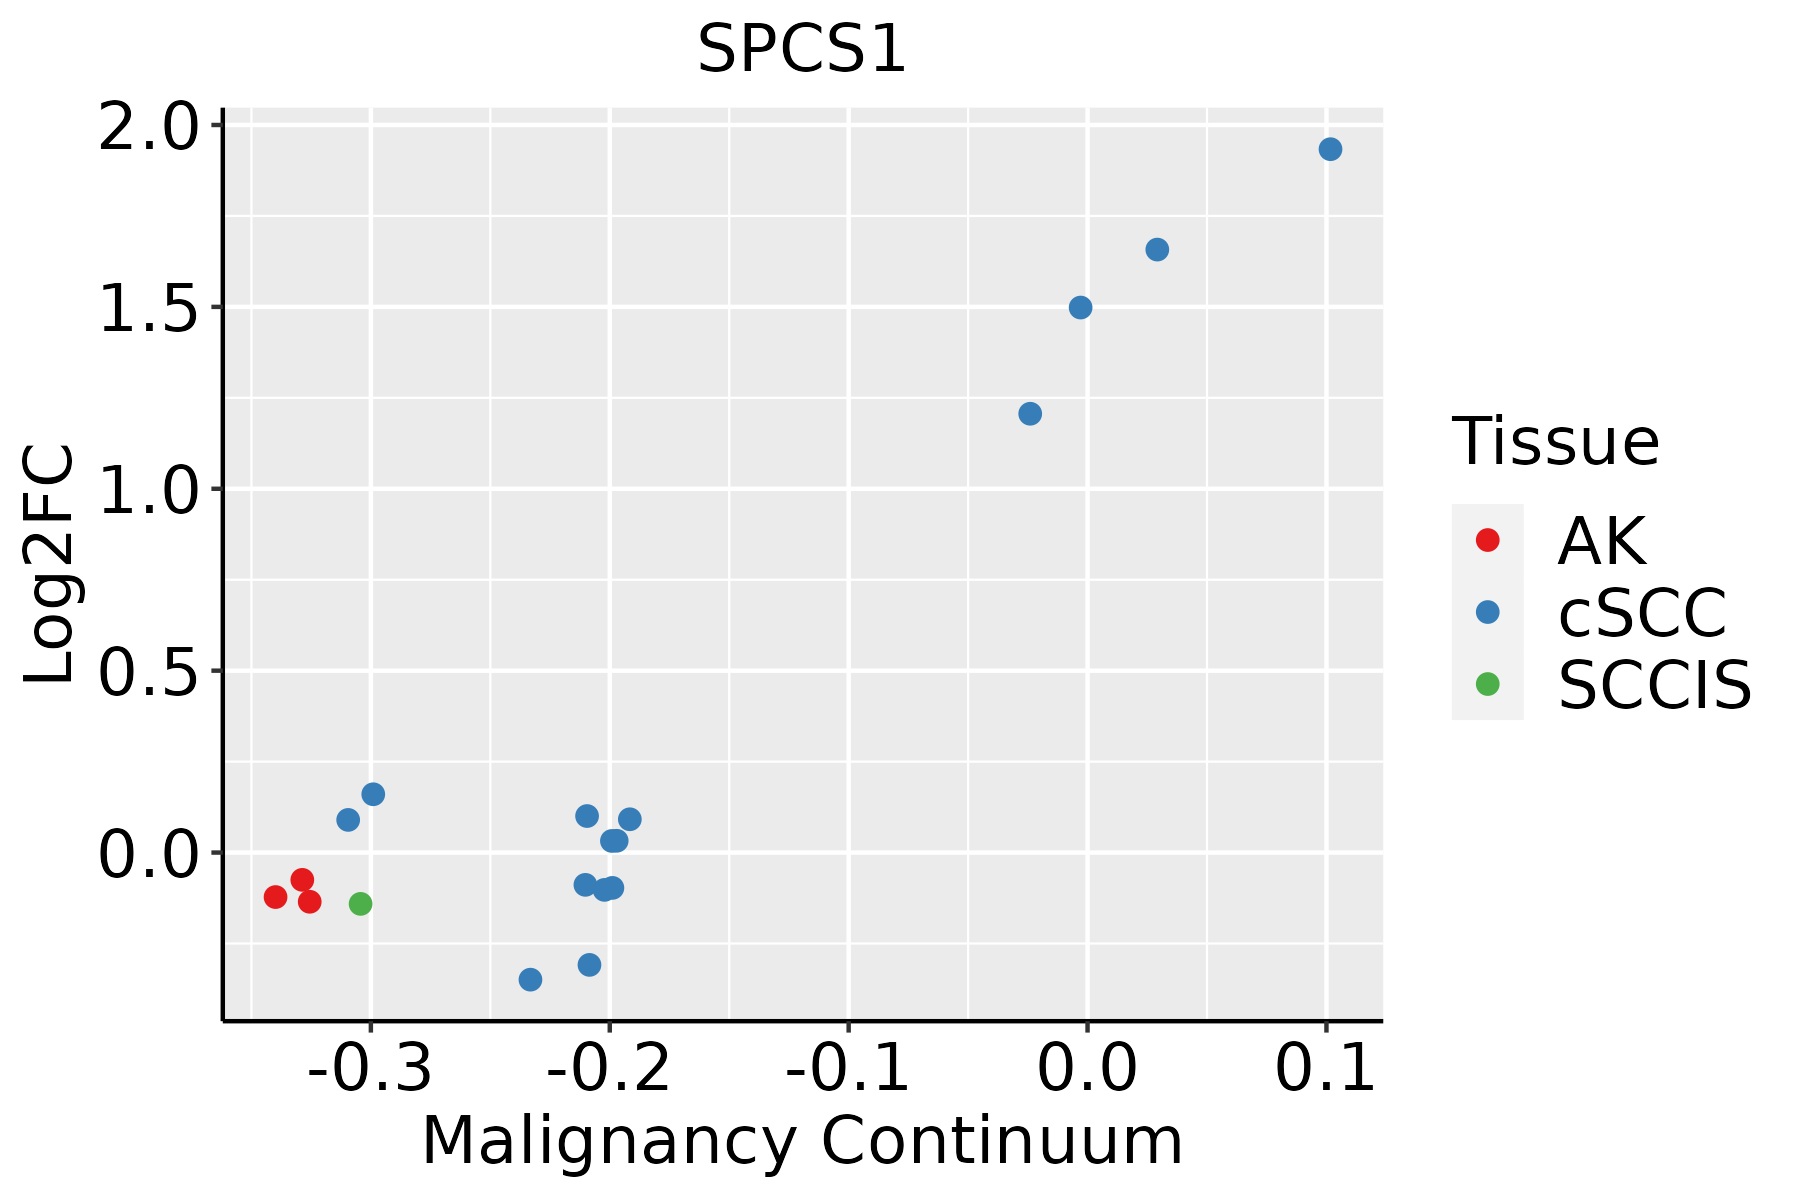 | AK: Actinic keratosis |
| cSCC: Cutaneous squamous cell carcinoma | ||
| SCCIS:squamous cell carcinoma in situ | ||
| Thyroid | 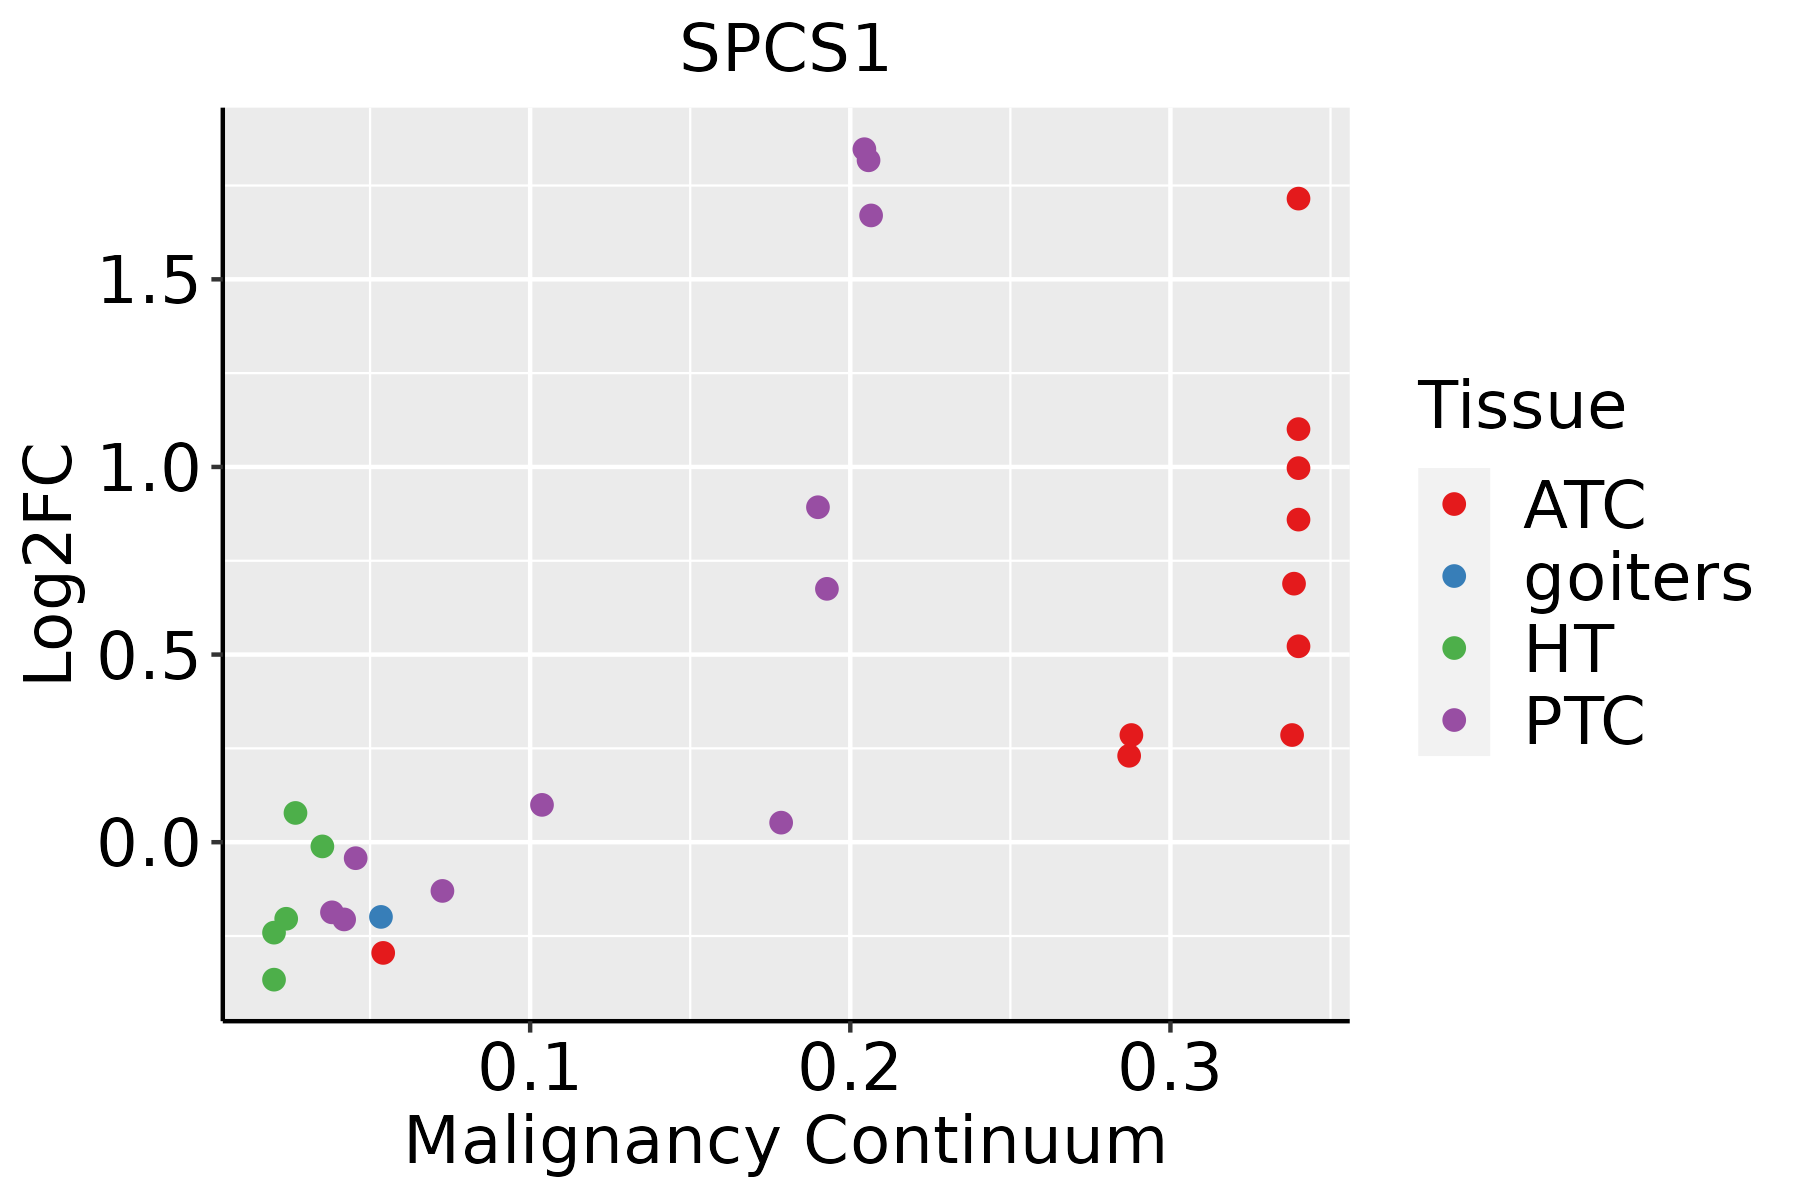 | ATC: Anaplastic thyroid cancer |
| HT: Hashimoto's thyroiditis | ||
| PTC: Papillary thyroid cancer |
| ∗log2FC in expression of this searched gene in stem-like cells from each diseased tissue sample relative to stem-like cells in normal samples in each tissue plotted against the malignancy continuum. Samples are colored based on if they are from different disease stage. |
Top |
Malignant transformation related pathway analysis |
| Find out the enriched GO biological processes and KEGG pathways involved in transition from healthy to precancer to cancer |
| Tissue | Disease Stage | Enriched GO biological Processes |
| Colorectum | AD |  |
| Colorectum | SER |  |
| Colorectum | MSS |  |
| Colorectum | MSI-H |  |
| Colorectum | FAP |  |
| ∗Top 15 enriched GO BP terms are showed in the bar plot of each disease state in each tissue. Each row represents a significant GO biological process which is colored according to the -log10(p.adjust). |
| Page: 1 2 3 4 5 6 7 8 9 |
| GO ID | Tissue | Disease Stage | Description | Gene Ratio | Bg Ratio | pvalue | p.adjust | Count |
| GO:001603210 | Cervix | CC | viral process | 109/2311 | 415/18723 | 5.40e-15 | 6.46e-12 | 109 |
| GO:001905810 | Cervix | CC | viral life cycle | 87/2311 | 317/18723 | 2.20e-13 | 1.20e-10 | 87 |
| GO:00725949 | Cervix | CC | establishment of protein localization to organelle | 99/2311 | 422/18723 | 1.23e-10 | 2.11e-08 | 99 |
| GO:000660510 | Cervix | CC | protein targeting | 68/2311 | 314/18723 | 2.17e-06 | 6.55e-05 | 68 |
| GO:00064657 | Cervix | CC | signal peptide processing | 8/2311 | 14/18723 | 8.01e-05 | 1.09e-03 | 8 |
| GO:00709726 | Cervix | CC | protein localization to endoplasmic reticulum | 21/2311 | 74/18723 | 1.69e-04 | 2.00e-03 | 21 |
| GO:00516048 | Cervix | CC | protein maturation | 56/2311 | 294/18723 | 5.90e-04 | 5.59e-03 | 56 |
| GO:00725995 | Cervix | CC | establishment of protein localization to endoplasmic reticulum | 13/2311 | 46/18723 | 2.95e-03 | 1.94e-02 | 13 |
| GO:00190807 | Cervix | CC | viral gene expression | 21/2311 | 94/18723 | 4.68e-03 | 2.82e-02 | 21 |
| GO:0016032 | Colorectum | AD | viral process | 168/3918 | 415/18723 | 4.67e-20 | 3.66e-17 | 168 |
| GO:0019058 | Colorectum | AD | viral life cycle | 119/3918 | 317/18723 | 6.18e-12 | 8.23e-10 | 119 |
| GO:0072594 | Colorectum | AD | establishment of protein localization to organelle | 148/3918 | 422/18723 | 7.95e-12 | 1.04e-09 | 148 |
| GO:0006605 | Colorectum | AD | protein targeting | 105/3918 | 314/18723 | 1.39e-07 | 6.44e-06 | 105 |
| GO:0019080 | Colorectum | AD | viral gene expression | 42/3918 | 94/18723 | 1.90e-07 | 8.02e-06 | 42 |
| GO:0019082 | Colorectum | AD | viral protein processing | 17/3918 | 29/18723 | 1.04e-05 | 2.40e-04 | 17 |
| GO:0006465 | Colorectum | AD | signal peptide processing | 10/3918 | 14/18723 | 6.90e-05 | 1.11e-03 | 10 |
| GO:0051604 | Colorectum | AD | protein maturation | 85/3918 | 294/18723 | 6.73e-04 | 6.91e-03 | 85 |
| GO:0019068 | Colorectum | AD | virion assembly | 15/3918 | 35/18723 | 2.78e-03 | 2.09e-02 | 15 |
| GO:0070972 | Colorectum | AD | protein localization to endoplasmic reticulum | 26/3918 | 74/18723 | 3.28e-03 | 2.40e-02 | 26 |
| GO:0016485 | Colorectum | AD | protein processing | 63/3918 | 225/18723 | 6.77e-03 | 4.19e-02 | 63 |
| Page: 1 2 3 4 5 6 7 8 9 10 11 12 13 |
| Pathway ID | Tissue | Disease Stage | Description | Gene Ratio | Bg Ratio | pvalue | p.adjust | qvalue | Count |
| hsa0306010 | Cervix | CC | Protein export | 10/1267 | 23/8465 | 9.64e-04 | 4.22e-03 | 2.49e-03 | 10 |
| hsa0306013 | Cervix | CC | Protein export | 10/1267 | 23/8465 | 9.64e-04 | 4.22e-03 | 2.49e-03 | 10 |
| hsa03060 | Colorectum | AD | Protein export | 14/2092 | 23/8465 | 2.43e-04 | 1.90e-03 | 1.21e-03 | 14 |
| hsa030601 | Colorectum | AD | Protein export | 14/2092 | 23/8465 | 2.43e-04 | 1.90e-03 | 1.21e-03 | 14 |
| hsa030602 | Colorectum | MSS | Protein export | 15/1875 | 23/8465 | 1.13e-05 | 1.26e-04 | 7.71e-05 | 15 |
| hsa030603 | Colorectum | MSS | Protein export | 15/1875 | 23/8465 | 1.13e-05 | 1.26e-04 | 7.71e-05 | 15 |
| hsa030604 | Colorectum | MSI-H | Protein export | 11/797 | 23/8465 | 2.26e-06 | 3.65e-05 | 3.06e-05 | 11 |
| hsa030605 | Colorectum | MSI-H | Protein export | 11/797 | 23/8465 | 2.26e-06 | 3.65e-05 | 3.06e-05 | 11 |
| hsa0306014 | Endometrium | AEH | Protein export | 11/1197 | 23/8465 | 1.14e-04 | 1.06e-03 | 7.73e-04 | 11 |
| hsa0306015 | Endometrium | AEH | Protein export | 11/1197 | 23/8465 | 1.14e-04 | 1.06e-03 | 7.73e-04 | 11 |
| hsa0306023 | Endometrium | EEC | Protein export | 11/1237 | 23/8465 | 1.54e-04 | 1.41e-03 | 1.05e-03 | 11 |
| hsa0306033 | Endometrium | EEC | Protein export | 11/1237 | 23/8465 | 1.54e-04 | 1.41e-03 | 1.05e-03 | 11 |
| hsa0306020 | Esophagus | HGIN | Protein export | 13/1383 | 23/8465 | 1.27e-05 | 1.80e-04 | 1.43e-04 | 13 |
| hsa03060110 | Esophagus | HGIN | Protein export | 13/1383 | 23/8465 | 1.27e-05 | 1.80e-04 | 1.43e-04 | 13 |
| hsa0306026 | Esophagus | ESCC | Protein export | 22/4205 | 23/8465 | 2.43e-06 | 1.43e-05 | 7.32e-06 | 22 |
| hsa0306036 | Esophagus | ESCC | Protein export | 22/4205 | 23/8465 | 2.43e-06 | 1.43e-05 | 7.32e-06 | 22 |
| hsa030608 | Liver | Cirrhotic | Protein export | 20/2530 | 23/8465 | 2.00e-08 | 3.51e-07 | 2.17e-07 | 20 |
| hsa0306011 | Liver | Cirrhotic | Protein export | 20/2530 | 23/8465 | 2.00e-08 | 3.51e-07 | 2.17e-07 | 20 |
| hsa0306021 | Liver | HCC | Protein export | 21/4020 | 23/8465 | 1.20e-05 | 8.53e-05 | 4.74e-05 | 21 |
| hsa0306031 | Liver | HCC | Protein export | 21/4020 | 23/8465 | 1.20e-05 | 8.53e-05 | 4.74e-05 | 21 |
| Page: 1 2 |
Top |
Cell-cell communication analysis |
| Identification of potential cell-cell interactions between two cell types and their ligand-receptor pairs for different disease states |
| Ligand | Receptor | LRpair | Pathway | Tissue | Disease Stage |
| Page: 1 |
Top |
Single-cell gene regulatory network inference analysis |
| Find out the significant the regulons (TFs) and the target genes of each regulon across cell types for different disease states |
| TF | Cell Type | Tissue | Disease Stage | Target Gene | RSS | Regulon Activity |
| ∗The dot plots of a searched regulon are shown for all cell subpopulations in each disease state of each tissue based on the regulon specific score inferred using pySCENIC and by calculating the average expression. |
| Page: 1 |
Top |
Somatic mutation of malignant transformation related genes |
| Annotation of somatic variants for genes involved in malignant transformation |
| Hugo Symbol | Variant Class | Variant Classification | dbSNP RS | HGVSc | HGVSp | HGVSp Short | SWISSPROT | BIOTYPE | SIFT | PolyPhen | Tumor Sample Barcode | Tissue | Histology | Sex | Age | Stage | Therapy Types | Drugs | Outcome |
| SPCS1 | SNV | Missense_Mutation | c.157N>G | p.Arg53Gly | p.R53G | protein_coding | tolerated_low_confidence(0.2) | benign(0.228) | TCGA-MA-AA3Z-01 | Cervix | cervical & endocervical cancer | Female | <65 | I/II | Unknown | Unknown | SD | ||
| SPCS1 | insertion | Frame_Shift_Ins | rs754517312 | c.286_287insT | p.Ser98PhefsTer13 | p.S98Ffs*13 | protein_coding | TCGA-AZ-4315-01 | Colorectum | colon adenocarcinoma | Male | <65 | I/II | Unknown | Unknown | SD | |||
| SPCS1 | SNV | Missense_Mutation | novel | c.477N>C | p.Glu159Asp | p.E159D | protein_coding | tolerated(0.73) | benign(0.001) | TCGA-A5-A2K5-01 | Endometrium | uterine corpus endometrioid carcinoma | Female | >=65 | I/II | Unknown | Unknown | SD | |
| SPCS1 | SNV | Missense_Mutation | novel | c.479N>T | p.Arg160Ile | p.R160I | protein_coding | deleterious(0.01) | possibly_damaging(0.855) | TCGA-AJ-A3EL-01 | Endometrium | uterine corpus endometrioid carcinoma | Female | <65 | I/II | Unknown | Unknown | SD | |
| SPCS1 | SNV | Missense_Mutation | novel | c.210N>T | p.Glu70Asp | p.E70D | protein_coding | tolerated(0.21) | benign(0.001) | TCGA-AP-A1DV-01 | Endometrium | uterine corpus endometrioid carcinoma | Female | <65 | I/II | Unknown | Unknown | SD | |
| SPCS1 | SNV | Missense_Mutation | c.181N>A | p.Cys61Ser | p.C61S | protein_coding | tolerated_low_confidence(0.41) | benign(0.017) | TCGA-D1-A15W-01 | Endometrium | uterine corpus endometrioid carcinoma | Female | <65 | III/IV | Chemotherapy | taxol | SD | ||
| SPCS1 | insertion | Frame_Shift_Ins | rs754517312 | c.292dupT | p.Ser98PhefsTer13 | p.S98Ffs*13 | protein_coding | TCGA-77-A5G3-01 | Lung | lung squamous cell carcinoma | Male | <65 | I/II | Unknown | Unknown | SD | |||
| SPCS1 | deletion | Frame_Shift_Del | novel | c.366delN | p.Phe123LeufsTer7 | p.F123Lfs*7 | protein_coding | TCGA-94-8035-01 | Lung | lung squamous cell carcinoma | Male | <65 | I/II | Unspecific | Complete Response | ||||
| SPCS1 | SNV | Missense_Mutation | c.125N>G | p.Leu42Arg | p.L42R | protein_coding | tolerated_low_confidence(0.33) | benign(0) | TCGA-BR-8363-01 | Stomach | stomach adenocarcinoma | Female | >=65 | I/II | Unknown | Unknown | SD | ||
| SPCS1 | SNV | Missense_Mutation | c.412N>T | p.Arg138Cys | p.R138C | protein_coding | deleterious(0) | probably_damaging(1) | TCGA-BR-8363-01 | Stomach | stomach adenocarcinoma | Female | >=65 | I/II | Unknown | Unknown | SD |
| Page: 1 2 |
Top |
Related drugs of malignant transformation related genes |
| Identification of chemicals and drugs interact with genes involved in malignant transfromation |
| (DGIdb 4.0) |
| Entrez ID | Symbol | Category | Interaction Types | Drug Claim Name | Drug Name | PMIDs |
| Page: 1 |

Copyright 2023-Present -The University of Texas Health Science Center at Houston |