
|
|||||
|
 | |
| |
| |
| |
| |
| |
|
Gene: SPC25 |
Gene summary for SPC25 |
| Gene information | Species | Human | Gene symbol | SPC25 | Gene ID | 57405 |
| Gene name | SPC25 component of NDC80 kinetochore complex | |
| Gene Alias | AD024 | |
| Cytomap | 2q24.3 | |
| Gene Type | protein-coding | GO ID | GO:0000226 | UniProtAcc | Q9HBM1 |
Top |
Malignant transformation analysis |
| Identification of the aberrant gene expression in precancerous and cancerous lesions by comparing the gene expression of stem-like cells in diseased tissues with normal stem cells |
| Entrez ID | Symbol | Replicates | Species | Organ | Tissue | Adj P-value | Log2FC | Malignancy |
| 57405 | SPC25 | P2T-E | Human | Esophagus | ESCC | 1.78e-03 | 2.18e-01 | 0.1177 |
| 57405 | SPC25 | P4T-E | Human | Esophagus | ESCC | 1.22e-08 | 2.54e-01 | 0.1323 |
| 57405 | SPC25 | P5T-E | Human | Esophagus | ESCC | 2.05e-07 | 2.03e-01 | 0.1327 |
| 57405 | SPC25 | P10T-E | Human | Esophagus | ESCC | 1.66e-02 | 1.30e-01 | 0.116 |
| 57405 | SPC25 | P16T-E | Human | Esophagus | ESCC | 3.50e-02 | 1.06e-01 | 0.1153 |
| 57405 | SPC25 | P17T-E | Human | Esophagus | ESCC | 2.68e-03 | 2.06e-01 | 0.1278 |
| 57405 | SPC25 | P21T-E | Human | Esophagus | ESCC | 7.90e-03 | 1.46e-01 | 0.1617 |
| 57405 | SPC25 | P24T-E | Human | Esophagus | ESCC | 8.84e-05 | 1.82e-01 | 0.1287 |
| 57405 | SPC25 | P28T-E | Human | Esophagus | ESCC | 1.88e-04 | 1.63e-01 | 0.1149 |
| 57405 | SPC25 | P31T-E | Human | Esophagus | ESCC | 9.20e-06 | 1.77e-01 | 0.1251 |
| 57405 | SPC25 | P32T-E | Human | Esophagus | ESCC | 1.88e-11 | 3.04e-01 | 0.1666 |
| 57405 | SPC25 | P37T-E | Human | Esophagus | ESCC | 4.28e-02 | 1.08e-01 | 0.1371 |
| 57405 | SPC25 | P38T-E | Human | Esophagus | ESCC | 5.18e-03 | 2.63e-01 | 0.127 |
| 57405 | SPC25 | P52T-E | Human | Esophagus | ESCC | 9.35e-10 | 2.88e-01 | 0.1555 |
| 57405 | SPC25 | P74T-E | Human | Esophagus | ESCC | 3.81e-05 | 2.76e-01 | 0.1479 |
| 57405 | SPC25 | P75T-E | Human | Esophagus | ESCC | 1.66e-02 | 1.66e-01 | 0.1125 |
| 57405 | SPC25 | P76T-E | Human | Esophagus | ESCC | 3.97e-04 | 1.95e-01 | 0.1207 |
| 57405 | SPC25 | P79T-E | Human | Esophagus | ESCC | 2.02e-06 | 2.36e-01 | 0.1154 |
| 57405 | SPC25 | P83T-E | Human | Esophagus | ESCC | 2.18e-11 | 4.42e-01 | 0.1738 |
| 57405 | SPC25 | P89T-E | Human | Esophagus | ESCC | 6.22e-10 | 9.23e-01 | 0.1752 |
| Page: 1 2 |
| Tissue | Expression Dynamics | Abbreviation |
| Esophagus | 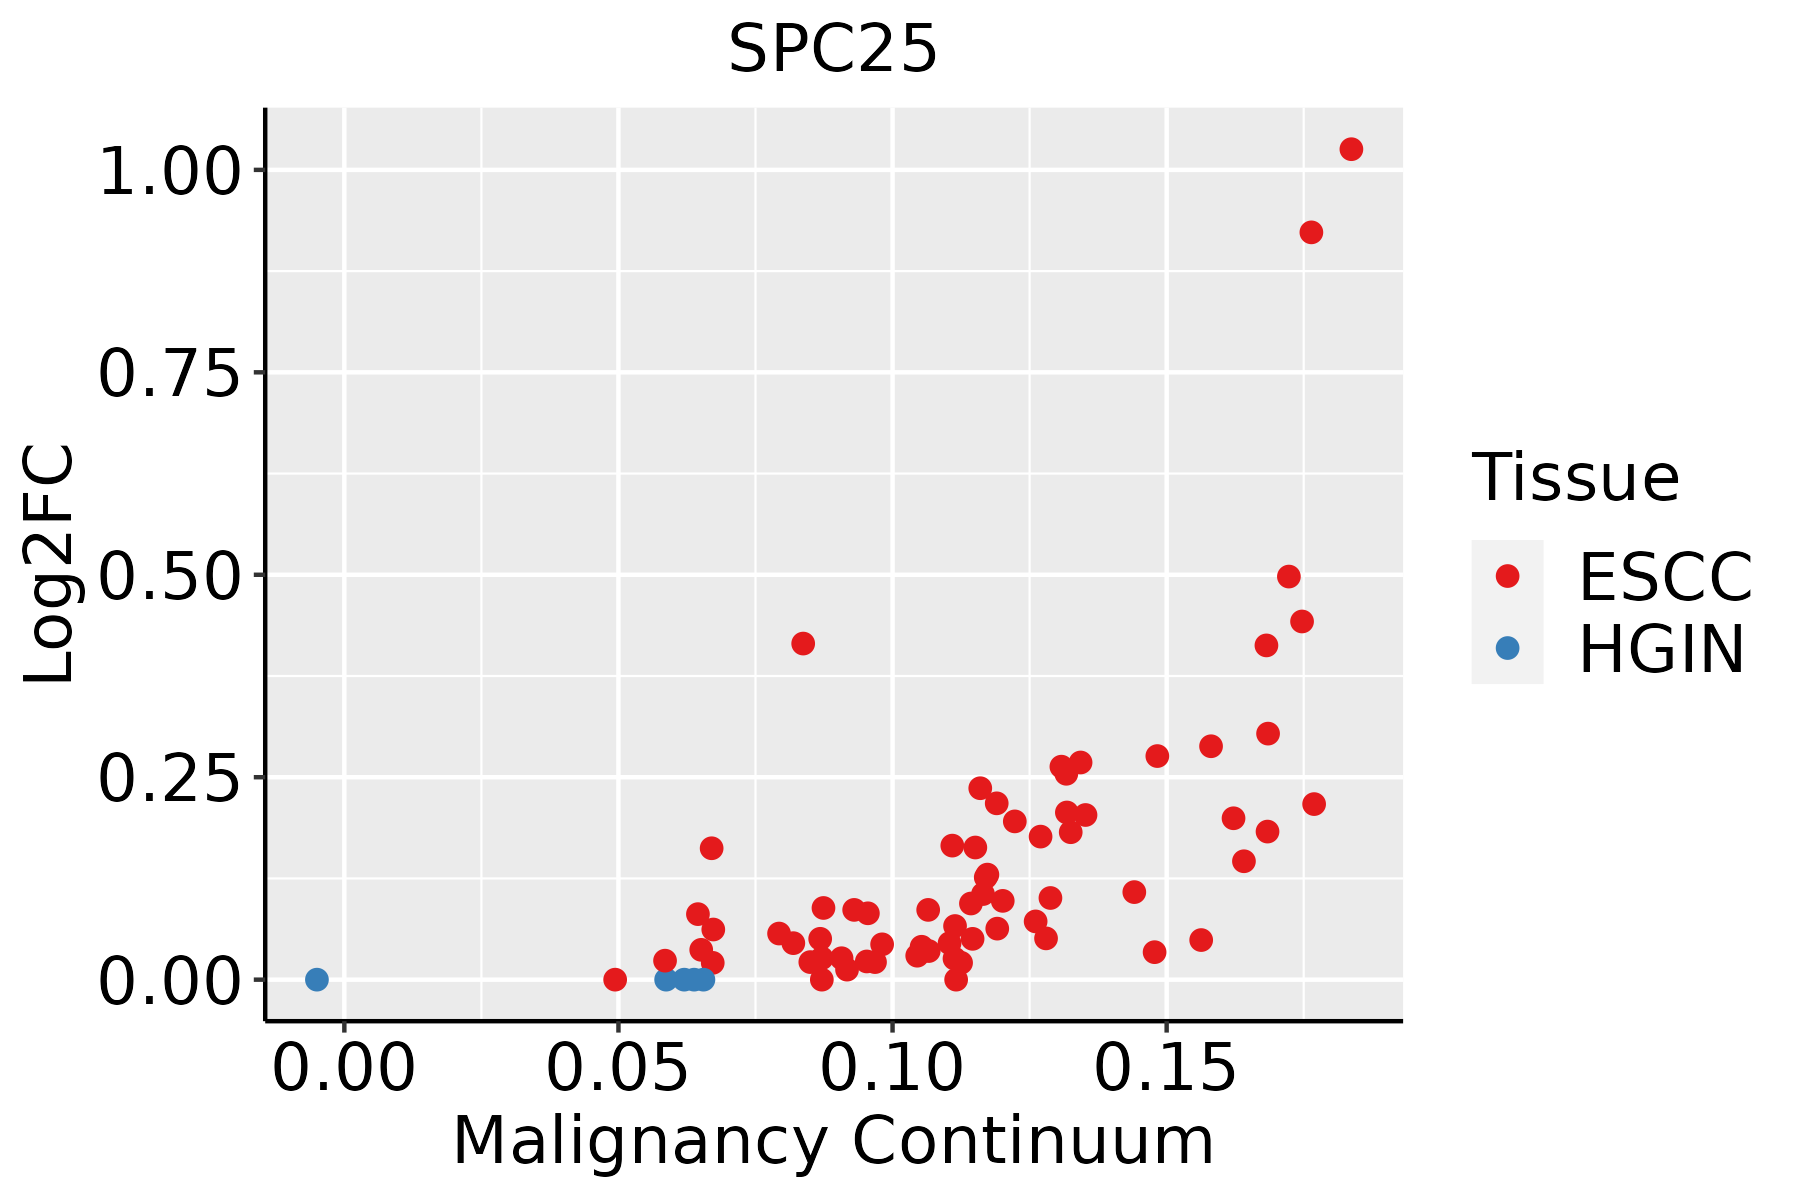 | ESCC: Esophageal squamous cell carcinoma |
| HGIN: High-grade intraepithelial neoplasias | ||
| LGIN: Low-grade intraepithelial neoplasias | ||
| Oral Cavity | 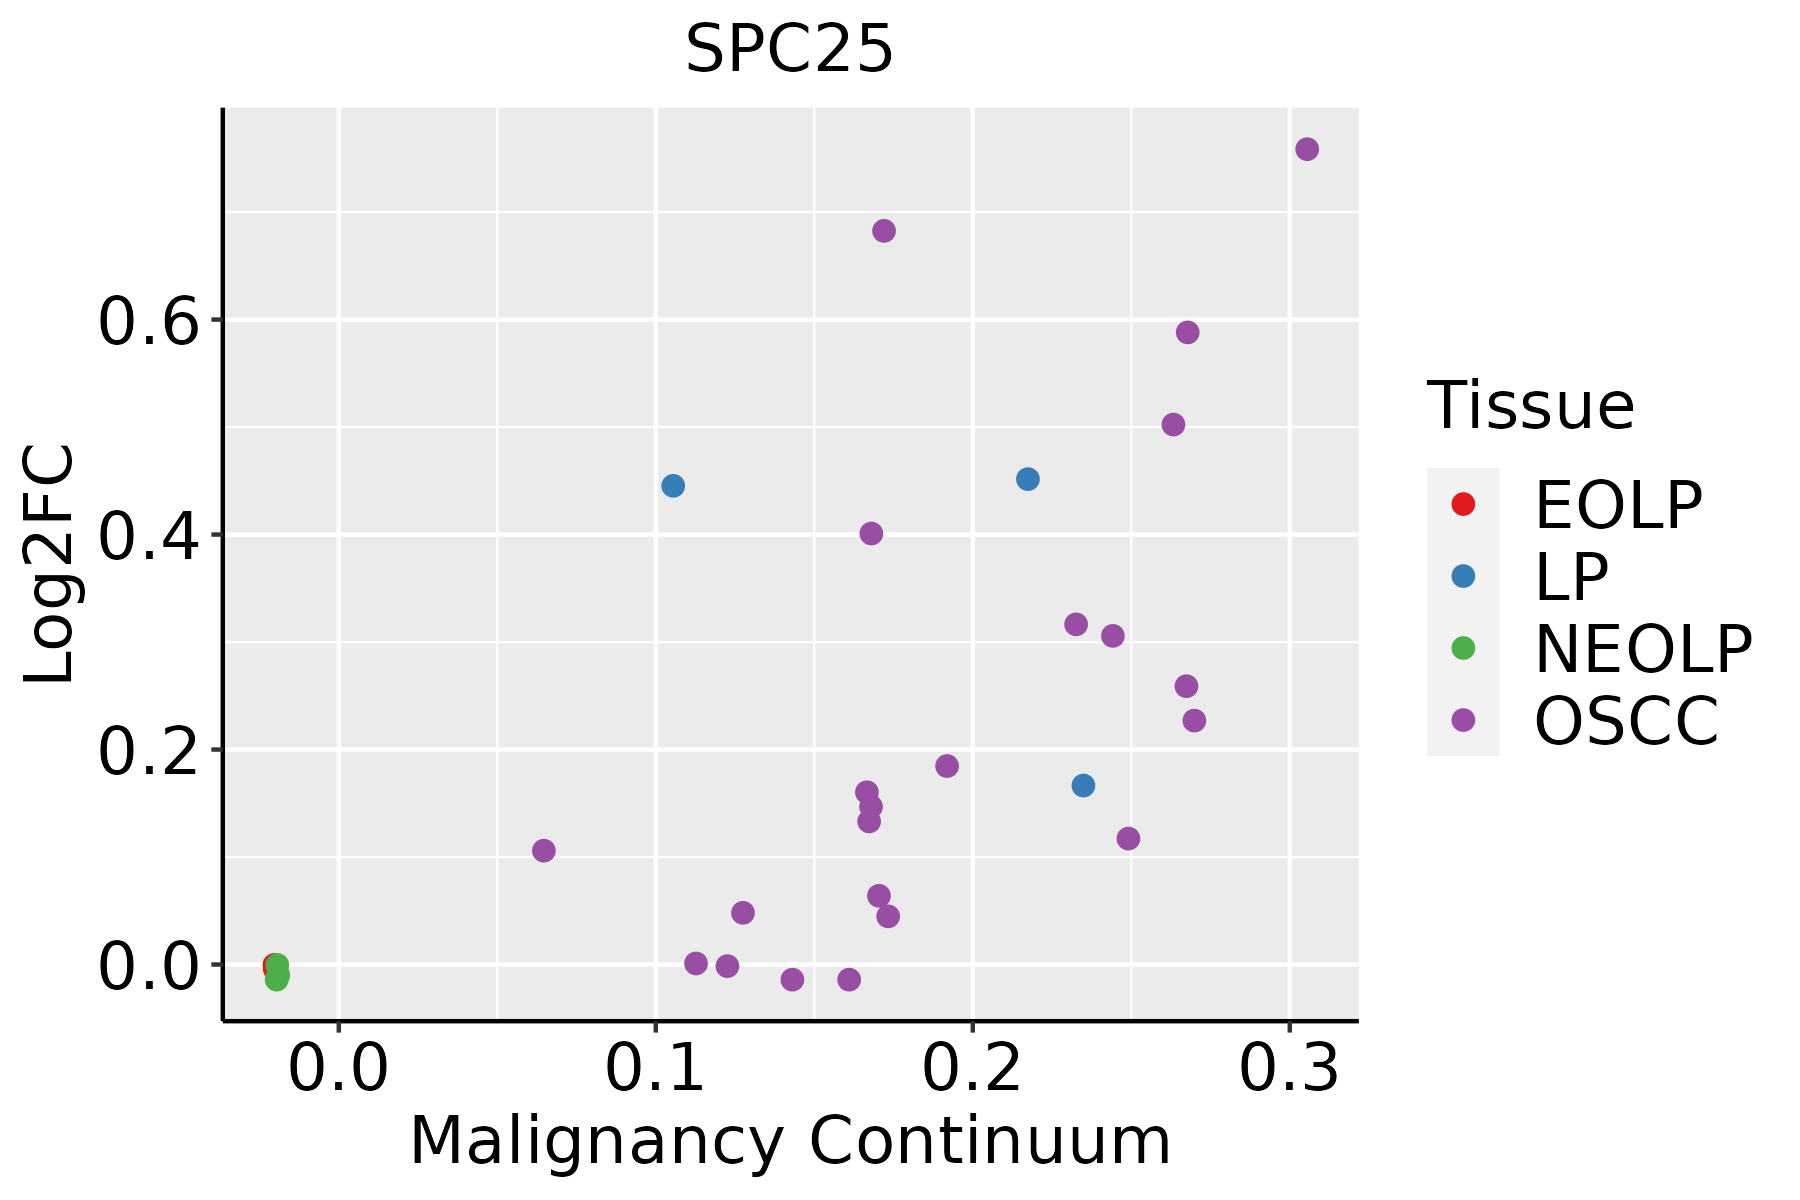 | EOLP: Erosive Oral lichen planus |
| LP: leukoplakia | ||
| NEOLP: Non-erosive oral lichen planus | ||
| OSCC: Oral squamous cell carcinoma | ||
| Skin |  | AK: Actinic keratosis |
| cSCC: Cutaneous squamous cell carcinoma | ||
| SCCIS:squamous cell carcinoma in situ | ||
| Thyroid | 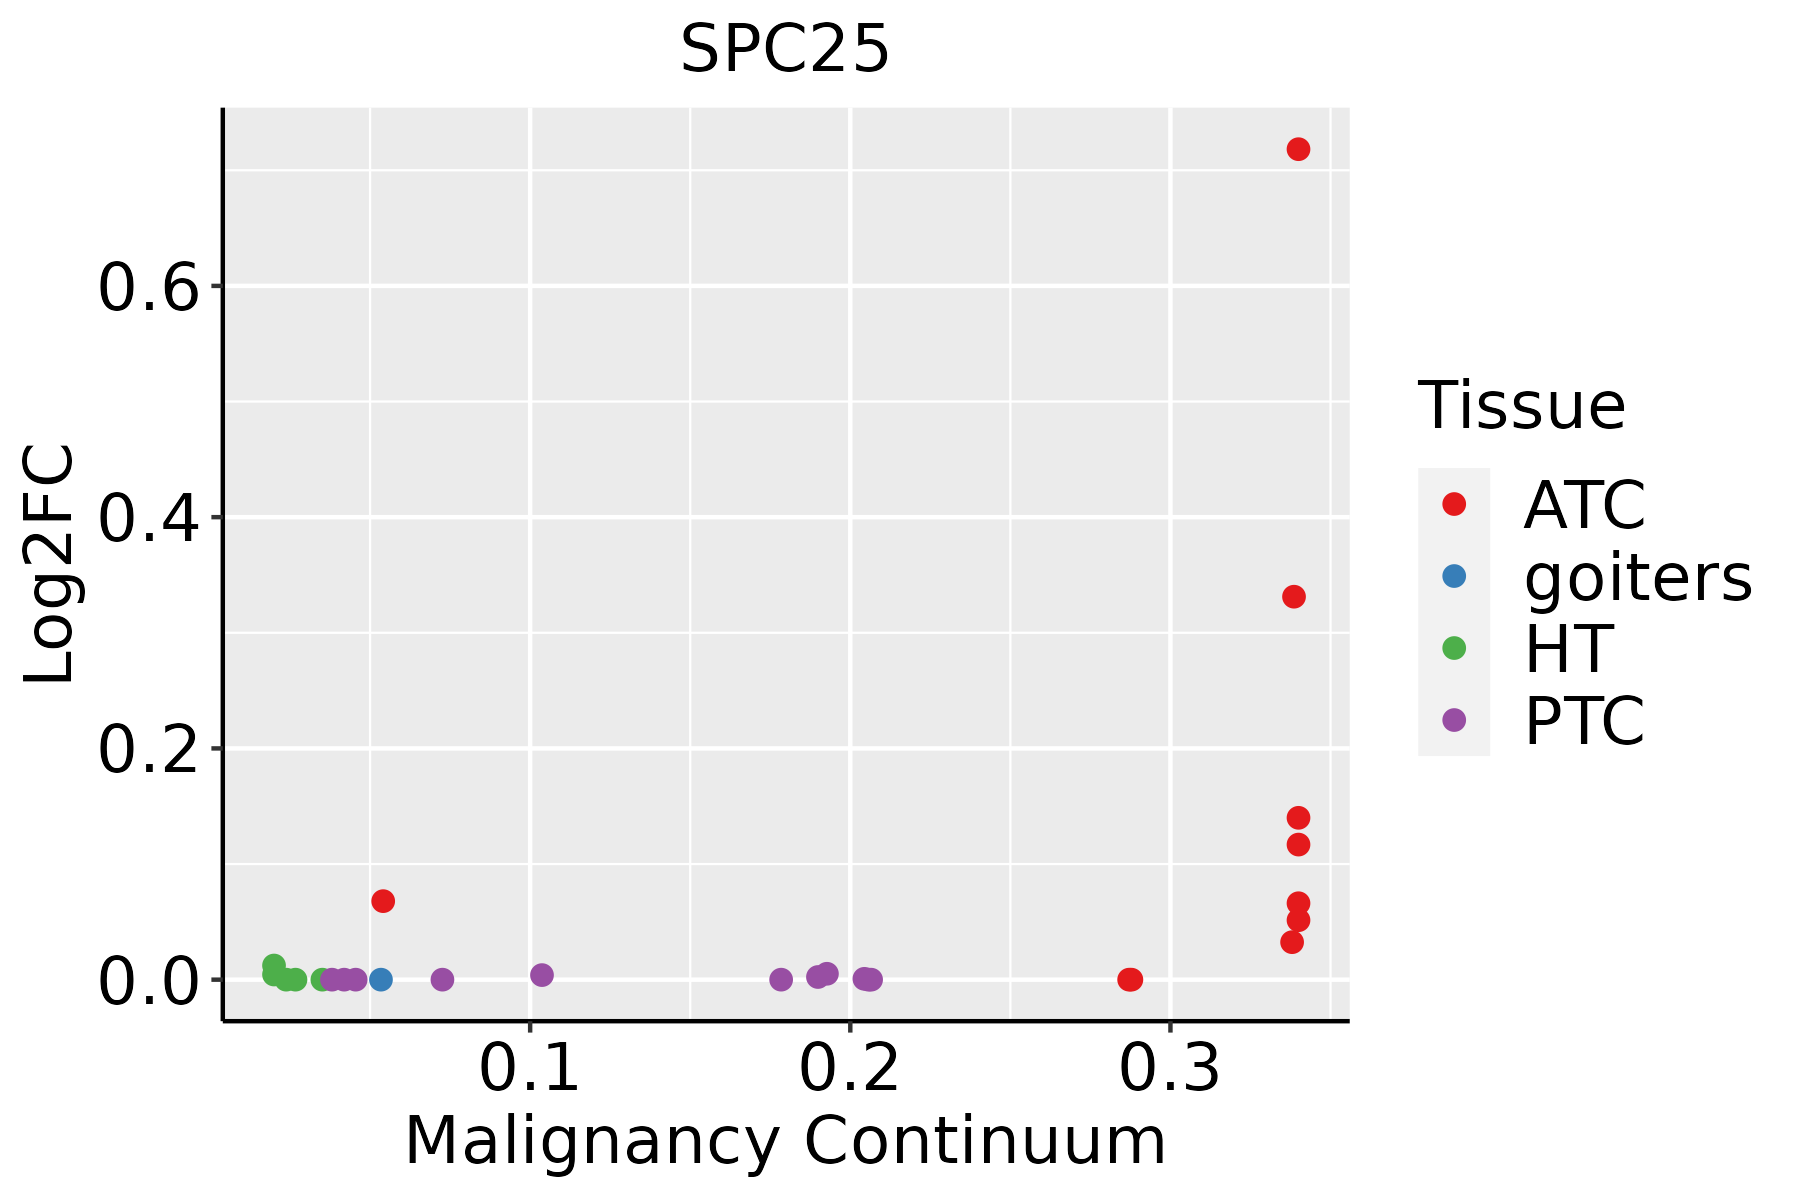 | ATC: Anaplastic thyroid cancer |
| HT: Hashimoto's thyroiditis | ||
| PTC: Papillary thyroid cancer |
| ∗log2FC in expression of this searched gene in stem-like cells from each diseased tissue sample relative to stem-like cells in normal samples in each tissue plotted against the malignancy continuum. Samples are colored based on if they are from different disease stage. |
Top |
Malignant transformation related pathway analysis |
| Find out the enriched GO biological processes and KEGG pathways involved in transition from healthy to precancer to cancer |
| Tissue | Disease Stage | Enriched GO biological Processes |
| Colorectum | AD |  |
| Colorectum | SER |  |
| Colorectum | MSS |  |
| Colorectum | MSI-H |  |
| Colorectum | FAP |  |
| ∗Top 15 enriched GO BP terms are showed in the bar plot of each disease state in each tissue. Each row represents a significant GO biological process which is colored according to the -log10(p.adjust). |
| Page: 1 2 3 4 5 6 7 8 9 |
| GO ID | Tissue | Disease Stage | Description | Gene Ratio | Bg Ratio | pvalue | p.adjust | Count |
| GO:000705911 | Esophagus | ESCC | chromosome segregation | 238/8552 | 346/18723 | 1.72e-18 | 1.82e-16 | 238 |
| GO:190285015 | Esophagus | ESCC | microtubule cytoskeleton organization involved in mitosis | 116/8552 | 147/18723 | 1.25e-16 | 9.91e-15 | 116 |
| GO:000705214 | Esophagus | ESCC | mitotic spindle organization | 97/8552 | 120/18723 | 2.17e-15 | 1.33e-13 | 97 |
| GO:000705114 | Esophagus | ESCC | spindle organization | 134/8552 | 184/18723 | 5.70e-14 | 2.87e-12 | 134 |
| GO:00070592 | Oral cavity | OSCC | chromosome segregation | 206/7305 | 346/18723 | 5.82e-15 | 3.76e-13 | 206 |
| GO:00070526 | Oral cavity | OSCC | mitotic spindle organization | 85/7305 | 120/18723 | 1.44e-12 | 6.23e-11 | 85 |
| GO:19028506 | Oral cavity | OSCC | microtubule cytoskeleton organization involved in mitosis | 99/7305 | 147/18723 | 2.94e-12 | 1.18e-10 | 99 |
| GO:00070517 | Oral cavity | OSCC | spindle organization | 117/7305 | 184/18723 | 1.16e-11 | 4.17e-10 | 117 |
| GO:000705912 | Skin | cSCC | chromosome segregation | 161/4864 | 346/18723 | 8.34e-17 | 8.57e-15 | 161 |
| GO:190285016 | Skin | cSCC | microtubule cytoskeleton organization involved in mitosis | 85/4864 | 147/18723 | 2.66e-16 | 2.39e-14 | 85 |
| GO:000705215 | Skin | cSCC | mitotic spindle organization | 73/4864 | 120/18723 | 7.81e-16 | 6.80e-14 | 73 |
| GO:000705115 | Skin | cSCC | spindle organization | 96/4864 | 184/18723 | 2.59e-14 | 1.77e-12 | 96 |
| GO:190285017 | Thyroid | ATC | microtubule cytoskeleton organization involved in mitosis | 95/6293 | 147/18723 | 1.29e-14 | 7.62e-13 | 95 |
| GO:000705913 | Thyroid | ATC | chromosome segregation | 183/6293 | 346/18723 | 8.03e-14 | 4.23e-12 | 183 |
| GO:000705222 | Thyroid | ATC | mitotic spindle organization | 80/6293 | 120/18723 | 1.27e-13 | 6.46e-12 | 80 |
| GO:000705122 | Thyroid | ATC | spindle organization | 109/6293 | 184/18723 | 7.99e-13 | 3.46e-11 | 109 |
| Page: 1 |
| Pathway ID | Tissue | Disease Stage | Description | Gene Ratio | Bg Ratio | pvalue | p.adjust | qvalue | Count |
| Page: 1 |
Top |
Cell-cell communication analysis |
| Identification of potential cell-cell interactions between two cell types and their ligand-receptor pairs for different disease states |
| Ligand | Receptor | LRpair | Pathway | Tissue | Disease Stage |
| Page: 1 |
Top |
Single-cell gene regulatory network inference analysis |
| Find out the significant the regulons (TFs) and the target genes of each regulon across cell types for different disease states |
| TF | Cell Type | Tissue | Disease Stage | Target Gene | RSS | Regulon Activity |
| ∗The dot plots of a searched regulon are shown for all cell subpopulations in each disease state of each tissue based on the regulon specific score inferred using pySCENIC and by calculating the average expression. |
| Page: 1 |
Top |
Somatic mutation of malignant transformation related genes |
| Annotation of somatic variants for genes involved in malignant transformation |
| Hugo Symbol | Variant Class | Variant Classification | dbSNP RS | HGVSc | HGVSp | HGVSp Short | SWISSPROT | BIOTYPE | SIFT | PolyPhen | Tumor Sample Barcode | Tissue | Histology | Sex | Age | Stage | Therapy Types | Drugs | Outcome |
| SPC25 | SNV | Missense_Mutation | novel | c.410T>C | p.Leu137Ser | p.L137S | Q9HBM1 | protein_coding | deleterious(0) | benign(0.015) | TCGA-2W-A8YY-01 | Cervix | cervical & endocervical cancer | Female | <65 | I/II | Chemotherapy | cisplatin | CR |
| SPC25 | SNV | Missense_Mutation | c.13G>A | p.Glu5Lys | p.E5K | Q9HBM1 | protein_coding | deleterious(0.02) | benign(0.259) | TCGA-AA-3864-01 | Colorectum | colon adenocarcinoma | Male | >=65 | I/II | Unknown | Unknown | SD | |
| SPC25 | SNV | Missense_Mutation | c.13N>A | p.Glu5Lys | p.E5K | Q9HBM1 | protein_coding | deleterious(0.02) | benign(0.259) | TCGA-AZ-4315-01 | Colorectum | colon adenocarcinoma | Male | <65 | I/II | Unknown | Unknown | SD | |
| SPC25 | SNV | Missense_Mutation | novel | c.237G>T | p.Lys79Asn | p.K79N | Q9HBM1 | protein_coding | tolerated(0.12) | benign(0.444) | TCGA-AZ-6605-01 | Colorectum | colon adenocarcinoma | Male | >=65 | III/IV | Chemotherapy | folfox | SD |
| SPC25 | SNV | Missense_Mutation | novel | c.659N>T | p.Ala220Val | p.A220V | Q9HBM1 | protein_coding | deleterious(0) | benign(0.071) | TCGA-AP-A0LM-01 | Endometrium | uterine corpus endometrioid carcinoma | Female | <65 | III/IV | Chemotherapy | cisplatin | SD |
| SPC25 | SNV | Missense_Mutation | rs756310910 | c.19N>A | p.Ala7Thr | p.A7T | Q9HBM1 | protein_coding | tolerated(0.55) | benign(0.005) | TCGA-AX-A05Z-01 | Endometrium | uterine corpus endometrioid carcinoma | Female | <65 | III/IV | Chemotherapy | adriamycin | SD |
| SPC25 | SNV | Missense_Mutation | c.9N>T | p.Glu3Asp | p.E3D | Q9HBM1 | protein_coding | tolerated(0.08) | benign(0.015) | TCGA-D1-A103-01 | Endometrium | uterine corpus endometrioid carcinoma | Female | >=65 | I/II | Unknown | Unknown | SD | |
| SPC25 | SNV | Missense_Mutation | c.609G>T | p.Lys203Asn | p.K203N | Q9HBM1 | protein_coding | deleterious(0) | benign(0.01) | TCGA-50-6590-01 | Lung | lung adenocarcinoma | Female | >=65 | I/II | Chemotherapy | paclitaxel | CR | |
| SPC25 | SNV | Missense_Mutation | c.163N>C | p.Glu55Gln | p.E55Q | Q9HBM1 | protein_coding | deleterious(0.02) | benign(0.193) | TCGA-50-6594-01 | Lung | lung adenocarcinoma | Female | >=65 | III/IV | Unknown | Unknown | PD | |
| SPC25 | insertion | Nonsense_Mutation | novel | c.592_593insTTAAAGTATAATAATAATAAAAACAAGAAAAAA | p.Gln198delinsLeuLysValTerTerTerTerLysGlnGluLysLys | p.Q198delinsLKV****KQEKK | Q9HBM1 | protein_coding | TCGA-IM-A41Z-01 | Thyroid | thyroid carcinoma | Female | <65 | I/II | Hormone Therapy | synthroid | SD |
| Page: 1 |
Top |
Related drugs of malignant transformation related genes |
| Identification of chemicals and drugs interact with genes involved in malignant transfromation |
| (DGIdb 4.0) |
| Entrez ID | Symbol | Category | Interaction Types | Drug Claim Name | Drug Name | PMIDs |
| Page: 1 |

Copyright 2023-Present -The University of Texas Health Science Center at Houston |