
|
|||||
|
 | |
| |
| |
| |
| |
| |
|
Gene: SPATS2L |
Gene summary for SPATS2L |
| Gene information | Species | Human | Gene symbol | SPATS2L | Gene ID | 26010 |
| Gene name | spermatogenesis associated serine rich 2 like | |
| Gene Alias | DNAPTP6 | |
| Cytomap | 2q33.1 | |
| Gene Type | protein-coding | GO ID | GO:0005575 | UniProtAcc | A0A024R3V0 |
Top |
Malignant transformation analysis |
| Identification of the aberrant gene expression in precancerous and cancerous lesions by comparing the gene expression of stem-like cells in diseased tissues with normal stem cells |
| Entrez ID | Symbol | Replicates | Species | Organ | Tissue | Adj P-value | Log2FC | Malignancy |
| 26010 | SPATS2L | CA_HPV_1 | Human | Cervix | CC | 1.95e-06 | -2.96e-01 | 0.0264 |
| 26010 | SPATS2L | CA_HPV_3 | Human | Cervix | CC | 2.55e-04 | 5.79e-02 | 0.0414 |
| 26010 | SPATS2L | CCI_1 | Human | Cervix | CC | 4.64e-03 | -3.78e-02 | 0.528 |
| 26010 | SPATS2L | CCI_2 | Human | Cervix | CC | 7.77e-07 | 1.22e+00 | 0.5249 |
| 26010 | SPATS2L | sample3 | Human | Cervix | CC | 4.04e-05 | 9.94e-02 | 0.1387 |
| 26010 | SPATS2L | L1 | Human | Cervix | CC | 5.19e-08 | -3.98e-01 | 0.0802 |
| 26010 | SPATS2L | T3 | Human | Cervix | CC | 1.40e-04 | 1.27e-01 | 0.1389 |
| 26010 | SPATS2L | HTA11_347_2000001011 | Human | Colorectum | AD | 9.27e-17 | 7.45e-01 | -0.1954 |
| 26010 | SPATS2L | HTA11_411_2000001011 | Human | Colorectum | SER | 2.80e-02 | 9.81e-01 | -0.2602 |
| 26010 | SPATS2L | HTA11_2112_2000001011 | Human | Colorectum | SER | 1.79e-04 | 8.78e-01 | -0.2196 |
| 26010 | SPATS2L | F007 | Human | Colorectum | FAP | 2.68e-03 | -3.51e-01 | 0.1176 |
| 26010 | SPATS2L | A001-C-207 | Human | Colorectum | FAP | 4.66e-02 | -1.59e-01 | 0.1278 |
| 26010 | SPATS2L | A015-C-203 | Human | Colorectum | FAP | 1.26e-24 | -3.99e-01 | -0.1294 |
| 26010 | SPATS2L | A015-C-204 | Human | Colorectum | FAP | 3.48e-07 | -3.52e-01 | -0.0228 |
| 26010 | SPATS2L | A014-C-040 | Human | Colorectum | FAP | 7.58e-03 | -3.58e-01 | -0.1184 |
| 26010 | SPATS2L | A002-C-201 | Human | Colorectum | FAP | 6.85e-15 | -3.62e-01 | 0.0324 |
| 26010 | SPATS2L | A001-C-119 | Human | Colorectum | FAP | 2.87e-10 | -4.45e-01 | -0.1557 |
| 26010 | SPATS2L | A001-C-108 | Human | Colorectum | FAP | 4.95e-15 | -3.63e-01 | -0.0272 |
| 26010 | SPATS2L | A002-C-205 | Human | Colorectum | FAP | 1.10e-21 | -4.70e-01 | -0.1236 |
| 26010 | SPATS2L | A014-C-108 | Human | Colorectum | FAP | 1.83e-02 | -3.40e-01 | -0.124 |
| Page: 1 2 3 4 5 6 7 8 9 10 11 12 |
| Tissue | Expression Dynamics | Abbreviation |
| Cervix |  | CC: Cervix cancer |
| HSIL_HPV: HPV-infected high-grade squamous intraepithelial lesions | ||
| N_HPV: HPV-infected normal cervix | ||
| Colorectum (GSE201348) |  | FAP: Familial adenomatous polyposis |
| CRC: Colorectal cancer | ||
| Colorectum (HTA11) |  | AD: Adenomas |
| SER: Sessile serrated lesions | ||
| MSI-H: Microsatellite-high colorectal cancer | ||
| MSS: Microsatellite stable colorectal cancer | ||
| Esophagus | 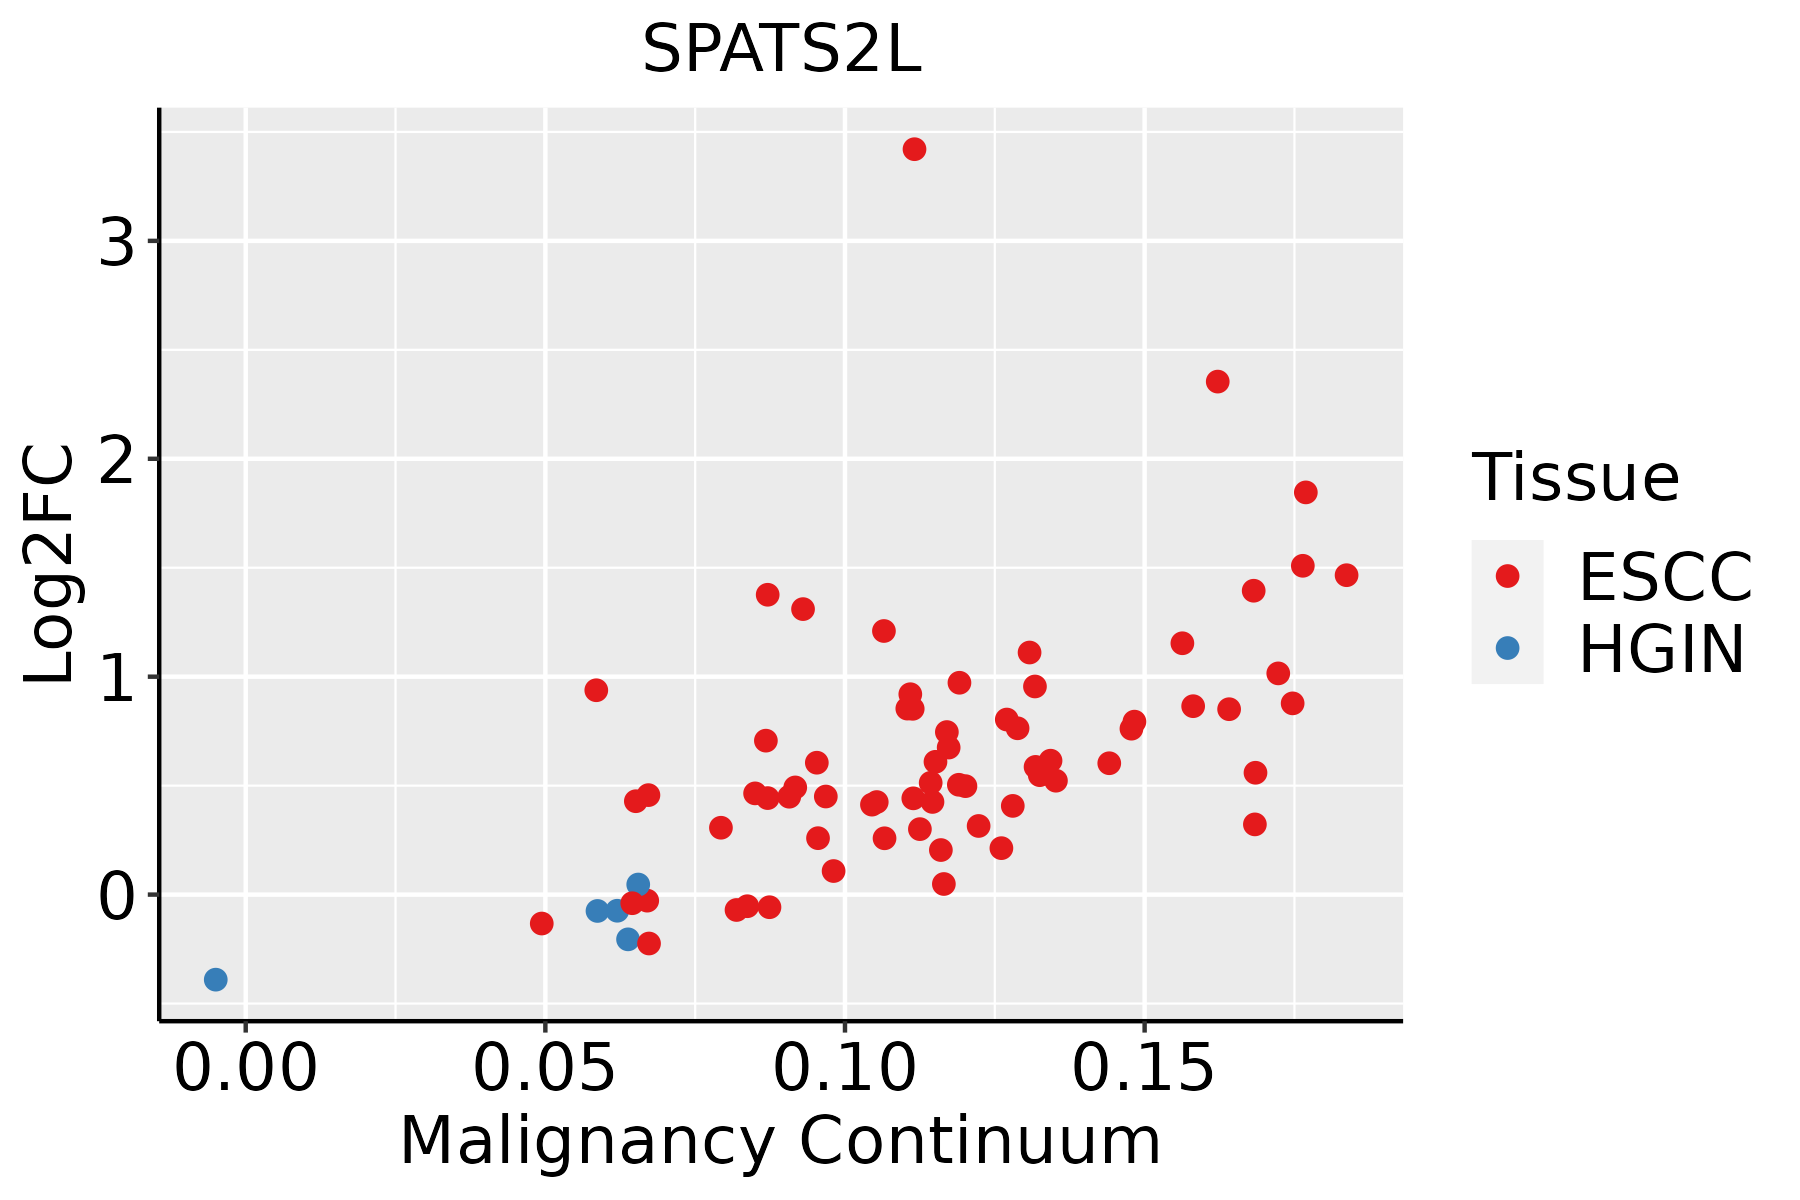 | ESCC: Esophageal squamous cell carcinoma |
| HGIN: High-grade intraepithelial neoplasias | ||
| LGIN: Low-grade intraepithelial neoplasias | ||
| GC | 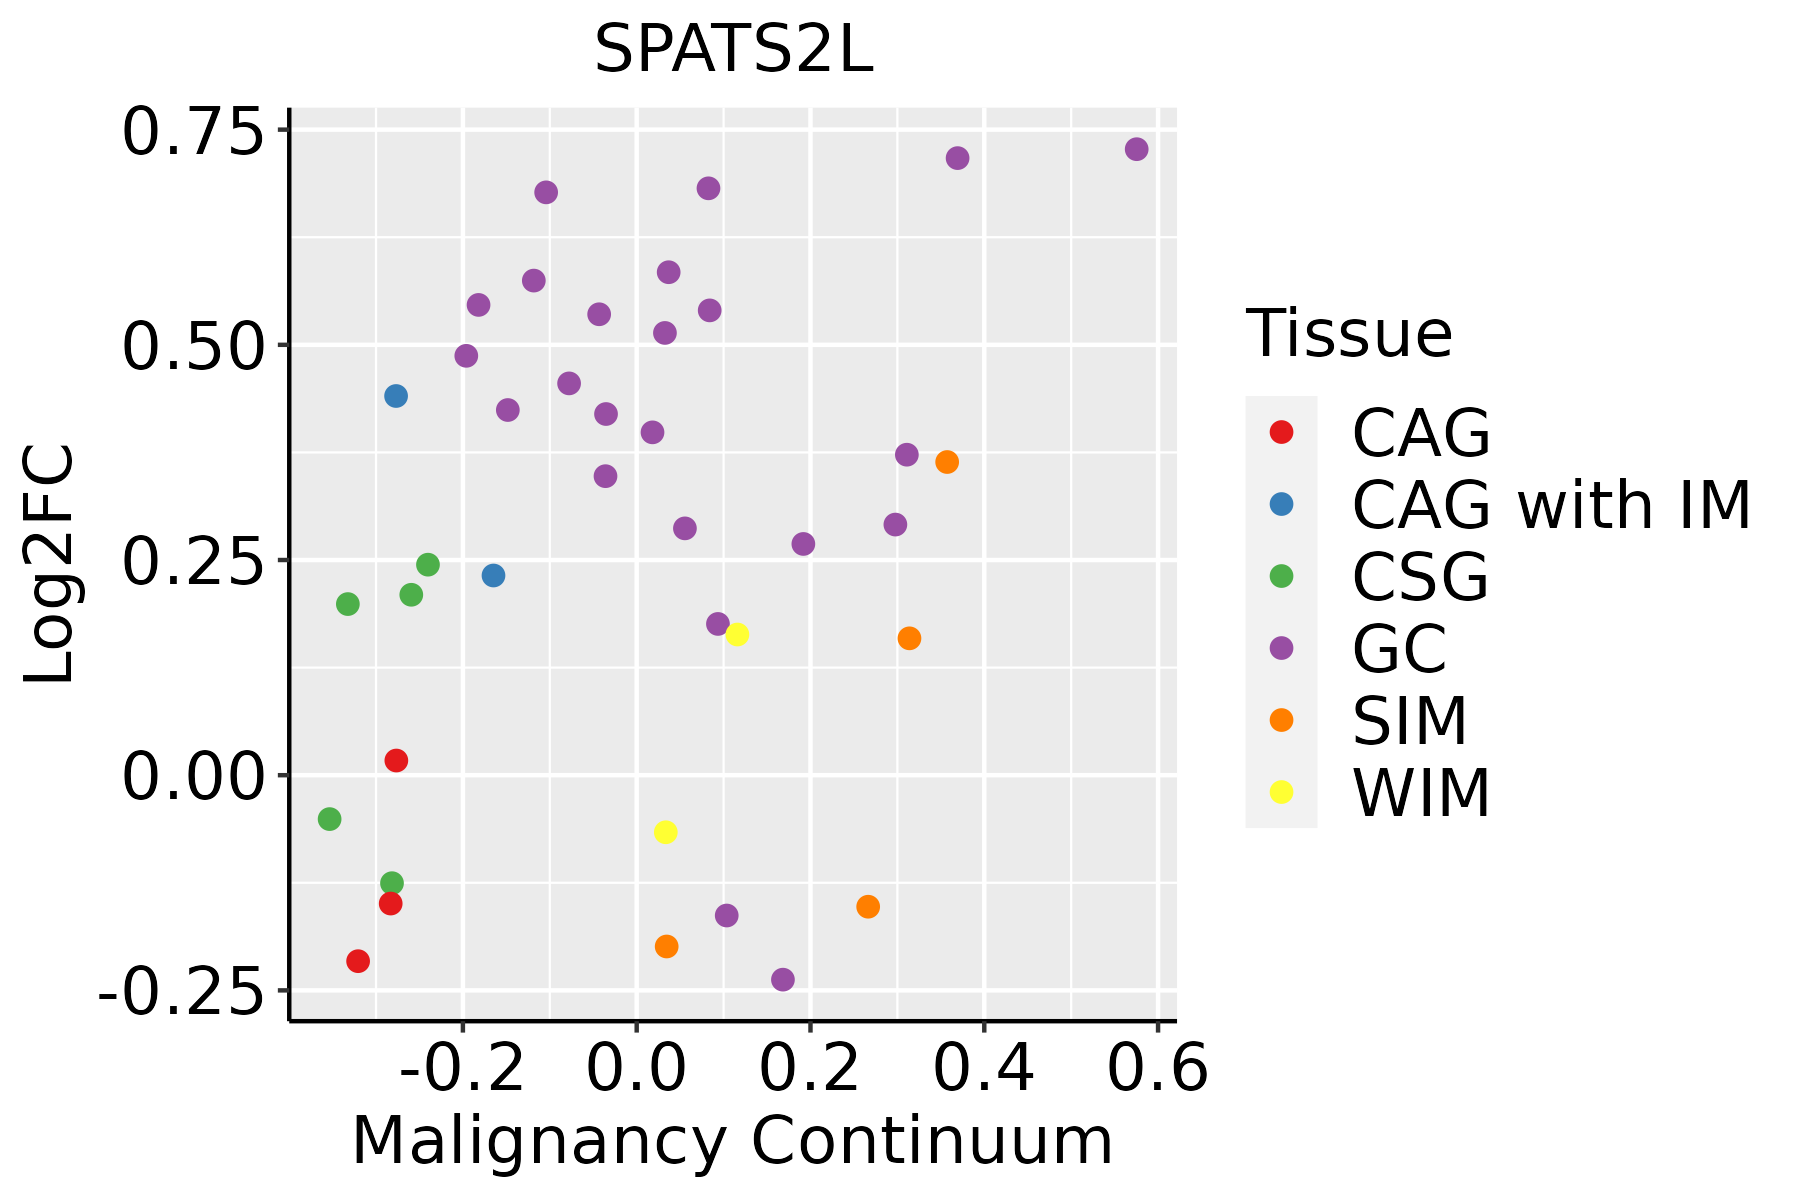 | CAG: Chronic atrophic gastritis |
| CAG with IM: Chronic atrophic gastritis with intestinal metaplasia | ||
| CSG: Chronic superficial gastritis | ||
| GC: Gastric cancer | ||
| SIM: Severe intestinal metaplasia | ||
| WIM: Wild intestinal metaplasia | ||
| Liver | 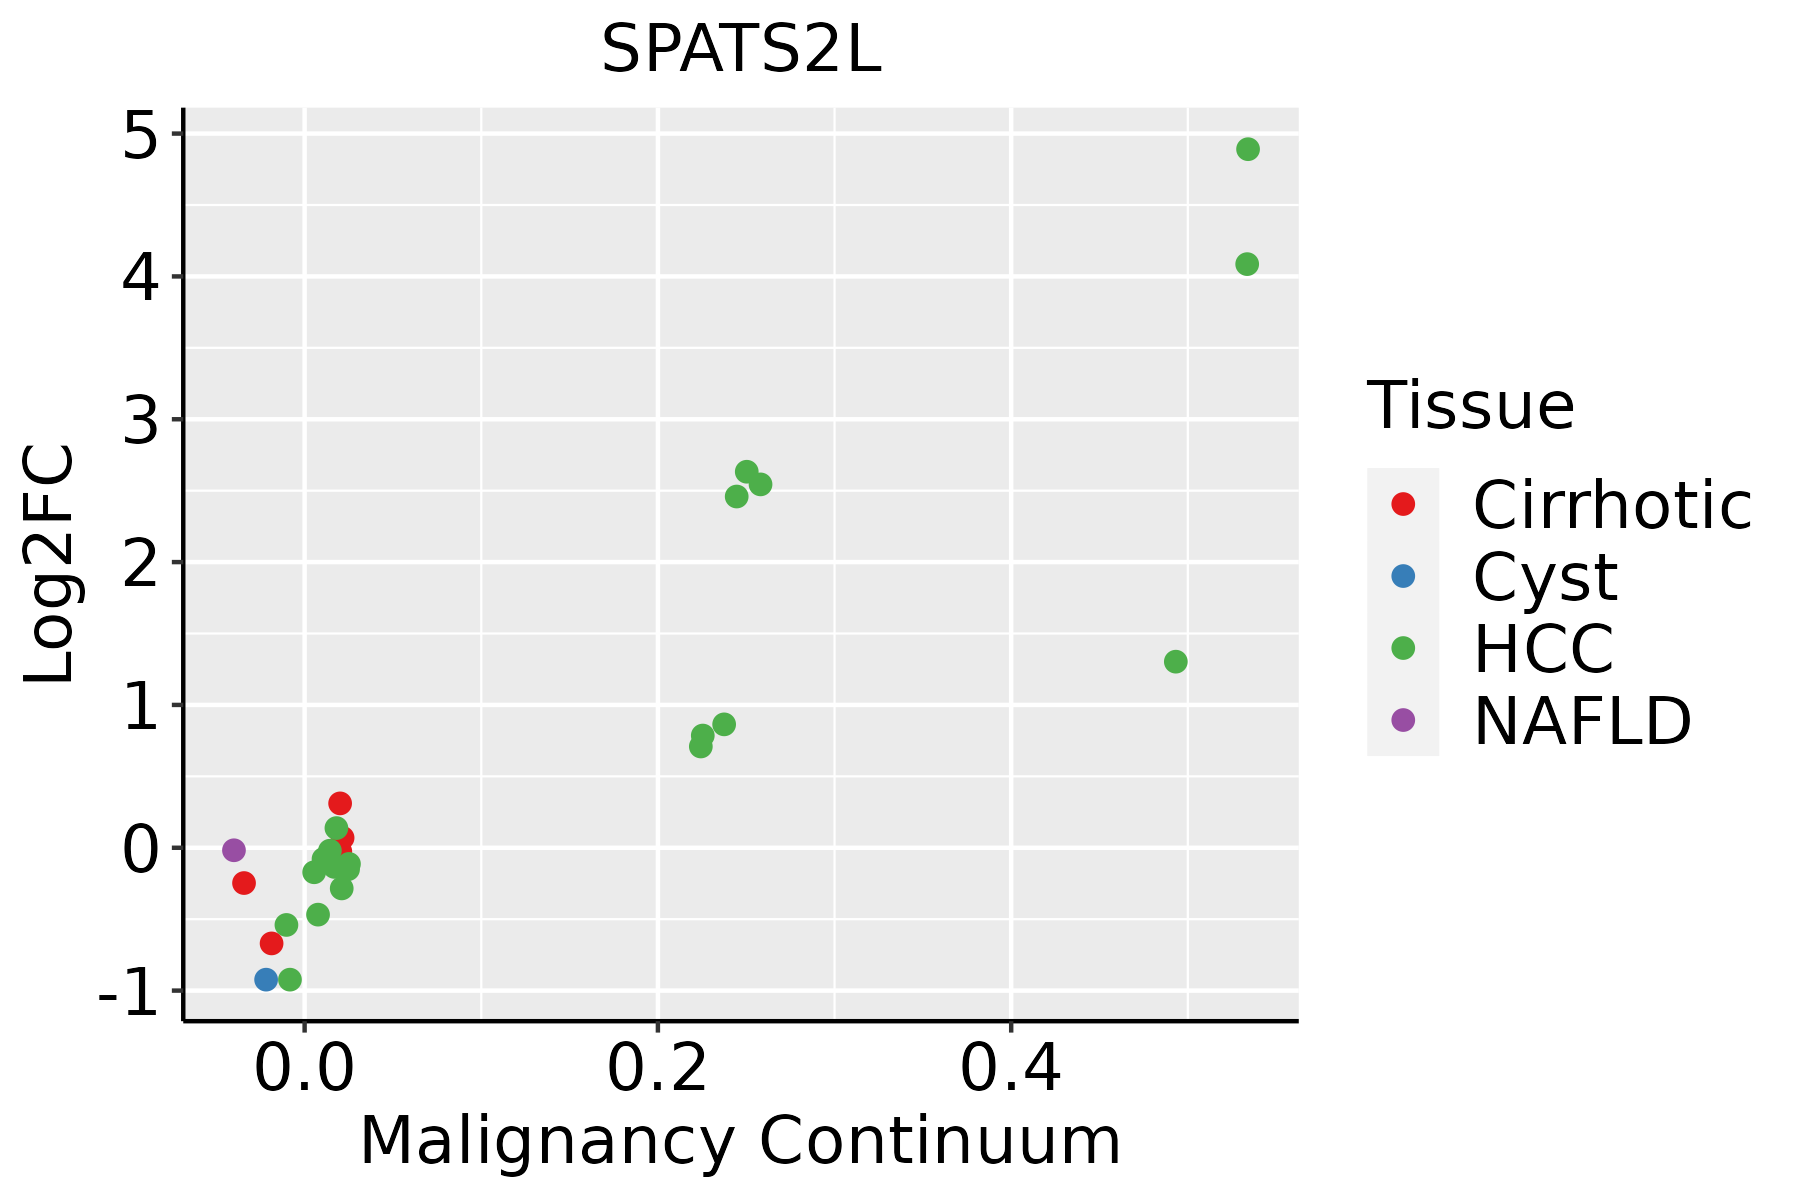 | HCC: Hepatocellular carcinoma |
| NAFLD: Non-alcoholic fatty liver disease | ||
| Lung | 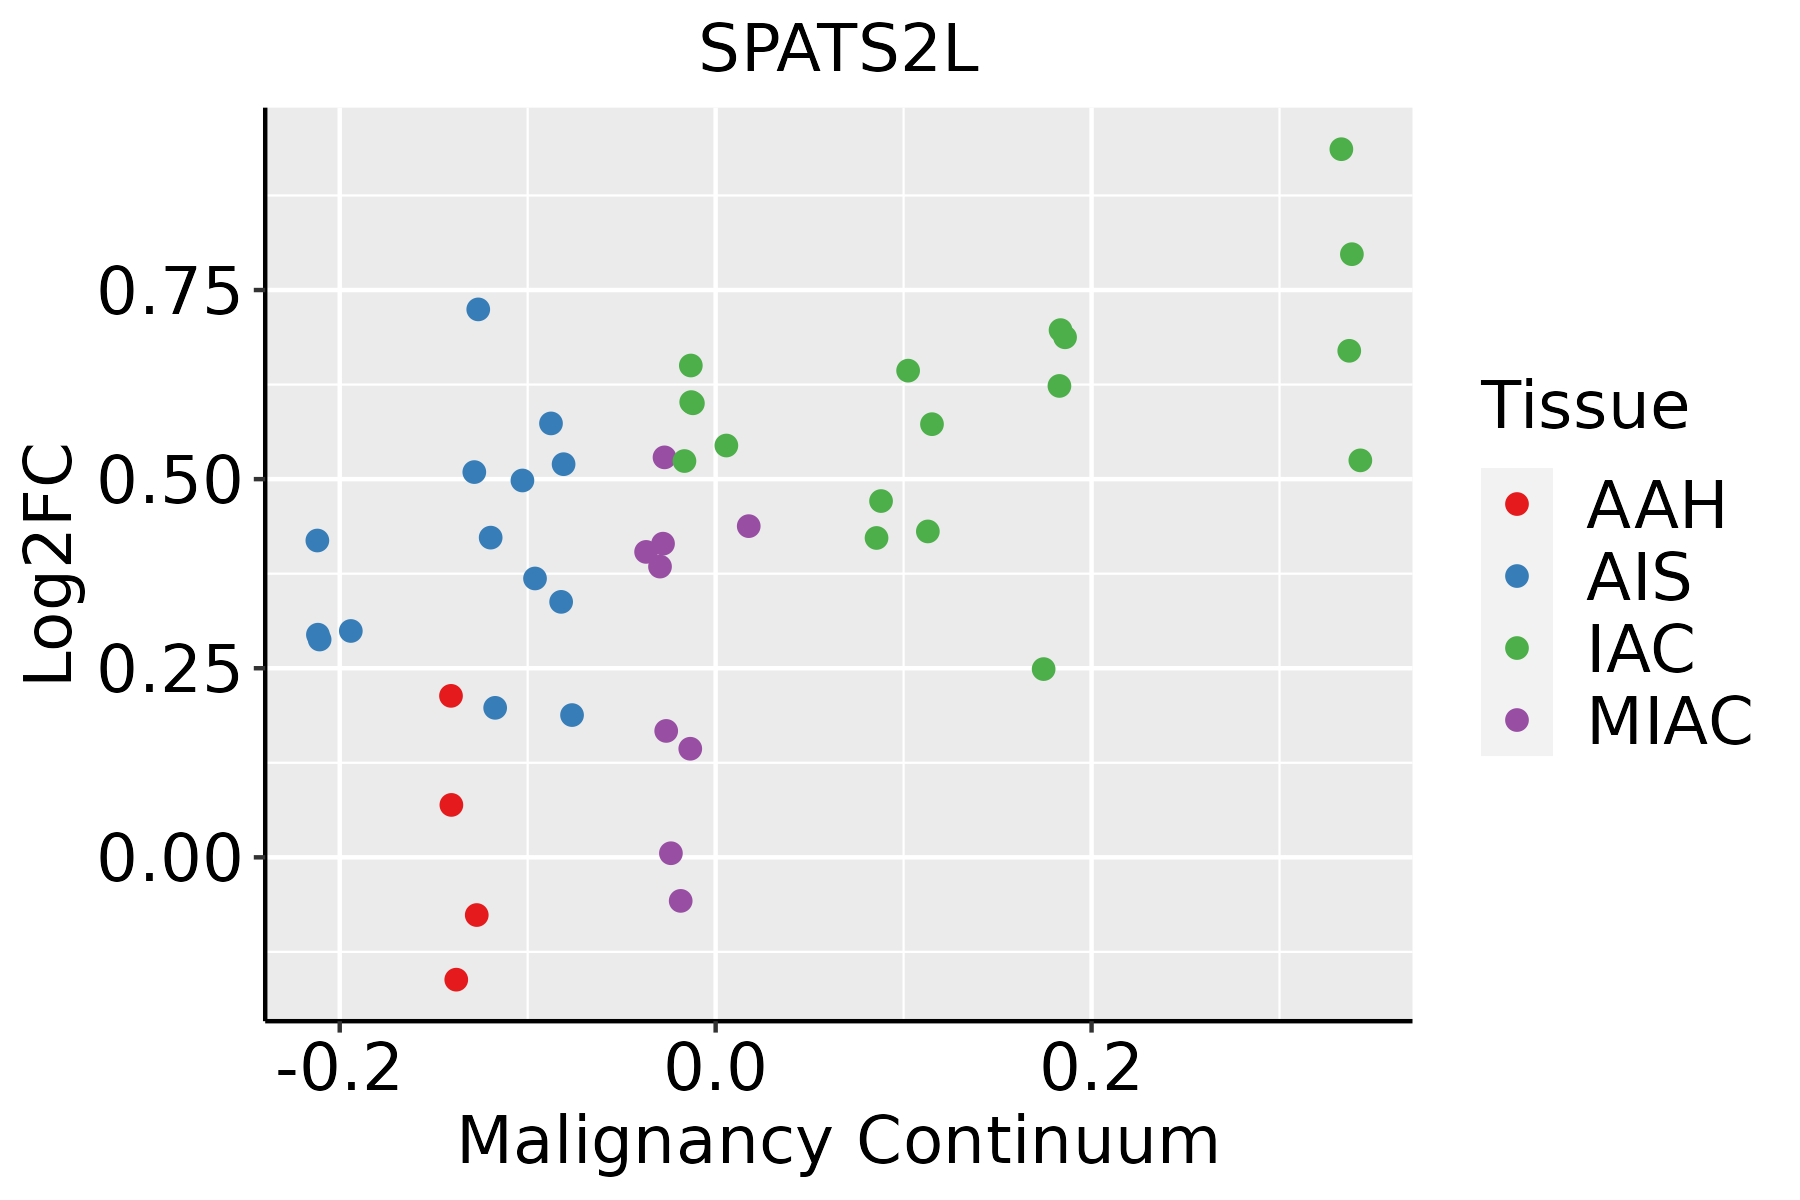 | AAH: Atypical adenomatous hyperplasia |
| AIS: Adenocarcinoma in situ | ||
| IAC: Invasive lung adenocarcinoma | ||
| MIA: Minimally invasive adenocarcinoma | ||
| Oral Cavity | 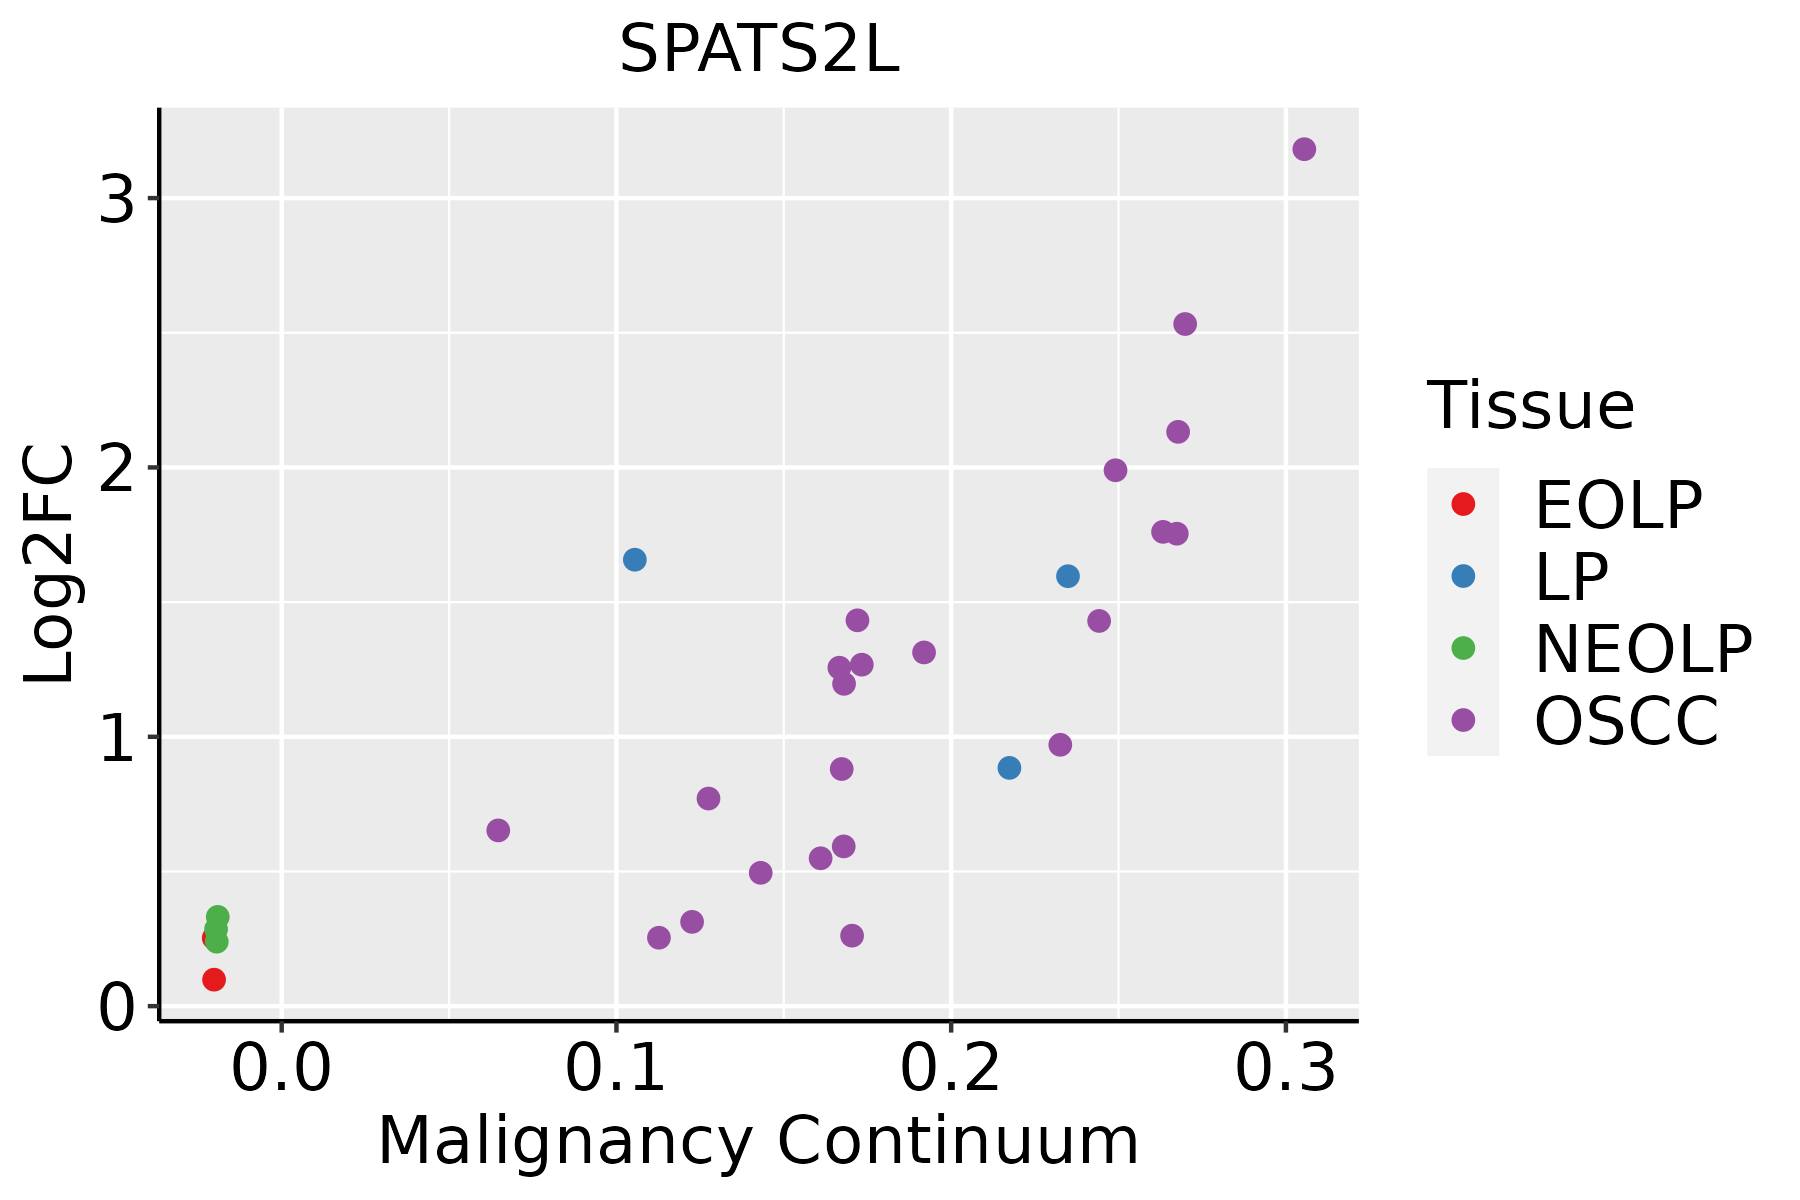 | EOLP: Erosive Oral lichen planus |
| LP: leukoplakia | ||
| NEOLP: Non-erosive oral lichen planus | ||
| OSCC: Oral squamous cell carcinoma | ||
| Prostate | 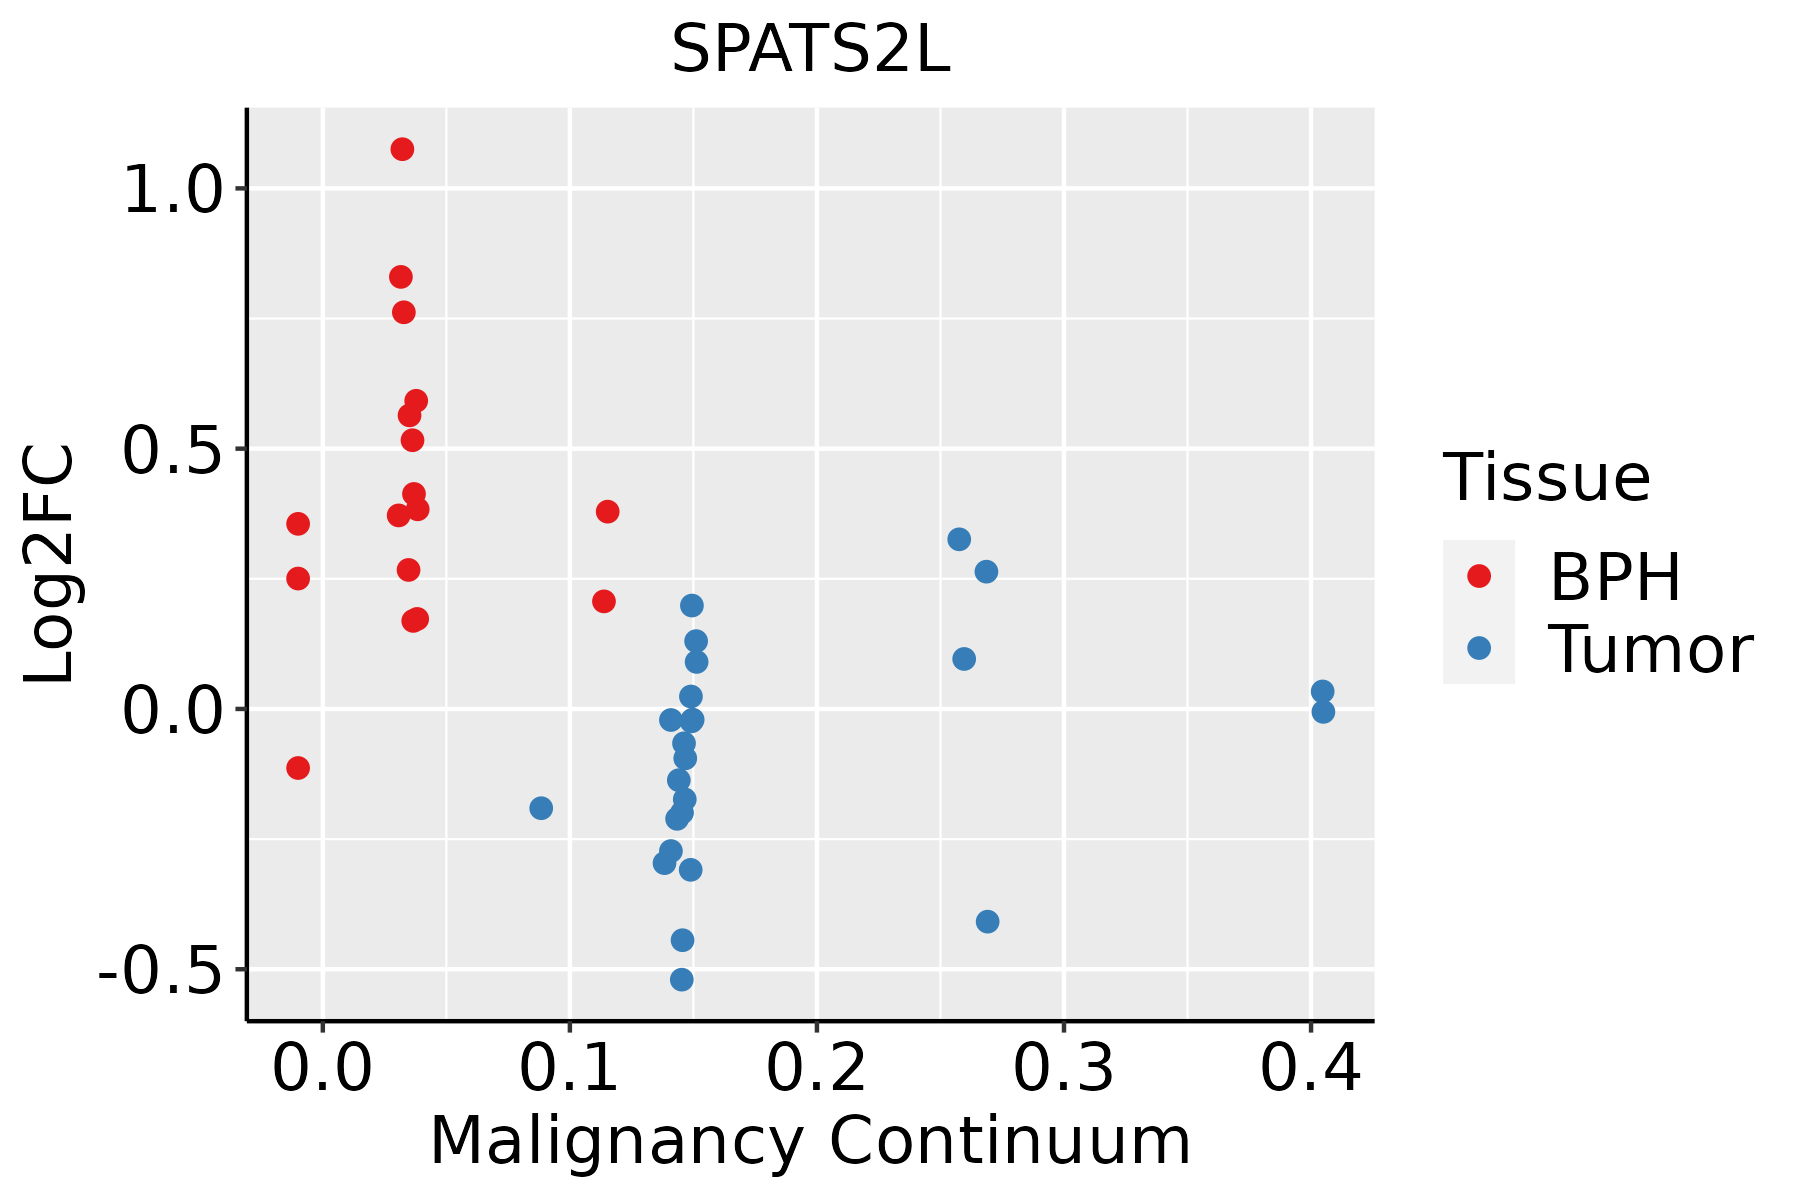 | BPH: Benign Prostatic Hyperplasia |
| Skin |  | AK: Actinic keratosis |
| cSCC: Cutaneous squamous cell carcinoma | ||
| SCCIS:squamous cell carcinoma in situ | ||
| Thyroid |  | ATC: Anaplastic thyroid cancer |
| HT: Hashimoto's thyroiditis | ||
| PTC: Papillary thyroid cancer |
| ∗log2FC in expression of this searched gene in stem-like cells from each diseased tissue sample relative to stem-like cells in normal samples in each tissue plotted against the malignancy continuum. Samples are colored based on if they are from different disease stage. |
Top |
Malignant transformation related pathway analysis |
| Find out the enriched GO biological processes and KEGG pathways involved in transition from healthy to precancer to cancer |
| Tissue | Disease Stage | Enriched GO biological Processes |
| Colorectum | AD |  |
| Colorectum | SER |  |
| Colorectum | MSS |  |
| Colorectum | MSI-H |  |
| Colorectum | FAP |  |
| ∗Top 15 enriched GO BP terms are showed in the bar plot of each disease state in each tissue. Each row represents a significant GO biological process which is colored according to the -log10(p.adjust). |
| Page: 1 2 3 4 5 6 7 8 9 |
| GO ID | Tissue | Disease Stage | Description | Gene Ratio | Bg Ratio | pvalue | p.adjust | Count |
| Page: 1 |
| Pathway ID | Tissue | Disease Stage | Description | Gene Ratio | Bg Ratio | pvalue | p.adjust | qvalue | Count |
| Page: 1 |
Top |
Cell-cell communication analysis |
| Identification of potential cell-cell interactions between two cell types and their ligand-receptor pairs for different disease states |
| Ligand | Receptor | LRpair | Pathway | Tissue | Disease Stage |
| Page: 1 |
Top |
Single-cell gene regulatory network inference analysis |
| Find out the significant the regulons (TFs) and the target genes of each regulon across cell types for different disease states |
| TF | Cell Type | Tissue | Disease Stage | Target Gene | RSS | Regulon Activity |
| ∗The dot plots of a searched regulon are shown for all cell subpopulations in each disease state of each tissue based on the regulon specific score inferred using pySCENIC and by calculating the average expression. |
| Page: 1 |
Top |
Somatic mutation of malignant transformation related genes |
| Annotation of somatic variants for genes involved in malignant transformation |
| Hugo Symbol | Variant Class | Variant Classification | dbSNP RS | HGVSc | HGVSp | HGVSp Short | SWISSPROT | BIOTYPE | SIFT | PolyPhen | Tumor Sample Barcode | Tissue | Histology | Sex | Age | Stage | Therapy Types | Drugs | Outcome |
| SPATS2L | SNV | Missense_Mutation | c.754N>A | p.Glu252Lys | p.E252K | Q9NUQ6 | protein_coding | deleterious(0.03) | probably_damaging(0.995) | TCGA-A2-A0YD-01 | Breast | breast invasive carcinoma | Female | <65 | I/II | Chemotherapy | cytoxan | SD | |
| SPATS2L | SNV | Missense_Mutation | novel | c.1331C>A | p.Thr444Asn | p.T444N | Q9NUQ6 | protein_coding | tolerated(0.69) | benign(0.092) | TCGA-2W-A8YY-01 | Cervix | cervical & endocervical cancer | Female | <65 | I/II | Chemotherapy | cisplatin | CR |
| SPATS2L | SNV | Missense_Mutation | novel | c.1592N>T | p.Ala531Val | p.A531V | Q9NUQ6 | protein_coding | tolerated_low_confidence(0.36) | benign(0.024) | TCGA-C5-A905-01 | Cervix | cervical & endocervical cancer | Female | <65 | I/II | Unknown | Unknown | SD |
| SPATS2L | SNV | Missense_Mutation | c.754G>C | p.Glu252Gln | p.E252Q | Q9NUQ6 | protein_coding | deleterious(0) | probably_damaging(0.996) | TCGA-EK-A2PG-01 | Cervix | cervical & endocervical cancer | Female | >=65 | I/II | Unknown | Unknown | SD | |
| SPATS2L | SNV | Missense_Mutation | c.325N>G | p.Gln109Glu | p.Q109E | Q9NUQ6 | protein_coding | tolerated(0.65) | probably_damaging(0.981) | TCGA-Q1-A73O-01 | Cervix | cervical & endocervical cancer | Female | <65 | I/II | Chemotherapy | cisplatin | CR | |
| SPATS2L | SNV | Missense_Mutation | novel | c.273G>C | p.Met91Ile | p.M91I | Q9NUQ6 | protein_coding | tolerated(0.13) | possibly_damaging(0.847) | TCGA-VS-A9UH-01 | Cervix | cervical & endocervical cancer | Female | <65 | I/II | Chemotherapy | cisplatin | CR |
| SPATS2L | SNV | Missense_Mutation | rs370727542 | c.787N>A | p.Val263Ile | p.V263I | Q9NUQ6 | protein_coding | tolerated(0.06) | probably_damaging(0.993) | TCGA-AA-3492-01 | Colorectum | colon adenocarcinoma | Female | >=65 | I/II | Unknown | Unknown | SD |
| SPATS2L | SNV | Missense_Mutation | rs751577050 | c.1217C>T | p.Ala406Val | p.A406V | Q9NUQ6 | protein_coding | tolerated(0.09) | benign(0.001) | TCGA-AA-3864-01 | Colorectum | colon adenocarcinoma | Male | >=65 | I/II | Unknown | Unknown | SD |
| SPATS2L | SNV | Missense_Mutation | rs368871834 | c.457G>A | p.Glu153Lys | p.E153K | Q9NUQ6 | protein_coding | deleterious(0.01) | possibly_damaging(0.448) | TCGA-AD-6895-01 | Colorectum | colon adenocarcinoma | Male | >=65 | III/IV | Unknown | Unknown | SD |
| SPATS2L | SNV | Missense_Mutation | c.1459A>G | p.Asn487Asp | p.N487D | Q9NUQ6 | protein_coding | tolerated(0.12) | benign(0.339) | TCGA-AD-A5EJ-01 | Colorectum | colon adenocarcinoma | Female | >=65 | I/II | Unknown | Unknown | SD |
| Page: 1 2 3 4 5 6 7 |
Top |
Related drugs of malignant transformation related genes |
| Identification of chemicals and drugs interact with genes involved in malignant transfromation |
| (DGIdb 4.0) |
| Entrez ID | Symbol | Category | Interaction Types | Drug Claim Name | Drug Name | PMIDs |
| Page: 1 |

Copyright 2023-Present -The University of Texas Health Science Center at Houston |