
|
|||||
|
 | |
| |
| |
| |
| |
| |
|
Gene: SPATA6L |
Gene summary for SPATA6L |
| Gene information | Species | Human | Gene symbol | SPATA6L | Gene ID | 55064 |
| Gene name | spermatogenesis associated 6 like | |
| Gene Alias | C9orf68 | |
| Cytomap | 9p24.2-p24.1 | |
| Gene Type | protein-coding | GO ID | GO:0000003 | UniProtAcc | Q8N4H0 |
Top |
Malignant transformation analysis |
| Identification of the aberrant gene expression in precancerous and cancerous lesions by comparing the gene expression of stem-like cells in diseased tissues with normal stem cells |
| Entrez ID | Symbol | Replicates | Species | Organ | Tissue | Adj P-value | Log2FC | Malignancy |
| 55064 | SPATA6L | RNA-P25T1-P25T1-4 | Human | Lung | AIS | 2.50e-02 | 3.29e-01 | -0.2119 |
| 55064 | SPATA6L | RNA-P3T-P3T-1 | Human | Lung | IAC | 3.25e-02 | 4.01e-01 | 0.1829 |
| 55064 | SPATA6L | RNA-P3T-P3T-4 | Human | Lung | IAC | 5.64e-05 | 5.31e-01 | 0.1859 |
| 55064 | SPATA6L | RNA-P6T1-P6T1-2 | Human | Lung | MIAC | 5.19e-03 | 6.15e-01 | -0.0186 |
| 55064 | SPATA6L | RNA-P6T1-P6T1-4 | Human | Lung | MIAC | 2.59e-05 | 7.30e-01 | -0.0263 |
| 55064 | SPATA6L | RNA-P6T2-P6T2-1 | Human | Lung | IAC | 1.86e-09 | 4.46e-01 | -0.0166 |
| 55064 | SPATA6L | RNA-P6T2-P6T2-2 | Human | Lung | IAC | 1.01e-18 | 5.99e-01 | -0.0132 |
| 55064 | SPATA6L | RNA-P6T2-P6T2-3 | Human | Lung | IAC | 9.47e-17 | 5.06e-01 | -0.013 |
| 55064 | SPATA6L | RNA-P6T2-P6T2-4 | Human | Lung | IAC | 1.41e-08 | 4.53e-01 | -0.0121 |
| 55064 | SPATA6L | RNA-P7T1-P7T1-1 | Human | Lung | AIS | 7.49e-09 | 7.41e-01 | -0.0961 |
| 55064 | SPATA6L | RNA-P7T1-P7T1-2 | Human | Lung | AIS | 5.61e-09 | 6.73e-01 | -0.0876 |
| 55064 | SPATA6L | RNA-P7T1-P7T1-3 | Human | Lung | AIS | 2.26e-11 | 8.27e-01 | -0.0822 |
| 55064 | SPATA6L | RNA-P7T1-P7T1-4 | Human | Lung | AIS | 3.21e-09 | 7.62e-01 | -0.0809 |
| 55064 | SPATA6L | HTA12-15-2 | Human | Pancreas | PDAC | 4.47e-05 | 3.43e-01 | 0.2315 |
| 55064 | SPATA6L | HTA12-23-1 | Human | Pancreas | PDAC | 2.25e-04 | 5.31e-01 | 0.3405 |
| 55064 | SPATA6L | HTA12-25-1 | Human | Pancreas | PDAC | 2.41e-10 | 6.34e-01 | 0.313 |
| 55064 | SPATA6L | HTA12-26-1 | Human | Pancreas | PDAC | 1.01e-13 | 6.27e-01 | 0.3728 |
| 55064 | SPATA6L | HTA12-29-1 | Human | Pancreas | PDAC | 6.45e-37 | 7.22e-01 | 0.3722 |
| 55064 | SPATA6L | HTA12-30-1 | Human | Pancreas | PDAC | 1.14e-02 | 8.88e-01 | 0.3671 |
| 55064 | SPATA6L | HTA12-32-1 | Human | Pancreas | PDAC | 4.65e-02 | 4.83e-01 | 0.3624 |
| Page: 1 |
| Tissue | Expression Dynamics | Abbreviation |
| Lung | 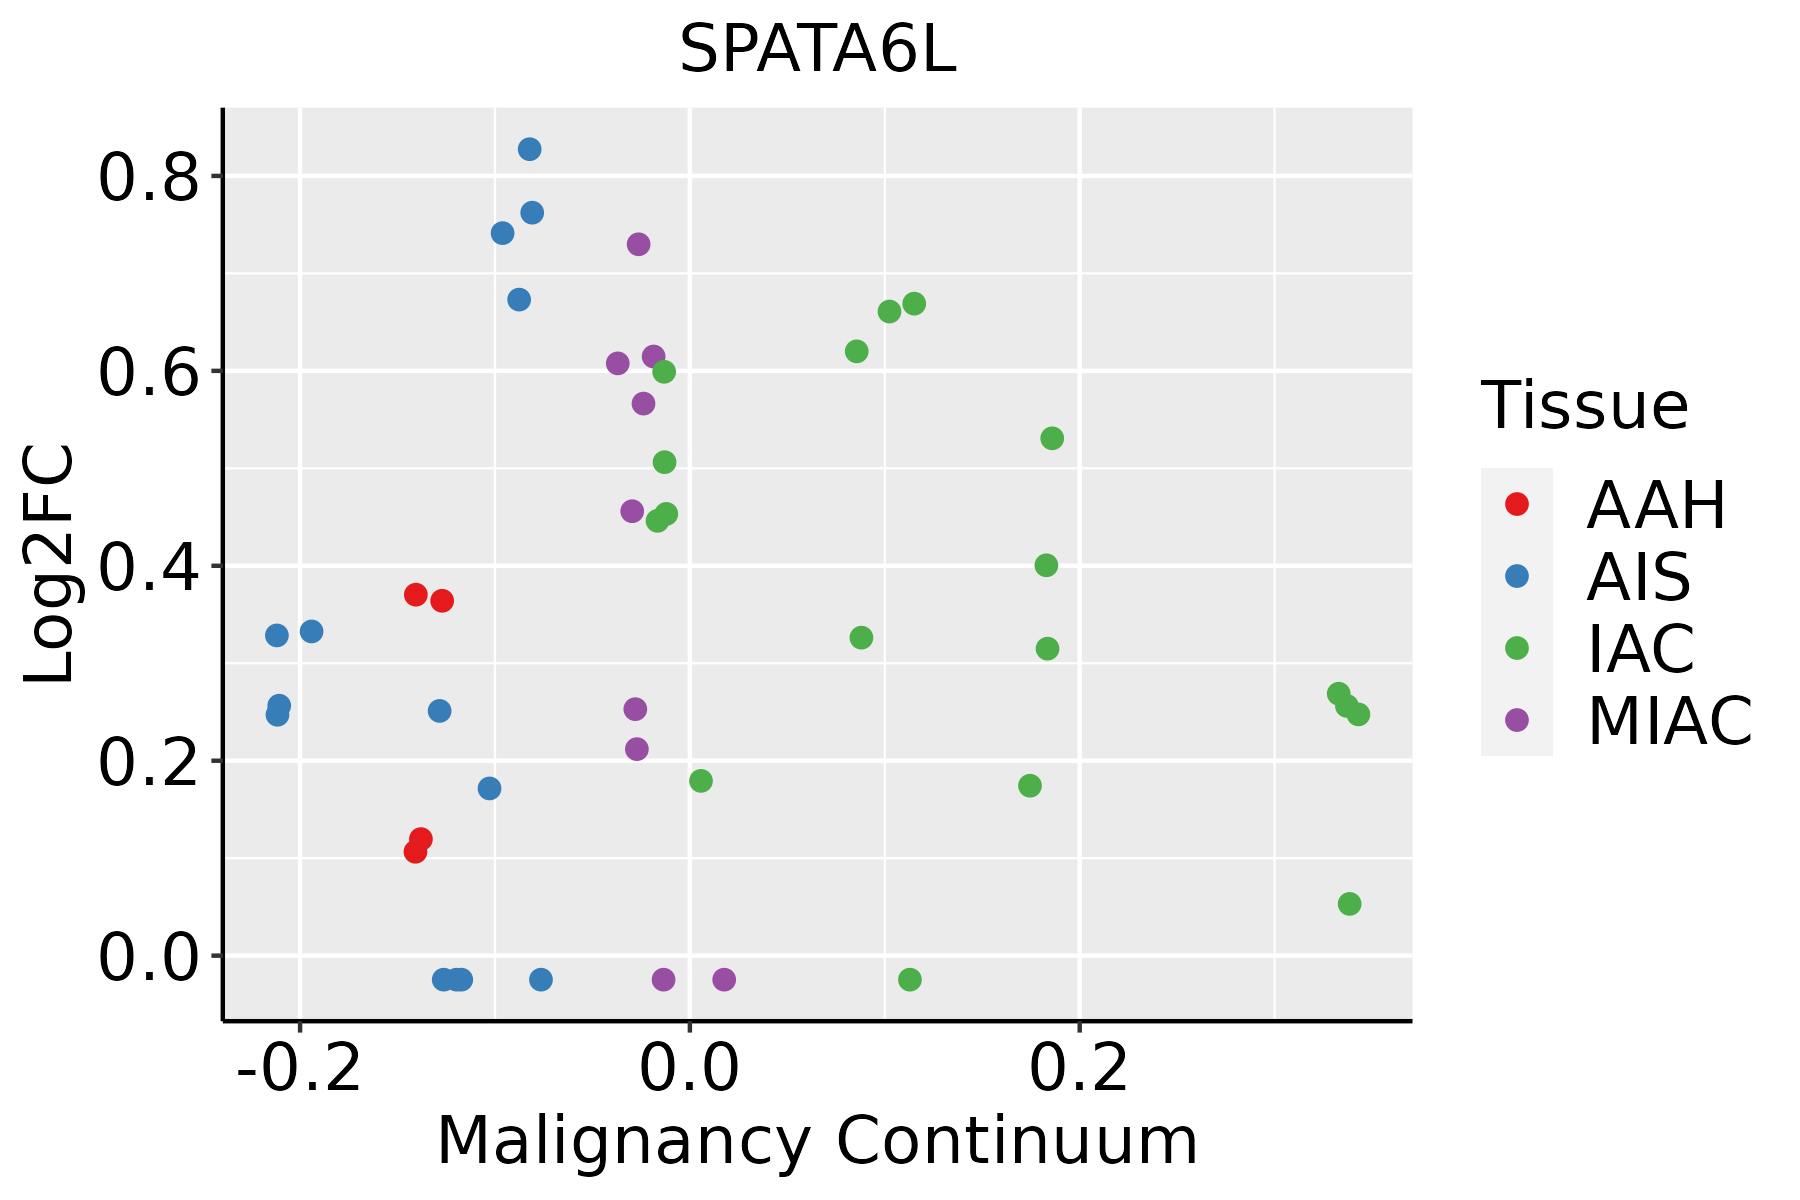 | AAH: Atypical adenomatous hyperplasia |
| AIS: Adenocarcinoma in situ | ||
| IAC: Invasive lung adenocarcinoma | ||
| MIA: Minimally invasive adenocarcinoma |
| ∗log2FC in expression of this searched gene in stem-like cells from each diseased tissue sample relative to stem-like cells in normal samples in each tissue plotted against the malignancy continuum. Samples are colored based on if they are from different disease stage. |
Top |
Malignant transformation related pathway analysis |
| Find out the enriched GO biological processes and KEGG pathways involved in transition from healthy to precancer to cancer |
| Tissue | Disease Stage | Enriched GO biological Processes |
| Colorectum | AD |  |
| Colorectum | SER |  |
| Colorectum | MSS |  |
| Colorectum | MSI-H |  |
| Colorectum | FAP |  |
| ∗Top 15 enriched GO BP terms are showed in the bar plot of each disease state in each tissue. Each row represents a significant GO biological process which is colored according to the -log10(p.adjust). |
| Page: 1 2 3 4 5 6 7 8 9 |
| GO ID | Tissue | Disease Stage | Description | Gene Ratio | Bg Ratio | pvalue | p.adjust | Count |
| Page: 1 |
| Pathway ID | Tissue | Disease Stage | Description | Gene Ratio | Bg Ratio | pvalue | p.adjust | qvalue | Count |
| Page: 1 |
Top |
Cell-cell communication analysis |
| Identification of potential cell-cell interactions between two cell types and their ligand-receptor pairs for different disease states |
| Ligand | Receptor | LRpair | Pathway | Tissue | Disease Stage |
| Page: 1 |
Top |
Single-cell gene regulatory network inference analysis |
| Find out the significant the regulons (TFs) and the target genes of each regulon across cell types for different disease states |
| TF | Cell Type | Tissue | Disease Stage | Target Gene | RSS | Regulon Activity |
| ∗The dot plots of a searched regulon are shown for all cell subpopulations in each disease state of each tissue based on the regulon specific score inferred using pySCENIC and by calculating the average expression. |
| Page: 1 |
Top |
Somatic mutation of malignant transformation related genes |
| Annotation of somatic variants for genes involved in malignant transformation |
| Hugo Symbol | Variant Class | Variant Classification | dbSNP RS | HGVSc | HGVSp | HGVSp Short | SWISSPROT | BIOTYPE | SIFT | PolyPhen | Tumor Sample Barcode | Tissue | Histology | Sex | Age | Stage | Therapy Types | Drugs | Outcome |
| SPATA6L | SNV | Missense_Mutation | novel | c.248G>C | p.Arg83Thr | p.R83T | Q8N4H0 | protein_coding | deleterious(0.01) | probably_damaging(0.998) | TCGA-E9-A3HO-01 | Breast | breast invasive carcinoma | Female | <65 | I/II | Chemotherapy | cyclophosphamide | CR |
| SPATA6L | insertion | In_Frame_Ins | novel | c.704_705insAAG | p.Phe235delinsLeuSer | p.F235delinsLS | Q8N4H0 | protein_coding | TCGA-A8-A09C-01 | Breast | breast invasive carcinoma | Female | >=65 | I/II | Unknown | Unknown | SD | ||
| SPATA6L | deletion | Frame_Shift_Del | novel | c.399delN | p.Thr134ProfsTer12 | p.T134Pfs*12 | Q8N4H0 | protein_coding | TCGA-D8-A27V-01 | Breast | breast invasive carcinoma | Female | <65 | I/II | Hormone Therapy | tamoxiphen | SD | ||
| SPATA6L | deletion | Frame_Shift_Del | novel | c.97delN | p.Leu33SerfsTer2 | p.L33Sfs*2 | Q8N4H0 | protein_coding | TCGA-MS-A51U-01 | Breast | breast invasive carcinoma | Female | <65 | I/II | Chemotherapy | adriamycin | SD | ||
| SPATA6L | SNV | Missense_Mutation | novel | c.543G>C | p.Leu181Phe | p.L181F | Q8N4H0 | protein_coding | tolerated(0.07) | possibly_damaging(0.466) | TCGA-JW-A5VL-01 | Cervix | cervical & endocervical cancer | Female | <65 | I/II | Unknown | Unknown | SD |
| SPATA6L | SNV | Missense_Mutation | rs374967508 | c.581C>T | p.Pro194Leu | p.P194L | Q8N4H0 | protein_coding | deleterious(0.03) | benign(0.04) | TCGA-AA-3950-01 | Colorectum | colon adenocarcinoma | Female | >=65 | I/II | Unknown | Unknown | SD |
| SPATA6L | SNV | Missense_Mutation | novel | c.578T>C | p.Phe193Ser | p.F193S | Q8N4H0 | protein_coding | deleterious(0.01) | possibly_damaging(0.531) | TCGA-AA-A010-01 | Colorectum | colon adenocarcinoma | Female | <65 | I/II | Chemotherapy | folinic | CR |
| SPATA6L | SNV | Missense_Mutation | novel | c.214G>T | p.Ala72Ser | p.A72S | Q8N4H0 | protein_coding | deleterious(0.03) | probably_damaging(0.963) | TCGA-AA-A010-01 | Colorectum | colon adenocarcinoma | Female | <65 | I/II | Chemotherapy | folinic | CR |
| SPATA6L | SNV | Missense_Mutation | c.928T>C | p.Ser310Pro | p.S310P | Q8N4H0 | protein_coding | tolerated(0.14) | benign(0.009) | TCGA-AU-6004-01 | Colorectum | colon adenocarcinoma | Female | >=65 | I/II | Unknown | Unknown | SD | |
| SPATA6L | SNV | Missense_Mutation | rs373772153 | c.383N>T | p.Ala128Val | p.A128V | Q8N4H0 | protein_coding | tolerated(0.36) | benign(0) | TCGA-CK-4951-01 | Colorectum | colon adenocarcinoma | Female | >=65 | I/II | Unknown | Unknown | PD |
| Page: 1 2 3 |
Top |
Related drugs of malignant transformation related genes |
| Identification of chemicals and drugs interact with genes involved in malignant transfromation |
| (DGIdb 4.0) |
| Entrez ID | Symbol | Category | Interaction Types | Drug Claim Name | Drug Name | PMIDs |
| Page: 1 |

Copyright 2023-Present -The University of Texas Health Science Center at Houston |