
|
|||||
|
 | |
| |
| |
| |
| |
| |
|
Gene: SPATA5L1 |
Gene summary for SPATA5L1 |
| Gene information | Species | Human | Gene symbol | SPATA5L1 | Gene ID | 79029 |
| Gene name | spermatogenesis associated 5 like 1 | |
| Gene Alias | SPATA5L1 | |
| Cytomap | 15q21.1 | |
| Gene Type | protein-coding | GO ID | GO:0005575 | UniProtAcc | Q9BVQ7 |
Top |
Malignant transformation analysis |
| Identification of the aberrant gene expression in precancerous and cancerous lesions by comparing the gene expression of stem-like cells in diseased tissues with normal stem cells |
| Entrez ID | Symbol | Replicates | Species | Organ | Tissue | Adj P-value | Log2FC | Malignancy |
| 79029 | SPATA5L1 | LZE24T | Human | Esophagus | ESCC | 4.13e-06 | 1.12e-01 | 0.0596 |
| 79029 | SPATA5L1 | P2T-E | Human | Esophagus | ESCC | 5.12e-14 | 1.13e-01 | 0.1177 |
| 79029 | SPATA5L1 | P4T-E | Human | Esophagus | ESCC | 9.79e-14 | 3.88e-01 | 0.1323 |
| 79029 | SPATA5L1 | P5T-E | Human | Esophagus | ESCC | 2.87e-03 | 7.10e-02 | 0.1327 |
| 79029 | SPATA5L1 | P8T-E | Human | Esophagus | ESCC | 3.93e-09 | 5.63e-02 | 0.0889 |
| 79029 | SPATA5L1 | P9T-E | Human | Esophagus | ESCC | 1.50e-04 | 1.17e-01 | 0.1131 |
| 79029 | SPATA5L1 | P10T-E | Human | Esophagus | ESCC | 2.20e-19 | 1.58e-01 | 0.116 |
| 79029 | SPATA5L1 | P11T-E | Human | Esophagus | ESCC | 1.14e-05 | 1.42e-01 | 0.1426 |
| 79029 | SPATA5L1 | P12T-E | Human | Esophagus | ESCC | 1.12e-15 | 2.47e-01 | 0.1122 |
| 79029 | SPATA5L1 | P15T-E | Human | Esophagus | ESCC | 7.69e-09 | 9.79e-02 | 0.1149 |
| 79029 | SPATA5L1 | P16T-E | Human | Esophagus | ESCC | 8.83e-16 | 1.77e-01 | 0.1153 |
| 79029 | SPATA5L1 | P20T-E | Human | Esophagus | ESCC | 5.77e-09 | 1.31e-01 | 0.1124 |
| 79029 | SPATA5L1 | P21T-E | Human | Esophagus | ESCC | 2.58e-11 | 7.82e-02 | 0.1617 |
| 79029 | SPATA5L1 | P22T-E | Human | Esophagus | ESCC | 1.22e-06 | 2.81e-02 | 0.1236 |
| 79029 | SPATA5L1 | P23T-E | Human | Esophagus | ESCC | 3.37e-09 | 3.41e-01 | 0.108 |
| 79029 | SPATA5L1 | P24T-E | Human | Esophagus | ESCC | 3.23e-06 | 1.36e-01 | 0.1287 |
| 79029 | SPATA5L1 | P26T-E | Human | Esophagus | ESCC | 2.43e-17 | 2.90e-01 | 0.1276 |
| 79029 | SPATA5L1 | P27T-E | Human | Esophagus | ESCC | 6.29e-13 | 8.37e-02 | 0.1055 |
| 79029 | SPATA5L1 | P28T-E | Human | Esophagus | ESCC | 8.61e-12 | 1.76e-01 | 0.1149 |
| 79029 | SPATA5L1 | P30T-E | Human | Esophagus | ESCC | 3.22e-05 | 2.53e-01 | 0.137 |
| Page: 1 2 3 |
| Tissue | Expression Dynamics | Abbreviation |
| Esophagus | 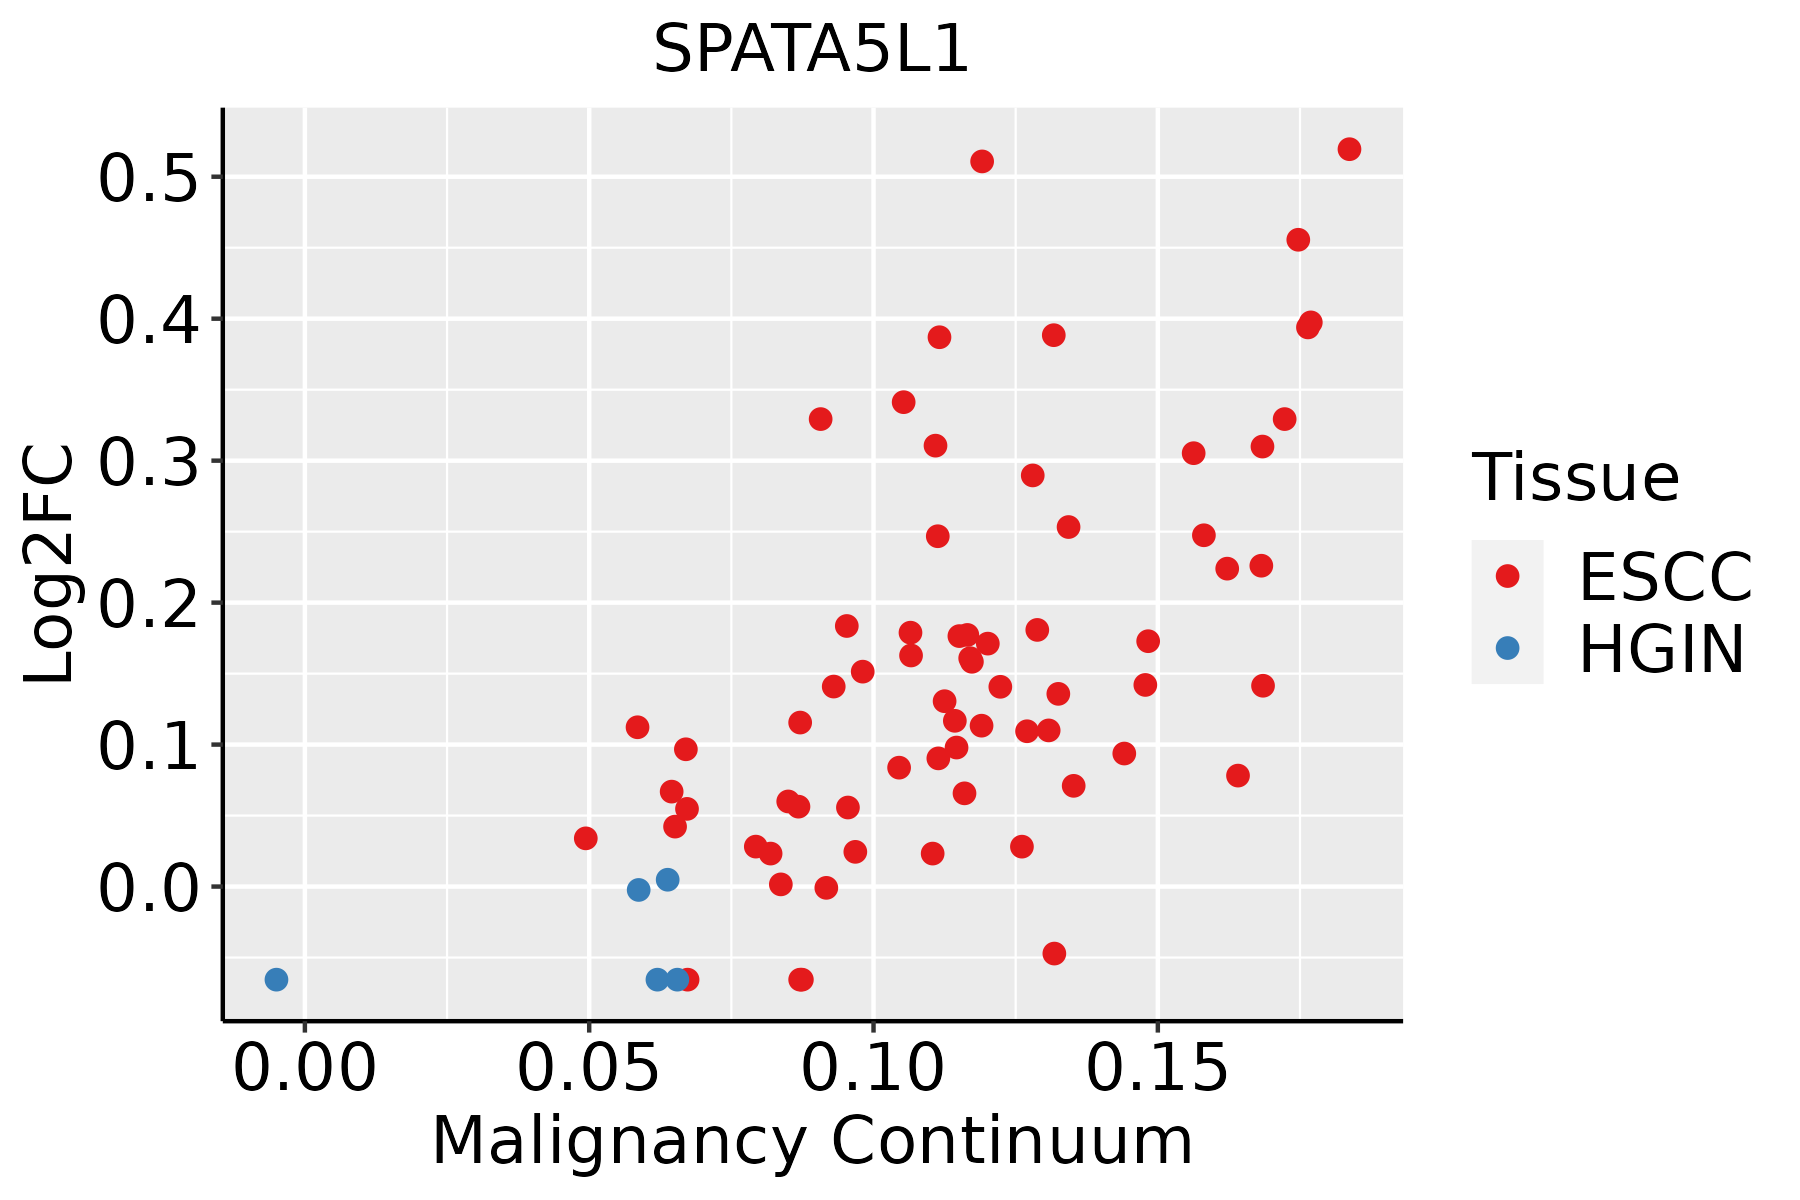 | ESCC: Esophageal squamous cell carcinoma |
| HGIN: High-grade intraepithelial neoplasias | ||
| LGIN: Low-grade intraepithelial neoplasias |
| ∗log2FC in expression of this searched gene in stem-like cells from each diseased tissue sample relative to stem-like cells in normal samples in each tissue plotted against the malignancy continuum. Samples are colored based on if they are from different disease stage. |
Top |
Malignant transformation related pathway analysis |
| Find out the enriched GO biological processes and KEGG pathways involved in transition from healthy to precancer to cancer |
| Tissue | Disease Stage | Enriched GO biological Processes |
| Colorectum | AD |  |
| Colorectum | SER |  |
| Colorectum | MSS |  |
| Colorectum | MSI-H |  |
| Colorectum | FAP |  |
| ∗Top 15 enriched GO BP terms are showed in the bar plot of each disease state in each tissue. Each row represents a significant GO biological process which is colored according to the -log10(p.adjust). |
| Page: 1 2 3 4 5 6 7 8 9 |
| GO ID | Tissue | Disease Stage | Description | Gene Ratio | Bg Ratio | pvalue | p.adjust | Count |
| Page: 1 |
| Pathway ID | Tissue | Disease Stage | Description | Gene Ratio | Bg Ratio | pvalue | p.adjust | qvalue | Count |
| Page: 1 |
Top |
Cell-cell communication analysis |
| Identification of potential cell-cell interactions between two cell types and their ligand-receptor pairs for different disease states |
| Ligand | Receptor | LRpair | Pathway | Tissue | Disease Stage |
| Page: 1 |
Top |
Single-cell gene regulatory network inference analysis |
| Find out the significant the regulons (TFs) and the target genes of each regulon across cell types for different disease states |
| TF | Cell Type | Tissue | Disease Stage | Target Gene | RSS | Regulon Activity |
| ∗The dot plots of a searched regulon are shown for all cell subpopulations in each disease state of each tissue based on the regulon specific score inferred using pySCENIC and by calculating the average expression. |
| Page: 1 |
Top |
Somatic mutation of malignant transformation related genes |
| Annotation of somatic variants for genes involved in malignant transformation |
| Hugo Symbol | Variant Class | Variant Classification | dbSNP RS | HGVSc | HGVSp | HGVSp Short | SWISSPROT | BIOTYPE | SIFT | PolyPhen | Tumor Sample Barcode | Tissue | Histology | Sex | Age | Stage | Therapy Types | Drugs | Outcome |
| SPATA5L1 | SNV | Missense_Mutation | c.1451N>G | p.Leu484Arg | p.L484R | Q9BVQ7 | protein_coding | deleterious(0) | possibly_damaging(0.866) | TCGA-A2-A04T-01 | Breast | breast invasive carcinoma | Female | <65 | I/II | Chemotherapy | cyclophosphamide | SD | |
| SPATA5L1 | SNV | Missense_Mutation | rs548685321 | c.1349G>A | p.Arg450Gln | p.R450Q | Q9BVQ7 | protein_coding | deleterious(0) | probably_damaging(0.95) | TCGA-AN-A046-01 | Breast | breast invasive carcinoma | Female | >=65 | I/II | Unknown | Unknown | SD |
| SPATA5L1 | SNV | Missense_Mutation | c.1676N>T | p.Ala559Val | p.A559V | Q9BVQ7 | protein_coding | deleterious(0.02) | possibly_damaging(0.901) | TCGA-AR-A24Q-01 | Breast | breast invasive carcinoma | Female | <65 | I/II | Chemotherapy | doxorubicin | SD | |
| SPATA5L1 | SNV | Missense_Mutation | c.1282G>T | p.Asp428Tyr | p.D428Y | Q9BVQ7 | protein_coding | deleterious(0.03) | benign(0.163) | TCGA-E9-A22E-01 | Breast | breast invasive carcinoma | Female | <65 | III/IV | Chemotherapy | cyclophosphane | SD | |
| SPATA5L1 | deletion | In_Frame_Del | novel | c.16_30delNNNNNNNNNNNNNNN | p.Asp6_Glu10del | p.D6_E10del | Q9BVQ7 | protein_coding | TCGA-A7-A4SD-01 | Breast | breast invasive carcinoma | Female | <65 | I/II | Chemotherapy | taxotere | CR | ||
| SPATA5L1 | deletion | Frame_Shift_Del | novel | c.1184delN | p.Ala397GlnfsTer3 | p.A397Qfs*3 | Q9BVQ7 | protein_coding | TCGA-D8-A27V-01 | Breast | breast invasive carcinoma | Female | <65 | I/II | Hormone Therapy | tamoxiphen | SD | ||
| SPATA5L1 | SNV | Missense_Mutation | novel | c.1247N>T | p.Ala416Val | p.A416V | Q9BVQ7 | protein_coding | deleterious(0.01) | benign(0.312) | TCGA-2W-A8YY-01 | Cervix | cervical & endocervical cancer | Female | <65 | I/II | Chemotherapy | cisplatin | CR |
| SPATA5L1 | insertion | Frame_Shift_Ins | novel | c.1647_1651dupATTTC | p.Arg551HisfsTer43 | p.R551Hfs*43 | Q9BVQ7 | protein_coding | TCGA-C5-A7CJ-01 | Cervix | cervical & endocervical cancer | Female | <65 | I/II | Chemotherapy | cisplatin | SD | ||
| SPATA5L1 | insertion | Frame_Shift_Ins | novel | c.2210dupT | p.Leu737PhefsTer3 | p.L737Ffs*3 | Q9BVQ7 | protein_coding | TCGA-C5-A905-01 | Cervix | cervical & endocervical cancer | Female | <65 | I/II | Unknown | Unknown | SD | ||
| SPATA5L1 | deletion | In_Frame_Del | novel | c.494_499delNNNNNN | p.Ile165_Gly167delinsSer | p.I165_G167delinsS | Q9BVQ7 | protein_coding | TCGA-DS-A1OB-01 | Cervix | cervical & endocervical cancer | Female | <65 | I/II | Chemotherapy | carboplatin | PD |
| Page: 1 2 3 4 5 6 |
Top |
Related drugs of malignant transformation related genes |
| Identification of chemicals and drugs interact with genes involved in malignant transfromation |
| (DGIdb 4.0) |
| Entrez ID | Symbol | Category | Interaction Types | Drug Claim Name | Drug Name | PMIDs |
| Page: 1 |

Copyright 2023-Present -The University of Texas Health Science Center at Houston |