
|
|||||
|
 | |
| |
| |
| |
| |
| |
|
Gene: SPATA33 |
Gene summary for SPATA33 |
| Gene information | Species | Human | Gene symbol | SPATA33 | Gene ID | 124045 |
| Gene name | spermatogenesis associated 33 | |
| Gene Alias | C16orf55 | |
| Cytomap | 16q24.3 | |
| Gene Type | protein-coding | GO ID | GO:0005575 | UniProtAcc | Q96N06 |
Top |
Malignant transformation analysis |
| Identification of the aberrant gene expression in precancerous and cancerous lesions by comparing the gene expression of stem-like cells in diseased tissues with normal stem cells |
| Entrez ID | Symbol | Replicates | Species | Organ | Tissue | Adj P-value | Log2FC | Malignancy |
| 124045 | SPATA33 | LZE4T | Human | Esophagus | ESCC | 3.78e-08 | 2.37e-01 | 0.0811 |
| 124045 | SPATA33 | LZE5T | Human | Esophagus | ESCC | 1.54e-04 | 2.94e-01 | 0.0514 |
| 124045 | SPATA33 | LZE7T | Human | Esophagus | ESCC | 3.98e-06 | 2.87e-01 | 0.0667 |
| 124045 | SPATA33 | LZE8T | Human | Esophagus | ESCC | 6.71e-04 | 1.64e-01 | 0.067 |
| 124045 | SPATA33 | LZE22T | Human | Esophagus | ESCC | 1.57e-02 | 2.08e-01 | 0.068 |
| 124045 | SPATA33 | LZE24T | Human | Esophagus | ESCC | 6.88e-12 | 3.28e-01 | 0.0596 |
| 124045 | SPATA33 | LZE21T | Human | Esophagus | ESCC | 9.73e-05 | 2.63e-01 | 0.0655 |
| 124045 | SPATA33 | LZE6T | Human | Esophagus | ESCC | 1.71e-05 | 1.90e-01 | 0.0845 |
| 124045 | SPATA33 | P1T-E | Human | Esophagus | ESCC | 1.05e-09 | 3.34e-01 | 0.0875 |
| 124045 | SPATA33 | P2T-E | Human | Esophagus | ESCC | 2.35e-12 | 2.66e-01 | 0.1177 |
| 124045 | SPATA33 | P4T-E | Human | Esophagus | ESCC | 9.47e-14 | 2.65e-01 | 0.1323 |
| 124045 | SPATA33 | P5T-E | Human | Esophagus | ESCC | 5.18e-10 | 2.71e-01 | 0.1327 |
| 124045 | SPATA33 | P8T-E | Human | Esophagus | ESCC | 1.66e-07 | 2.43e-01 | 0.0889 |
| 124045 | SPATA33 | P9T-E | Human | Esophagus | ESCC | 4.01e-04 | 1.21e-01 | 0.1131 |
| 124045 | SPATA33 | P10T-E | Human | Esophagus | ESCC | 1.45e-12 | 2.81e-01 | 0.116 |
| 124045 | SPATA33 | P11T-E | Human | Esophagus | ESCC | 1.72e-04 | 1.63e-01 | 0.1426 |
| 124045 | SPATA33 | P12T-E | Human | Esophagus | ESCC | 8.17e-13 | 3.00e-01 | 0.1122 |
| 124045 | SPATA33 | P15T-E | Human | Esophagus | ESCC | 3.16e-13 | 2.43e-01 | 0.1149 |
| 124045 | SPATA33 | P16T-E | Human | Esophagus | ESCC | 9.76e-06 | 1.73e-01 | 0.1153 |
| 124045 | SPATA33 | P17T-E | Human | Esophagus | ESCC | 3.47e-14 | 4.82e-01 | 0.1278 |
| Page: 1 2 3 4 |
| Tissue | Expression Dynamics | Abbreviation |
| Esophagus | 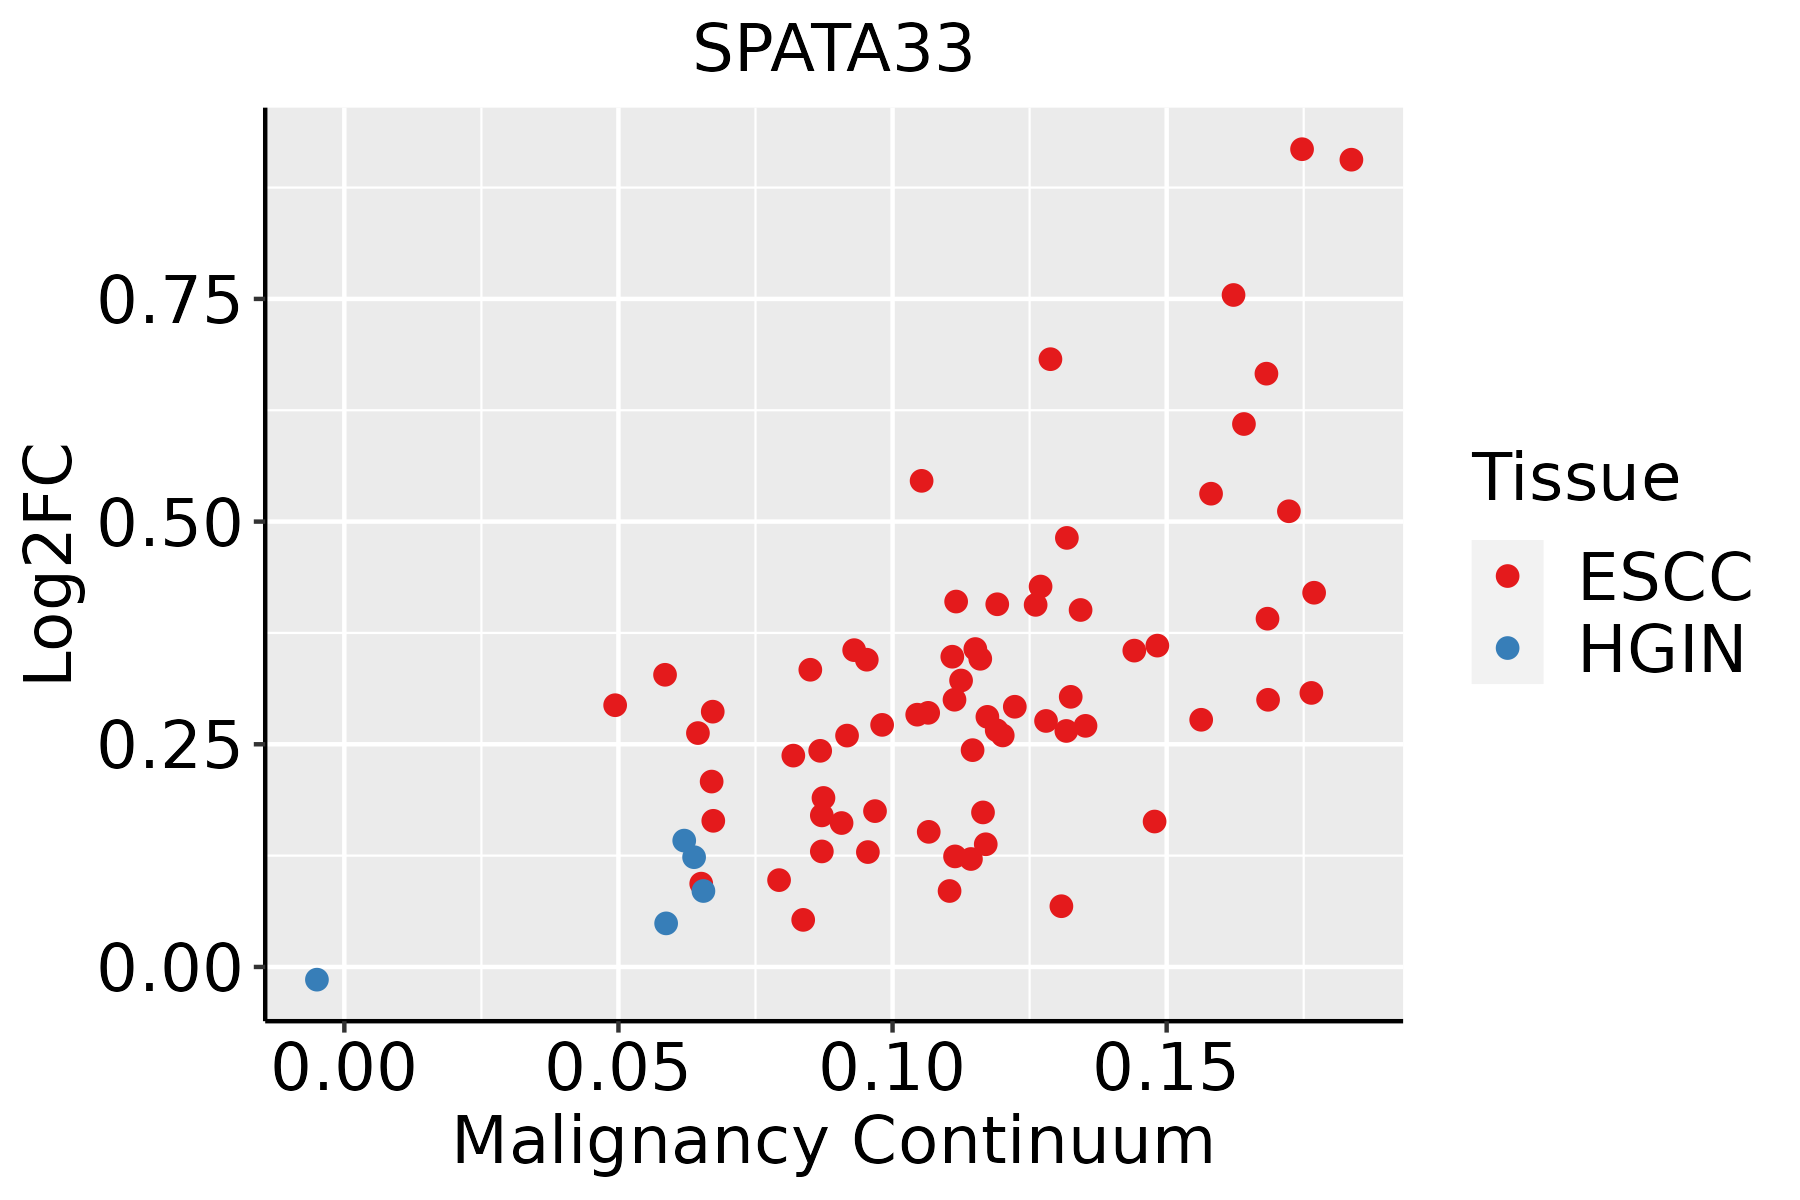 | ESCC: Esophageal squamous cell carcinoma |
| HGIN: High-grade intraepithelial neoplasias | ||
| LGIN: Low-grade intraepithelial neoplasias | ||
| Oral Cavity |  | EOLP: Erosive Oral lichen planus |
| LP: leukoplakia | ||
| NEOLP: Non-erosive oral lichen planus | ||
| OSCC: Oral squamous cell carcinoma |
| ∗log2FC in expression of this searched gene in stem-like cells from each diseased tissue sample relative to stem-like cells in normal samples in each tissue plotted against the malignancy continuum. Samples are colored based on if they are from different disease stage. |
Top |
Malignant transformation related pathway analysis |
| Find out the enriched GO biological processes and KEGG pathways involved in transition from healthy to precancer to cancer |
| Tissue | Disease Stage | Enriched GO biological Processes |
| Colorectum | AD |  |
| Colorectum | SER |  |
| Colorectum | MSS |  |
| Colorectum | MSI-H |  |
| Colorectum | FAP |  |
| ∗Top 15 enriched GO BP terms are showed in the bar plot of each disease state in each tissue. Each row represents a significant GO biological process which is colored according to the -log10(p.adjust). |
| Page: 1 2 3 4 5 6 7 8 9 |
| GO ID | Tissue | Disease Stage | Description | Gene Ratio | Bg Ratio | pvalue | p.adjust | Count |
| Page: 1 |
| Pathway ID | Tissue | Disease Stage | Description | Gene Ratio | Bg Ratio | pvalue | p.adjust | qvalue | Count |
| Page: 1 |
Top |
Cell-cell communication analysis |
| Identification of potential cell-cell interactions between two cell types and their ligand-receptor pairs for different disease states |
| Ligand | Receptor | LRpair | Pathway | Tissue | Disease Stage |
| Page: 1 |
Top |
Single-cell gene regulatory network inference analysis |
| Find out the significant the regulons (TFs) and the target genes of each regulon across cell types for different disease states |
| TF | Cell Type | Tissue | Disease Stage | Target Gene | RSS | Regulon Activity |
| ∗The dot plots of a searched regulon are shown for all cell subpopulations in each disease state of each tissue based on the regulon specific score inferred using pySCENIC and by calculating the average expression. |
| Page: 1 |
Top |
Somatic mutation of malignant transformation related genes |
| Annotation of somatic variants for genes involved in malignant transformation |
| Hugo Symbol | Variant Class | Variant Classification | dbSNP RS | HGVSc | HGVSp | HGVSp Short | SWISSPROT | BIOTYPE | SIFT | PolyPhen | Tumor Sample Barcode | Tissue | Histology | Sex | Age | Stage | Therapy Types | Drugs | Outcome |
| SPATA33 | SNV | Missense_Mutation | rs368742617 | c.281N>T | p.Ala94Val | p.A94V | Q96N06 | protein_coding | deleterious(0.01) | probably_damaging(0.951) | TCGA-AP-A054-01 | Endometrium | uterine corpus endometrioid carcinoma | Female | <65 | III/IV | Chemotherapy | carboplatin | PD |
| SPATA33 | insertion | Frame_Shift_Ins | novel | c.385dupA | p.Ser129LysfsTer7 | p.S129Kfs*7 | Q96N06 | protein_coding | TCGA-DI-A1BU-01 | Endometrium | uterine corpus endometrioid carcinoma | Female | <65 | I/II | Chemotherapy | paclitaxel | SD | ||
| SPATA33 | SNV | Missense_Mutation | rs751571842 | c.203N>T | p.Ser68Leu | p.S68L | Q96N06 | protein_coding | tolerated(0.28) | benign(0.009) | TCGA-86-8674-01 | Lung | lung adenocarcinoma | Male | <65 | I/II | Chemotherapy | vinblastine | PD |
| SPATA33 | SNV | Missense_Mutation | novel | c.51N>C | p.Lys17Asn | p.K17N | Q96N06 | protein_coding | deleterious(0.04) | possibly_damaging(0.66) | TCGA-P3-A5Q5-01 | Oral cavity | head & neck squamous cell carcinoma | Male | <65 | I/II | Unknown | Unknown | SD |
| Page: 1 |
Top |
Related drugs of malignant transformation related genes |
| Identification of chemicals and drugs interact with genes involved in malignant transfromation |
| (DGIdb 4.0) |
| Entrez ID | Symbol | Category | Interaction Types | Drug Claim Name | Drug Name | PMIDs |
| Page: 1 |

Copyright 2023-Present -The University of Texas Health Science Center at Houston |