
|
|||||
|
 | |
| |
| |
| |
| |
| |
|
Gene: SPATA2 |
Gene summary for SPATA2 |
| Gene information | Species | Human | Gene symbol | SPATA2 | Gene ID | 9825 |
| Gene name | spermatogenesis associated 2 | |
| Gene Alias | PD1 | |
| Cytomap | 20q13.13 | |
| Gene Type | protein-coding | GO ID | GO:0000003 | UniProtAcc | A8K0S9 |
Top |
Malignant transformation analysis |
| Identification of the aberrant gene expression in precancerous and cancerous lesions by comparing the gene expression of stem-like cells in diseased tissues with normal stem cells |
| Entrez ID | Symbol | Replicates | Species | Organ | Tissue | Adj P-value | Log2FC | Malignancy |
| 9825 | SPATA2 | LZE24T | Human | Esophagus | ESCC | 3.60e-02 | 1.46e-01 | 0.0596 |
| 9825 | SPATA2 | P2T-E | Human | Esophagus | ESCC | 3.48e-21 | 2.54e-01 | 0.1177 |
| 9825 | SPATA2 | P4T-E | Human | Esophagus | ESCC | 2.99e-08 | 1.24e-01 | 0.1323 |
| 9825 | SPATA2 | P5T-E | Human | Esophagus | ESCC | 1.47e-12 | 8.79e-02 | 0.1327 |
| 9825 | SPATA2 | P8T-E | Human | Esophagus | ESCC | 1.25e-09 | 2.14e-01 | 0.0889 |
| 9825 | SPATA2 | P10T-E | Human | Esophagus | ESCC | 1.19e-15 | 9.33e-02 | 0.116 |
| 9825 | SPATA2 | P11T-E | Human | Esophagus | ESCC | 7.13e-05 | 4.14e-01 | 0.1426 |
| 9825 | SPATA2 | P12T-E | Human | Esophagus | ESCC | 3.85e-09 | 1.57e-01 | 0.1122 |
| 9825 | SPATA2 | P15T-E | Human | Esophagus | ESCC | 8.40e-07 | 2.19e-01 | 0.1149 |
| 9825 | SPATA2 | P16T-E | Human | Esophagus | ESCC | 1.97e-15 | 2.45e-01 | 0.1153 |
| 9825 | SPATA2 | P20T-E | Human | Esophagus | ESCC | 2.31e-05 | 2.05e-01 | 0.1124 |
| 9825 | SPATA2 | P21T-E | Human | Esophagus | ESCC | 3.29e-14 | 2.91e-01 | 0.1617 |
| 9825 | SPATA2 | P22T-E | Human | Esophagus | ESCC | 4.18e-04 | 7.20e-02 | 0.1236 |
| 9825 | SPATA2 | P23T-E | Human | Esophagus | ESCC | 4.03e-05 | 1.82e-01 | 0.108 |
| 9825 | SPATA2 | P24T-E | Human | Esophagus | ESCC | 1.13e-07 | 1.40e-01 | 0.1287 |
| 9825 | SPATA2 | P26T-E | Human | Esophagus | ESCC | 2.43e-20 | 4.11e-01 | 0.1276 |
| 9825 | SPATA2 | P27T-E | Human | Esophagus | ESCC | 3.56e-07 | 8.47e-02 | 0.1055 |
| 9825 | SPATA2 | P28T-E | Human | Esophagus | ESCC | 1.22e-08 | 1.55e-01 | 0.1149 |
| 9825 | SPATA2 | P30T-E | Human | Esophagus | ESCC | 1.37e-09 | 3.29e-01 | 0.137 |
| 9825 | SPATA2 | P31T-E | Human | Esophagus | ESCC | 1.61e-16 | 2.62e-01 | 0.1251 |
| Page: 1 2 3 |
| Tissue | Expression Dynamics | Abbreviation |
| Esophagus | 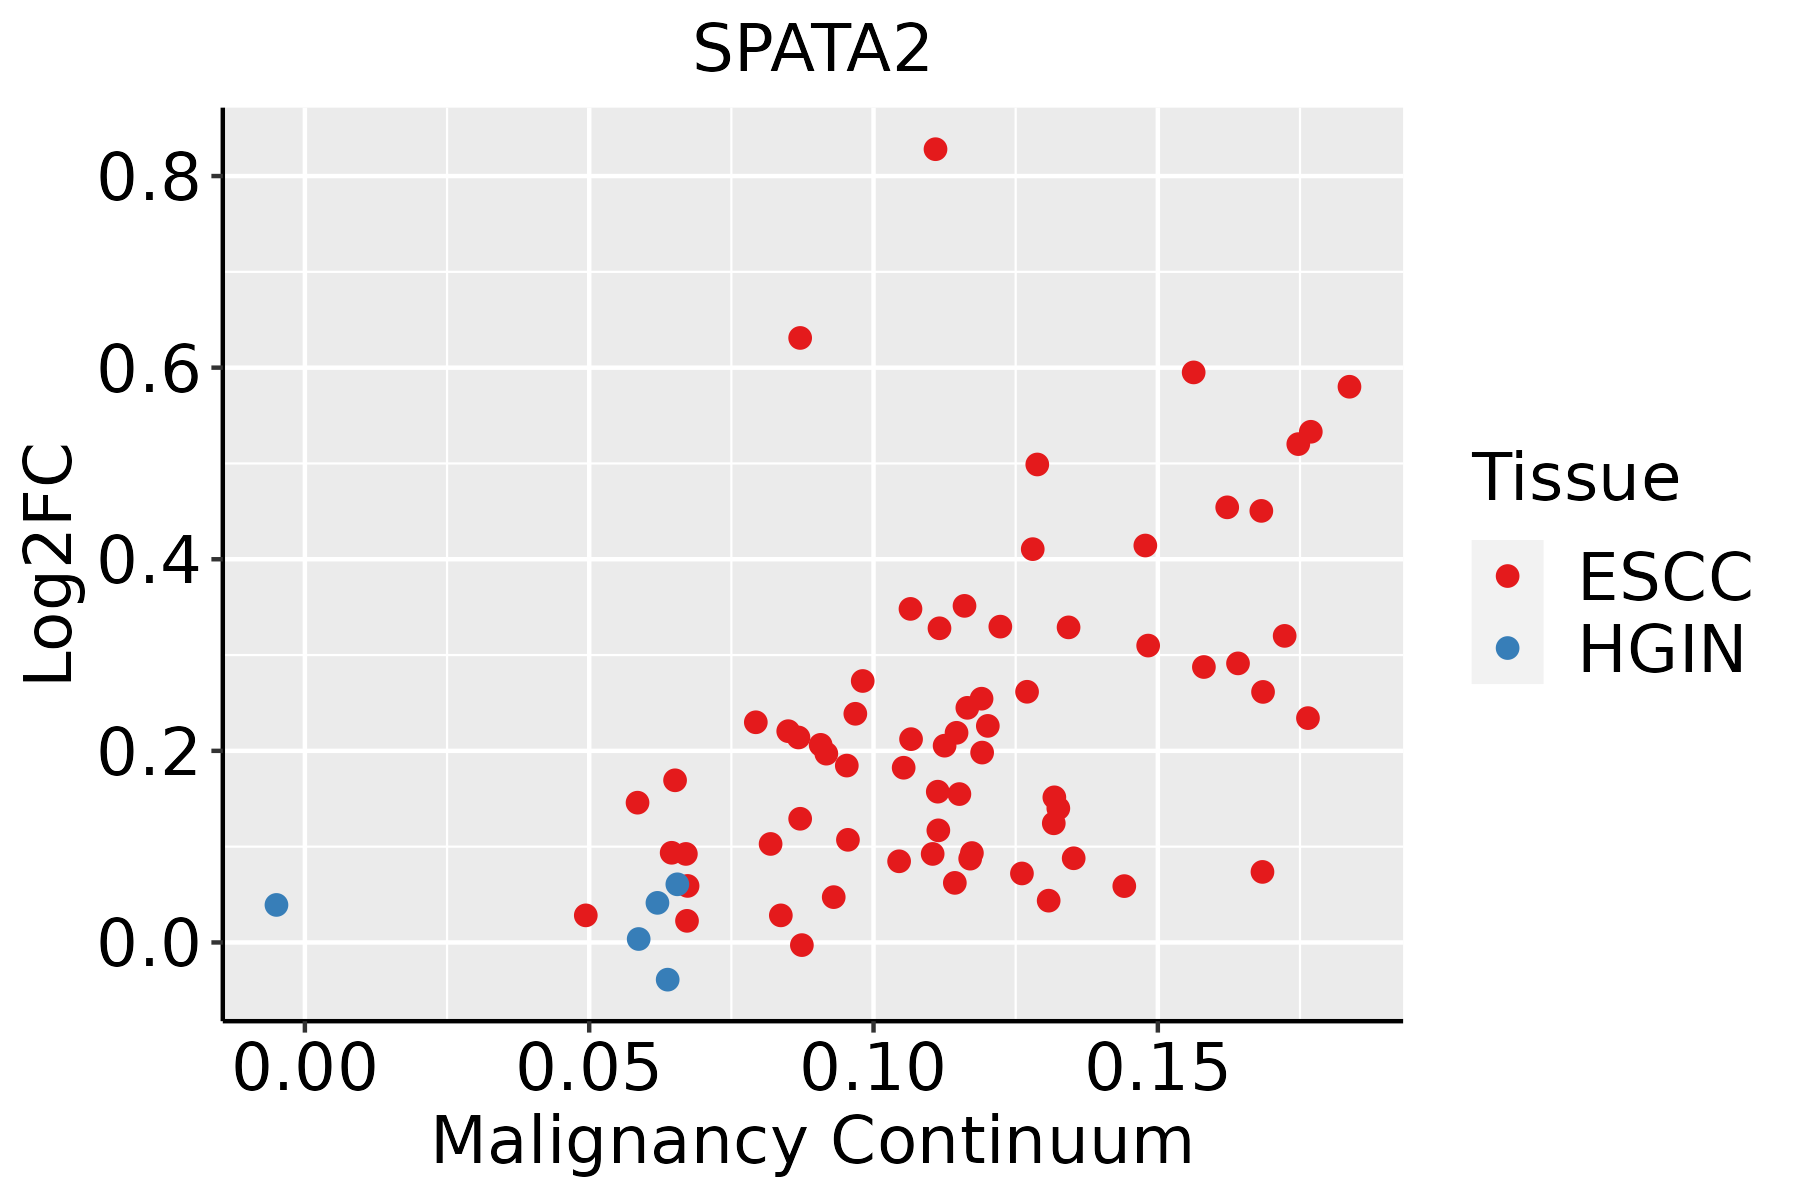 | ESCC: Esophageal squamous cell carcinoma |
| HGIN: High-grade intraepithelial neoplasias | ||
| LGIN: Low-grade intraepithelial neoplasias |
| ∗log2FC in expression of this searched gene in stem-like cells from each diseased tissue sample relative to stem-like cells in normal samples in each tissue plotted against the malignancy continuum. Samples are colored based on if they are from different disease stage. |
Top |
Malignant transformation related pathway analysis |
| Find out the enriched GO biological processes and KEGG pathways involved in transition from healthy to precancer to cancer |
| Tissue | Disease Stage | Enriched GO biological Processes |
| Colorectum | AD |  |
| Colorectum | SER |  |
| Colorectum | MSS |  |
| Colorectum | MSI-H |  |
| Colorectum | FAP |  |
| ∗Top 15 enriched GO BP terms are showed in the bar plot of each disease state in each tissue. Each row represents a significant GO biological process which is colored according to the -log10(p.adjust). |
| Page: 1 2 3 4 5 6 7 8 9 |
| GO ID | Tissue | Disease Stage | Description | Gene Ratio | Bg Ratio | pvalue | p.adjust | Count |
| GO:0061458110 | Esophagus | ESCC | reproductive system development | 247/8552 | 427/18723 | 2.24e-07 | 3.42e-06 | 247 |
| GO:004860818 | Esophagus | ESCC | reproductive structure development | 245/8552 | 424/18723 | 2.82e-07 | 4.14e-06 | 245 |
| GO:00607595 | Esophagus | ESCC | regulation of response to cytokine stimulus | 103/8552 | 162/18723 | 3.14e-06 | 3.53e-05 | 103 |
| GO:003320914 | Esophagus | ESCC | tumor necrosis factor-mediated signaling pathway | 67/8552 | 99/18723 | 7.87e-06 | 7.72e-05 | 67 |
| GO:00019595 | Esophagus | ESCC | regulation of cytokine-mediated signaling pathway | 95/8552 | 150/18723 | 9.48e-06 | 9.04e-05 | 95 |
| GO:003461220 | Esophagus | ESCC | response to tumor necrosis factor | 149/8552 | 253/18723 | 1.47e-05 | 1.33e-04 | 149 |
| GO:007064612 | Esophagus | ESCC | protein modification by small protein removal | 95/8552 | 157/18723 | 1.25e-04 | 8.56e-04 | 95 |
| GO:007135620 | Esophagus | ESCC | cellular response to tumor necrosis factor | 132/8552 | 229/18723 | 1.69e-04 | 1.11e-03 | 132 |
| GO:00973002 | Esophagus | ESCC | programmed necrotic cell death | 32/8552 | 47/18723 | 1.59e-03 | 7.43e-03 | 32 |
| GO:00108033 | Esophagus | ESCC | regulation of tumor necrosis factor-mediated signaling pathway | 31/8552 | 47/18723 | 4.01e-03 | 1.62e-02 | 31 |
| GO:00702654 | Esophagus | ESCC | necrotic cell death | 39/8552 | 62/18723 | 4.68e-03 | 1.82e-02 | 39 |
| GO:00165793 | Esophagus | ESCC | protein deubiquitination | 79/8552 | 139/18723 | 5.23e-03 | 1.97e-02 | 79 |
| Page: 1 |
| Pathway ID | Tissue | Disease Stage | Description | Gene Ratio | Bg Ratio | pvalue | p.adjust | qvalue | Count |
| Page: 1 |
Top |
Cell-cell communication analysis |
| Identification of potential cell-cell interactions between two cell types and their ligand-receptor pairs for different disease states |
| Ligand | Receptor | LRpair | Pathway | Tissue | Disease Stage |
| Page: 1 |
Top |
Single-cell gene regulatory network inference analysis |
| Find out the significant the regulons (TFs) and the target genes of each regulon across cell types for different disease states |
| TF | Cell Type | Tissue | Disease Stage | Target Gene | RSS | Regulon Activity |
| ∗The dot plots of a searched regulon are shown for all cell subpopulations in each disease state of each tissue based on the regulon specific score inferred using pySCENIC and by calculating the average expression. |
| Page: 1 |
Top |
Somatic mutation of malignant transformation related genes |
| Annotation of somatic variants for genes involved in malignant transformation |
| Hugo Symbol | Variant Class | Variant Classification | dbSNP RS | HGVSc | HGVSp | HGVSp Short | SWISSPROT | BIOTYPE | SIFT | PolyPhen | Tumor Sample Barcode | Tissue | Histology | Sex | Age | Stage | Therapy Types | Drugs | Outcome |
| SPATA2 | SNV | Missense_Mutation | novel | c.552G>C | p.Lys184Asn | p.K184N | Q9UM82 | protein_coding | deleterious(0.01) | probably_damaging(0.999) | TCGA-A2-A3Y0-01 | Breast | breast invasive carcinoma | Female | <65 | I/II | Chemotherapy | adriamycin | CR |
| SPATA2 | SNV | Missense_Mutation | c.480G>C | p.Lys160Asn | p.K160N | Q9UM82 | protein_coding | deleterious(0.01) | probably_damaging(0.943) | TCGA-AC-A23H-01 | Breast | breast invasive carcinoma | Female | >=65 | I/II | Unknown | Unknown | PD | |
| SPATA2 | SNV | Missense_Mutation | rs866741992 | c.1249N>T | p.Ala417Ser | p.A417S | Q9UM82 | protein_coding | tolerated(0.75) | benign(0.01) | TCGA-AC-A3TM-01 | Breast | breast invasive carcinoma | Female | <65 | III/IV | Chemotherapy | cytoxan | CR |
| SPATA2 | SNV | Missense_Mutation | novel | c.1414T>C | p.Cys472Arg | p.C472R | Q9UM82 | protein_coding | deleterious(0) | probably_damaging(0.962) | TCGA-AO-A128-01 | Breast | breast invasive carcinoma | Female | <65 | I/II | Chemotherapy | doxorubicin | SD |
| SPATA2 | SNV | Missense_Mutation | c.646N>C | p.Glu216Gln | p.E216Q | Q9UM82 | protein_coding | tolerated_low_confidence(0.11) | probably_damaging(0.998) | TCGA-BH-A0AW-01 | Breast | breast invasive carcinoma | Female | <65 | I/II | Chemotherapy | carboplatin | SD | |
| SPATA2 | SNV | Missense_Mutation | rs762726975 | c.86N>A | p.Thr29Asn | p.T29N | Q9UM82 | protein_coding | tolerated(0.39) | benign(0.054) | TCGA-D8-A1Y1-01 | Breast | breast invasive carcinoma | Female | >=65 | III/IV | Hormone Therapy | tamoxiphen | PD |
| SPATA2 | SNV | Missense_Mutation | rs866741992 | c.1249N>T | p.Ala417Ser | p.A417S | Q9UM82 | protein_coding | tolerated(0.75) | benign(0.01) | TCGA-LL-A440-01 | Breast | breast invasive carcinoma | Female | <65 | I/II | Chemotherapy | cytoxan | CR |
| SPATA2 | SNV | Missense_Mutation | rs201940082 | c.259N>A | p.Gly87Ser | p.G87S | Q9UM82 | protein_coding | tolerated(0.6) | benign(0) | TCGA-VS-A94Z-01 | Cervix | cervical & endocervical cancer | Female | <65 | I/II | Chemotherapy | cisplatin | CR |
| SPATA2 | SNV | Missense_Mutation | rs779328034 | c.127N>T | p.Arg43Trp | p.R43W | Q9UM82 | protein_coding | deleterious(0.02) | possibly_damaging(0.9) | TCGA-AA-3811-01 | Colorectum | colon adenocarcinoma | Female | >=65 | III/IV | Unknown | Unknown | PD |
| SPATA2 | SNV | Missense_Mutation | novel | c.650N>C | p.Gly217Ala | p.G217A | Q9UM82 | protein_coding | tolerated_low_confidence(1) | benign(0.003) | TCGA-AA-3856-01 | Colorectum | colon adenocarcinoma | Male | <65 | I/II | Unknown | Unknown | SD |
| Page: 1 2 3 4 5 6 |
Top |
Related drugs of malignant transformation related genes |
| Identification of chemicals and drugs interact with genes involved in malignant transfromation |
| (DGIdb 4.0) |
| Entrez ID | Symbol | Category | Interaction Types | Drug Claim Name | Drug Name | PMIDs |
| Page: 1 |

Copyright 2023-Present -The University of Texas Health Science Center at Houston |