
|
|||||
|
 | |
| |
| |
| |
| |
| |
|
Gene: SPART |
Gene summary for SPART |
| Gene information | Species | Human | Gene symbol | SPART | Gene ID | 23111 |
| Gene name | spartin | |
| Gene Alias | SPG20 | |
| Cytomap | 13q13.3 | |
| Gene Type | protein-coding | GO ID | GO:0000902 | UniProtAcc | A0A024RDV9 |
Top |
Malignant transformation analysis |
| Identification of the aberrant gene expression in precancerous and cancerous lesions by comparing the gene expression of stem-like cells in diseased tissues with normal stem cells |
| Entrez ID | Symbol | Replicates | Species | Organ | Tissue | Adj P-value | Log2FC | Malignancy |
| 23111 | SPART | AEH-subject1 | Human | Endometrium | AEH | 4.01e-09 | 2.24e-01 | -0.3059 |
| 23111 | SPART | AEH-subject2 | Human | Endometrium | AEH | 4.40e-03 | 1.27e-01 | -0.2525 |
| 23111 | SPART | AEH-subject3 | Human | Endometrium | AEH | 1.88e-08 | 2.08e-01 | -0.2576 |
| 23111 | SPART | AEH-subject4 | Human | Endometrium | AEH | 1.15e-13 | 3.66e-01 | -0.2657 |
| 23111 | SPART | AEH-subject5 | Human | Endometrium | AEH | 1.85e-09 | 2.34e-01 | -0.2953 |
| 23111 | SPART | EEC-subject1 | Human | Endometrium | EEC | 1.69e-11 | 2.50e-01 | -0.2682 |
| 23111 | SPART | EEC-subject2 | Human | Endometrium | EEC | 1.88e-08 | 2.12e-01 | -0.2607 |
| 23111 | SPART | EEC-subject3 | Human | Endometrium | EEC | 3.99e-06 | 1.95e-01 | -0.2525 |
| 23111 | SPART | EEC-subject4 | Human | Endometrium | EEC | 1.88e-08 | 2.07e-01 | -0.2571 |
| 23111 | SPART | EEC-subject5 | Human | Endometrium | EEC | 3.48e-12 | 2.27e-01 | -0.249 |
| 23111 | SPART | GSM5276934 | Human | Endometrium | EEC | 1.16e-34 | 5.68e-01 | -0.0913 |
| 23111 | SPART | GSM5276935 | Human | Endometrium | EEC | 4.35e-17 | 2.66e-01 | -0.123 |
| 23111 | SPART | GSM5276937 | Human | Endometrium | EEC | 9.78e-36 | 5.59e-01 | -0.0897 |
| 23111 | SPART | GSM6177620_NYU_UCEC1_lib1_lib1 | Human | Endometrium | EEC | 4.55e-02 | 1.76e-01 | -0.1869 |
| 23111 | SPART | GSM6177621_NYU_UCEC2_lib1_lib1 | Human | Endometrium | EEC | 8.15e-11 | 3.39e-01 | -0.1934 |
| 23111 | SPART | male-WTA | Human | Thyroid | PTC | 5.13e-22 | 3.34e-01 | 0.1037 |
| 23111 | SPART | female-WTA | Human | Thyroid | PTC | 2.08e-02 | 2.44e-01 | 0.0726 |
| 23111 | SPART | nodule-WTA | Human | Thyroid | goiters | 6.09e-09 | 3.47e-01 | 0.0534 |
| 23111 | SPART | PTC01 | Human | Thyroid | PTC | 2.90e-24 | 3.92e-01 | 0.1899 |
| 23111 | SPART | PTC03 | Human | Thyroid | PTC | 6.13e-09 | 4.03e-01 | 0.1784 |
| Page: 1 2 |
| Tissue | Expression Dynamics | Abbreviation |
| Endometrium |  | AEH: Atypical endometrial hyperplasia |
| EEC: Endometrioid Cancer | ||
| Thyroid | 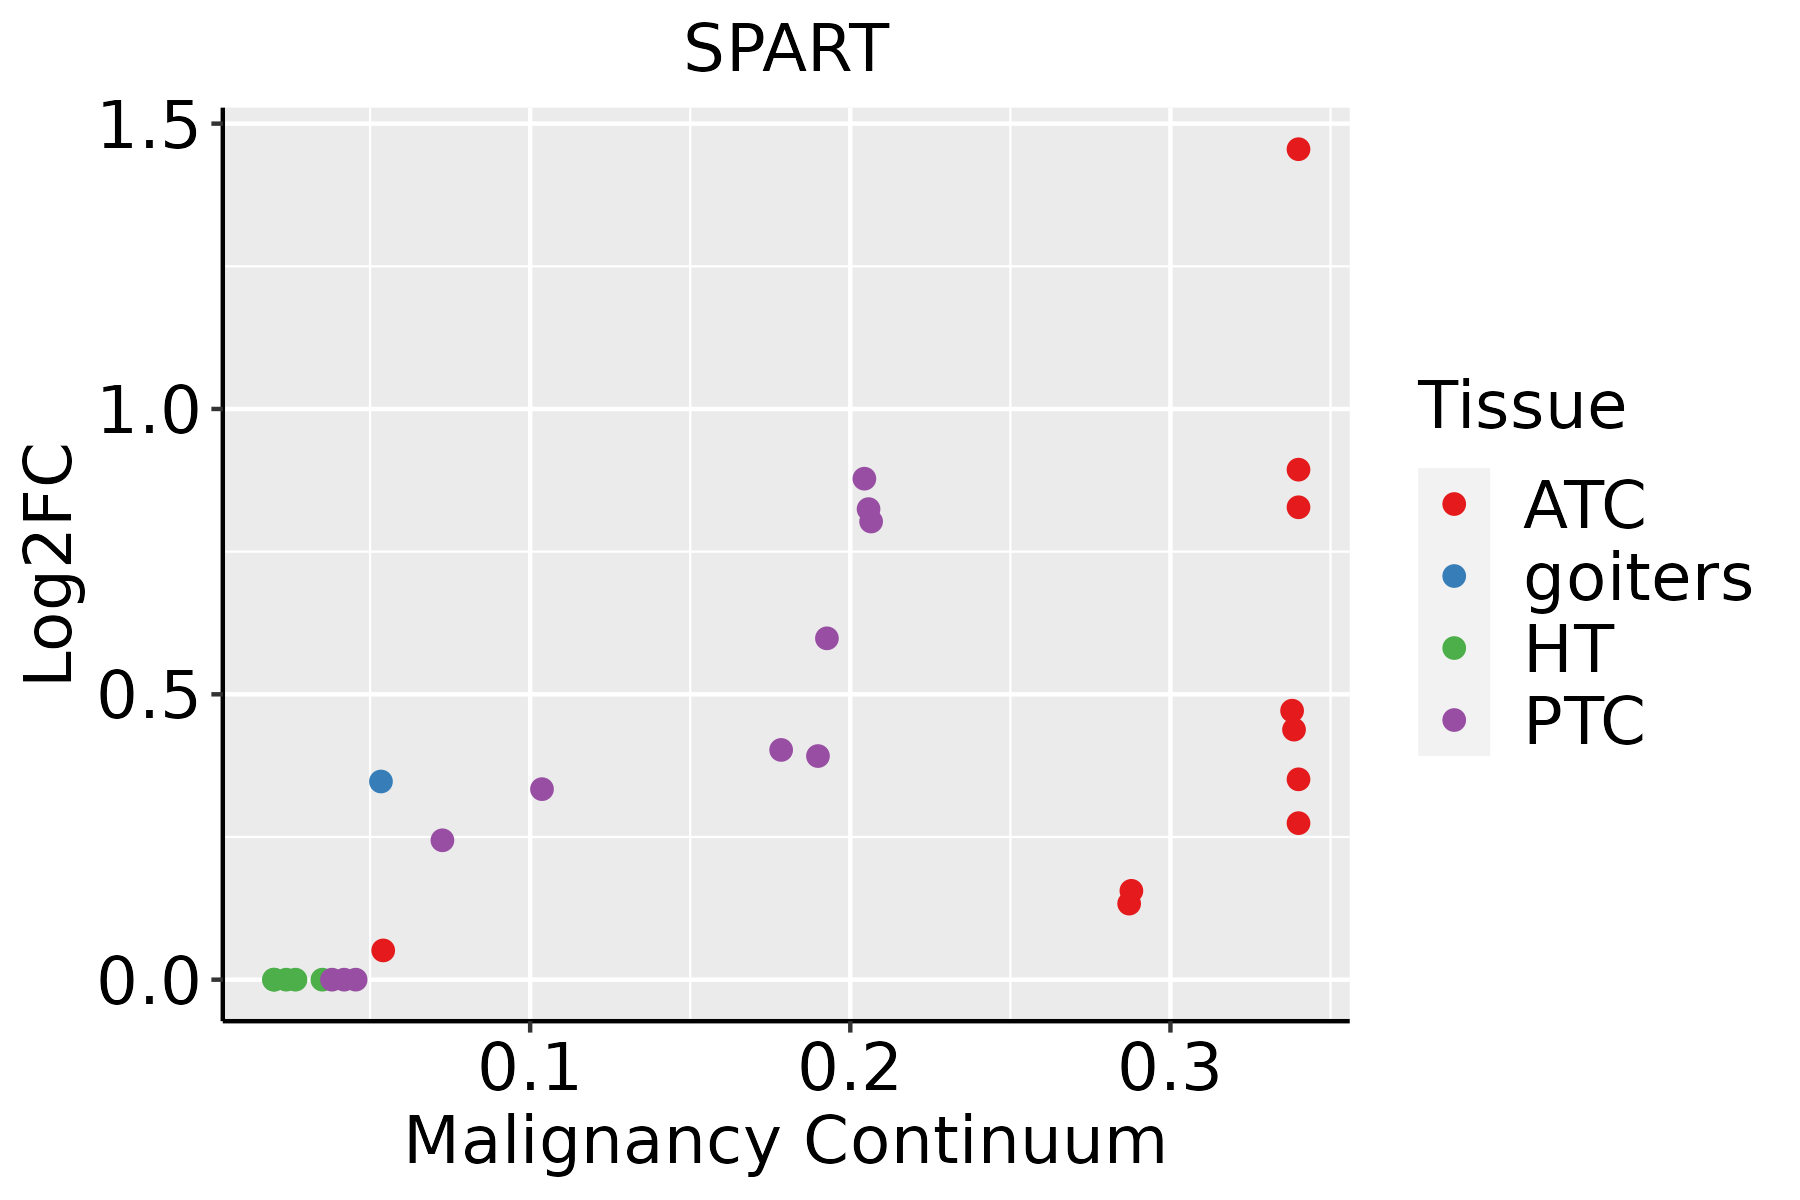 | ATC: Anaplastic thyroid cancer |
| HT: Hashimoto's thyroiditis | ||
| PTC: Papillary thyroid cancer |
| ∗log2FC in expression of this searched gene in stem-like cells from each diseased tissue sample relative to stem-like cells in normal samples in each tissue plotted against the malignancy continuum. Samples are colored based on if they are from different disease stage. |
Top |
Malignant transformation related pathway analysis |
| Find out the enriched GO biological processes and KEGG pathways involved in transition from healthy to precancer to cancer |
| Tissue | Disease Stage | Enriched GO biological Processes |
| Colorectum | AD |  |
| Colorectum | SER |  |
| Colorectum | MSS |  |
| Colorectum | MSI-H |  |
| Colorectum | FAP |  |
| ∗Top 15 enriched GO BP terms are showed in the bar plot of each disease state in each tissue. Each row represents a significant GO biological process which is colored according to the -log10(p.adjust). |
| Page: 1 2 3 4 5 6 7 8 9 |
| GO ID | Tissue | Disease Stage | Description | Gene Ratio | Bg Ratio | pvalue | p.adjust | Count |
| GO:00160499 | Endometrium | AEH | cell growth | 93/2100 | 482/18723 | 1.00e-07 | 4.99e-06 | 93 |
| GO:003253510 | Endometrium | AEH | regulation of cellular component size | 78/2100 | 383/18723 | 1.10e-07 | 5.29e-06 | 78 |
| GO:00605607 | Endometrium | AEH | developmental growth involved in morphogenesis | 53/2100 | 234/18723 | 4.02e-07 | 1.67e-05 | 53 |
| GO:00074098 | Endometrium | AEH | axonogenesis | 81/2100 | 418/18723 | 5.54e-07 | 2.12e-05 | 81 |
| GO:00615648 | Endometrium | AEH | axon development | 88/2100 | 467/18723 | 6.39e-07 | 2.38e-05 | 88 |
| GO:00518817 | Endometrium | AEH | regulation of mitochondrial membrane potential | 24/2100 | 74/18723 | 8.97e-07 | 3.19e-05 | 24 |
| GO:00071787 | Endometrium | AEH | transmembrane receptor protein serine/threonine kinase signaling pathway | 67/2100 | 355/18723 | 1.28e-05 | 2.80e-04 | 67 |
| GO:00015589 | Endometrium | AEH | regulation of cell growth | 75/2100 | 414/18723 | 1.79e-05 | 3.65e-04 | 75 |
| GO:00485887 | Endometrium | AEH | developmental cell growth | 48/2100 | 234/18723 | 2.39e-05 | 4.53e-04 | 48 |
| GO:00083616 | Endometrium | AEH | regulation of cell size | 38/2100 | 181/18723 | 9.69e-05 | 1.40e-03 | 38 |
| GO:00109758 | Endometrium | AEH | regulation of neuron projection development | 75/2100 | 445/18723 | 2.01e-04 | 2.54e-03 | 75 |
| GO:00459264 | Endometrium | AEH | negative regulation of growth | 47/2100 | 249/18723 | 2.36e-04 | 2.84e-03 | 47 |
| GO:00305092 | Endometrium | AEH | BMP signaling pathway | 32/2100 | 152/18723 | 3.15e-04 | 3.54e-03 | 32 |
| GO:00486387 | Endometrium | AEH | regulation of developmental growth | 58/2100 | 330/18723 | 3.45e-04 | 3.80e-03 | 58 |
| GO:00303082 | Endometrium | AEH | negative regulation of cell growth | 36/2100 | 188/18723 | 9.15e-04 | 8.37e-03 | 36 |
| GO:00717722 | Endometrium | AEH | response to BMP | 32/2100 | 165/18723 | 1.38e-03 | 1.16e-02 | 32 |
| GO:00717732 | Endometrium | AEH | cellular response to BMP stimulus | 32/2100 | 165/18723 | 1.38e-03 | 1.16e-02 | 32 |
| GO:0061448 | Endometrium | AEH | connective tissue development | 44/2100 | 252/18723 | 1.92e-03 | 1.51e-02 | 44 |
| GO:00613872 | Endometrium | AEH | regulation of extent of cell growth | 23/2100 | 110/18723 | 2.27e-03 | 1.74e-02 | 23 |
| GO:00900922 | Endometrium | AEH | regulation of transmembrane receptor protein serine/threonine kinase signaling pathway | 43/2100 | 256/18723 | 4.47e-03 | 2.93e-02 | 43 |
| Page: 1 2 3 4 5 |
| Pathway ID | Tissue | Disease Stage | Description | Gene Ratio | Bg Ratio | pvalue | p.adjust | qvalue | Count |
| hsa0414420 | Endometrium | AEH | Endocytosis | 56/1197 | 251/8465 | 2.58e-04 | 2.15e-03 | 1.57e-03 | 56 |
| hsa04144110 | Endometrium | AEH | Endocytosis | 56/1197 | 251/8465 | 2.58e-04 | 2.15e-03 | 1.57e-03 | 56 |
| hsa0414424 | Endometrium | EEC | Endocytosis | 57/1237 | 251/8465 | 3.34e-04 | 2.82e-03 | 2.10e-03 | 57 |
| hsa0414434 | Endometrium | EEC | Endocytosis | 57/1237 | 251/8465 | 3.34e-04 | 2.82e-03 | 2.10e-03 | 57 |
| Page: 1 |
Top |
Cell-cell communication analysis |
| Identification of potential cell-cell interactions between two cell types and their ligand-receptor pairs for different disease states |
| Ligand | Receptor | LRpair | Pathway | Tissue | Disease Stage |
| Page: 1 |
Top |
Single-cell gene regulatory network inference analysis |
| Find out the significant the regulons (TFs) and the target genes of each regulon across cell types for different disease states |
| TF | Cell Type | Tissue | Disease Stage | Target Gene | RSS | Regulon Activity |
| ∗The dot plots of a searched regulon are shown for all cell subpopulations in each disease state of each tissue based on the regulon specific score inferred using pySCENIC and by calculating the average expression. |
| Page: 1 |
Top |
Somatic mutation of malignant transformation related genes |
| Annotation of somatic variants for genes involved in malignant transformation |
| Hugo Symbol | Variant Class | Variant Classification | dbSNP RS | HGVSc | HGVSp | HGVSp Short | SWISSPROT | BIOTYPE | SIFT | PolyPhen | Tumor Sample Barcode | Tissue | Histology | Sex | Age | Stage | Therapy Types | Drugs | Outcome |
| Page: 1 |
Top |
Related drugs of malignant transformation related genes |
| Identification of chemicals and drugs interact with genes involved in malignant transfromation |
| (DGIdb 4.0) |
| Entrez ID | Symbol | Category | Interaction Types | Drug Claim Name | Drug Name | PMIDs |
| Page: 1 |

Copyright 2023-Present -The University of Texas Health Science Center at Houston |