
|
|||||
|
 | |
| |
| |
| |
| |
| |
|
Gene: SPARCL1 |
Gene summary for SPARCL1 |
| Gene information | Species | Human | Gene symbol | SPARCL1 | Gene ID | 8404 |
| Gene name | SPARC like 1 | |
| Gene Alias | MAST 9 | |
| Cytomap | 4q22.1 | |
| Gene Type | protein-coding | GO ID | GO:0007154 | UniProtAcc | A0A024RDE1 |
Top |
Malignant transformation analysis |
| Identification of the aberrant gene expression in precancerous and cancerous lesions by comparing the gene expression of stem-like cells in diseased tissues with normal stem cells |
| Entrez ID | Symbol | Replicates | Species | Organ | Tissue | Adj P-value | Log2FC | Malignancy |
| 8404 | SPARCL1 | CA_HPV_1 | Human | Cervix | CC | 2.11e-03 | -4.45e-02 | 0.0264 |
| 8404 | SPARCL1 | CA_HPV_2 | Human | Cervix | CC | 2.13e-02 | -1.93e-01 | 0.0391 |
| 8404 | SPARCL1 | CA_HPV_3 | Human | Cervix | CC | 1.32e-41 | 9.07e-01 | 0.0414 |
| 8404 | SPARCL1 | N_HPV_2 | Human | Cervix | N_HPV | 1.95e-09 | 3.96e-01 | -0.0131 |
| 8404 | SPARCL1 | Tumor | Human | Cervix | CC | 1.95e-07 | -2.08e-01 | 0.1241 |
| 8404 | SPARCL1 | sample3 | Human | Cervix | CC | 4.20e-07 | -2.08e-01 | 0.1387 |
| 8404 | SPARCL1 | T1 | Human | Cervix | CC | 2.35e-03 | -2.03e-01 | 0.0918 |
| 8404 | SPARCL1 | T3 | Human | Cervix | CC | 1.95e-07 | -2.08e-01 | 0.1389 |
| 8404 | SPARCL1 | AEH-subject1 | Human | Endometrium | AEH | 2.39e-48 | -9.97e-01 | -0.3059 |
| 8404 | SPARCL1 | AEH-subject2 | Human | Endometrium | AEH | 1.19e-28 | -8.06e-01 | -0.2525 |
| 8404 | SPARCL1 | AEH-subject3 | Human | Endometrium | AEH | 4.70e-38 | -8.94e-01 | -0.2576 |
| 8404 | SPARCL1 | AEH-subject4 | Human | Endometrium | AEH | 7.49e-05 | -4.12e-01 | -0.2657 |
| 8404 | SPARCL1 | AEH-subject5 | Human | Endometrium | AEH | 2.98e-24 | -7.97e-01 | -0.2953 |
| 8404 | SPARCL1 | EEC-subject1 | Human | Endometrium | EEC | 7.27e-44 | -9.88e-01 | -0.2682 |
| 8404 | SPARCL1 | EEC-subject2 | Human | Endometrium | EEC | 7.67e-48 | -9.96e-01 | -0.2607 |
| 8404 | SPARCL1 | EEC-subject3 | Human | Endometrium | EEC | 3.49e-31 | -5.60e-01 | -0.2525 |
| 8404 | SPARCL1 | EEC-subject4 | Human | Endometrium | EEC | 9.63e-29 | -8.36e-01 | -0.2571 |
| 8404 | SPARCL1 | EEC-subject5 | Human | Endometrium | EEC | 1.12e-42 | -9.71e-01 | -0.249 |
| 8404 | SPARCL1 | GSM5276935 | Human | Endometrium | EEC | 1.48e-45 | -9.91e-01 | -0.123 |
| 8404 | SPARCL1 | GSM5276937 | Human | Endometrium | EEC | 9.90e-04 | -2.38e-01 | -0.0897 |
| Page: 1 2 3 4 5 |
| Tissue | Expression Dynamics | Abbreviation |
| Cervix | 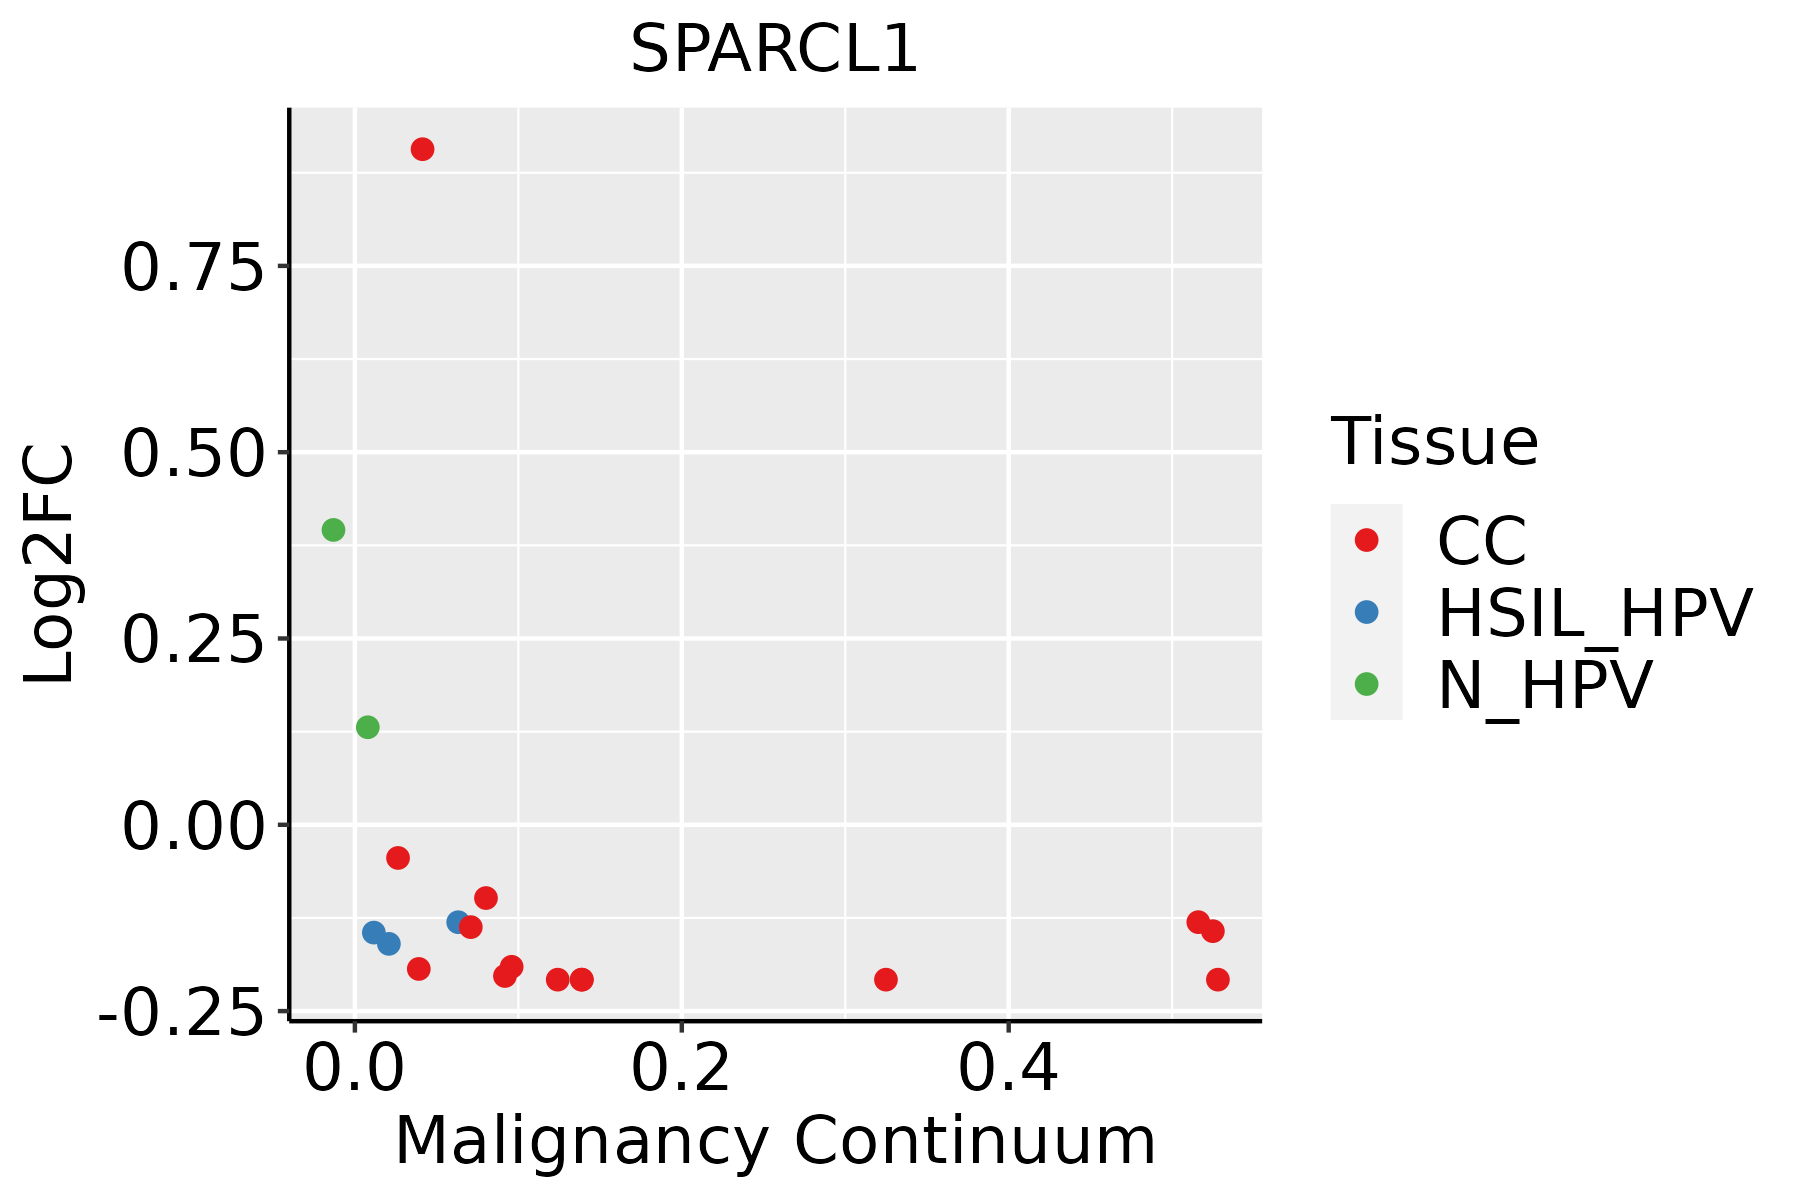 | CC: Cervix cancer |
| HSIL_HPV: HPV-infected high-grade squamous intraepithelial lesions | ||
| N_HPV: HPV-infected normal cervix | ||
| Endometrium | 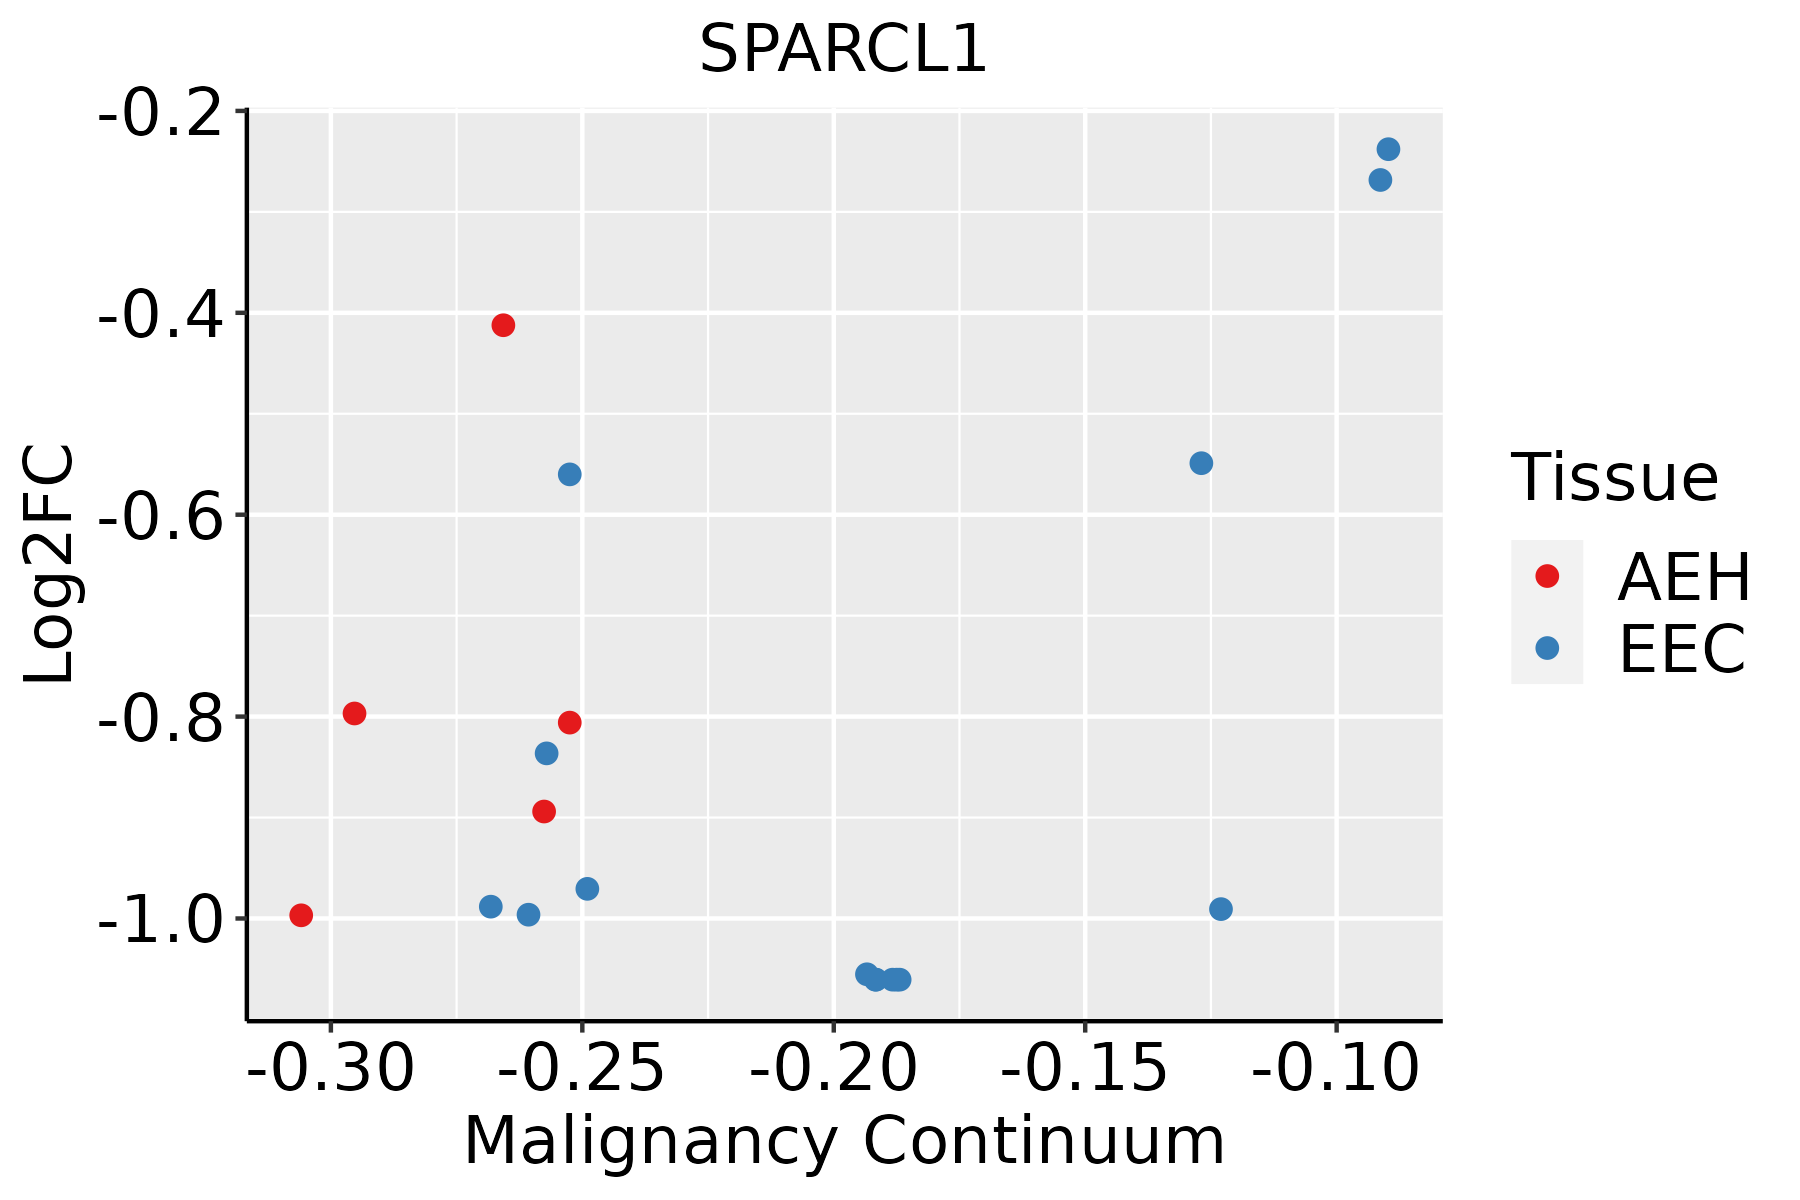 | AEH: Atypical endometrial hyperplasia |
| EEC: Endometrioid Cancer | ||
| Esophagus | 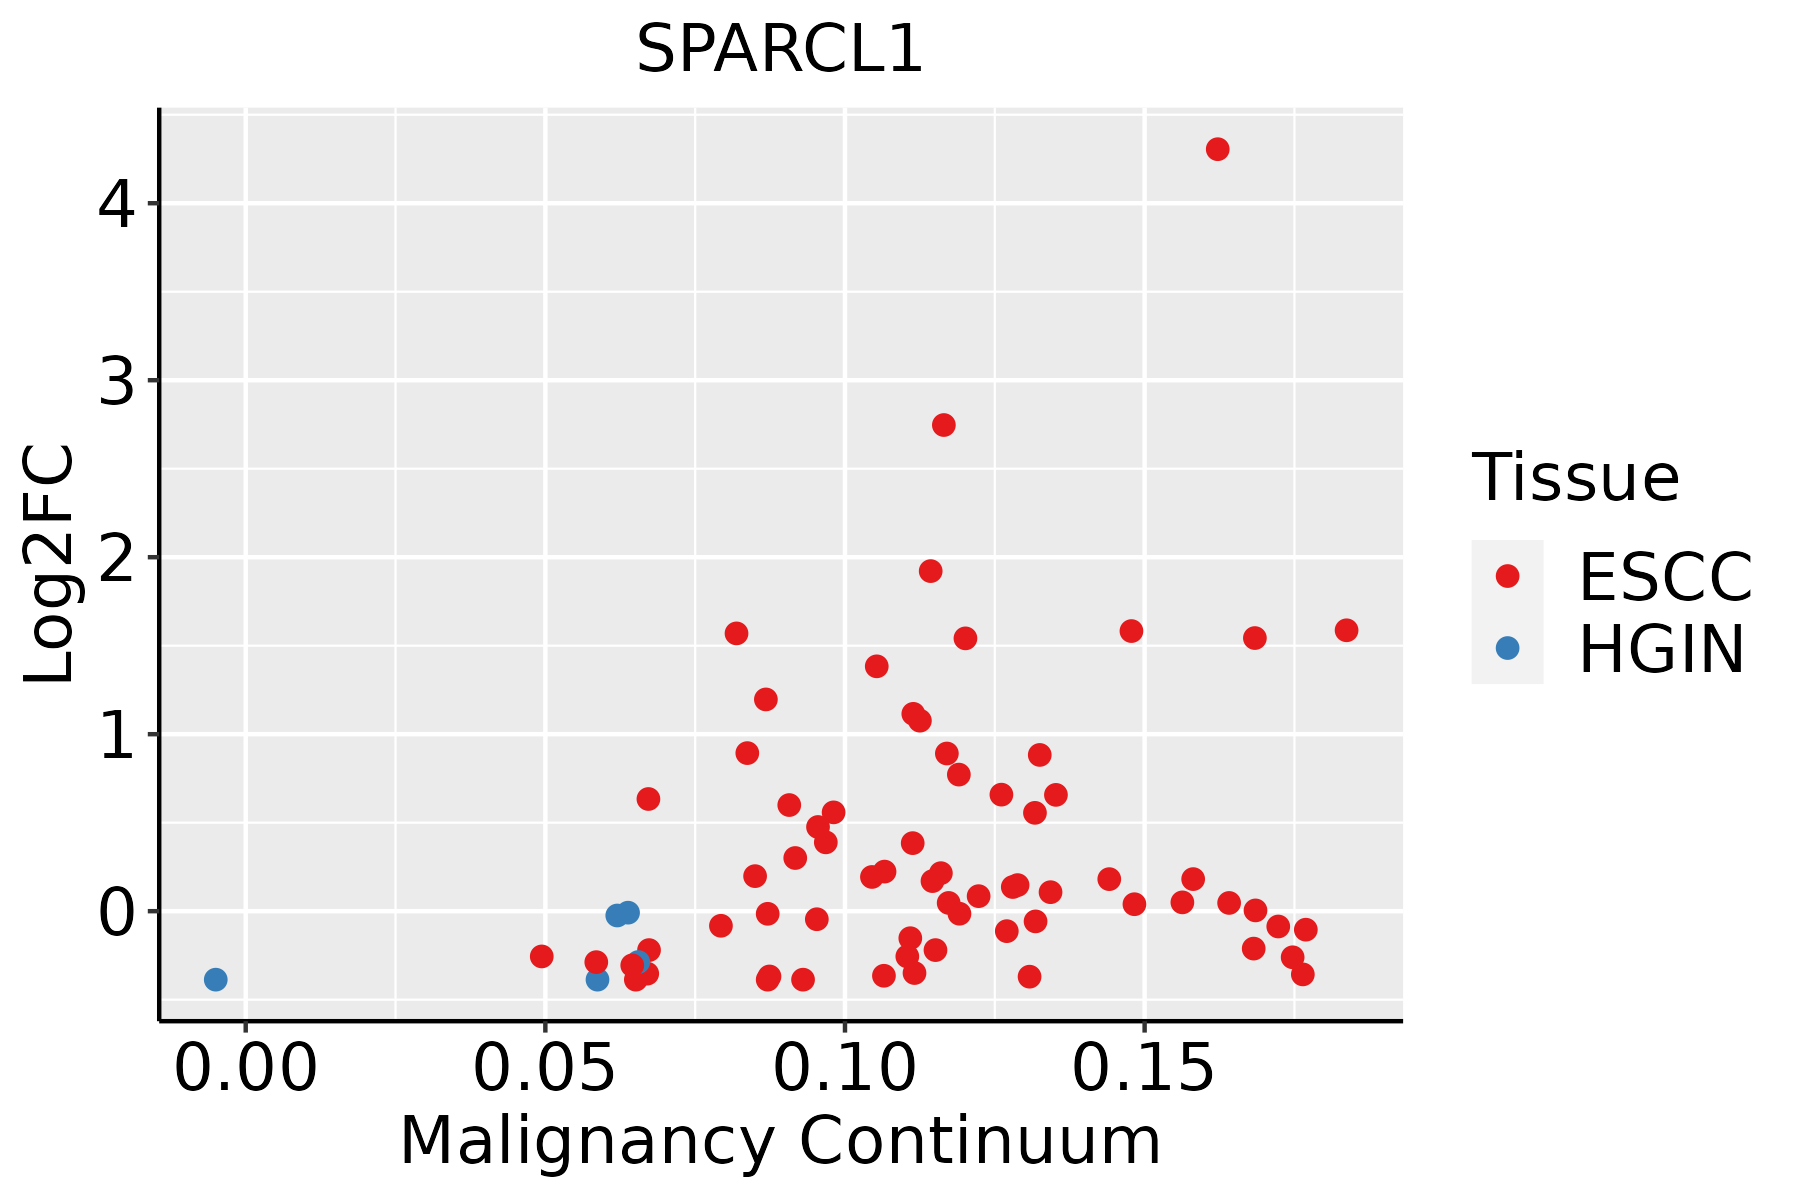 | ESCC: Esophageal squamous cell carcinoma |
| HGIN: High-grade intraepithelial neoplasias | ||
| LGIN: Low-grade intraepithelial neoplasias | ||
| Liver | 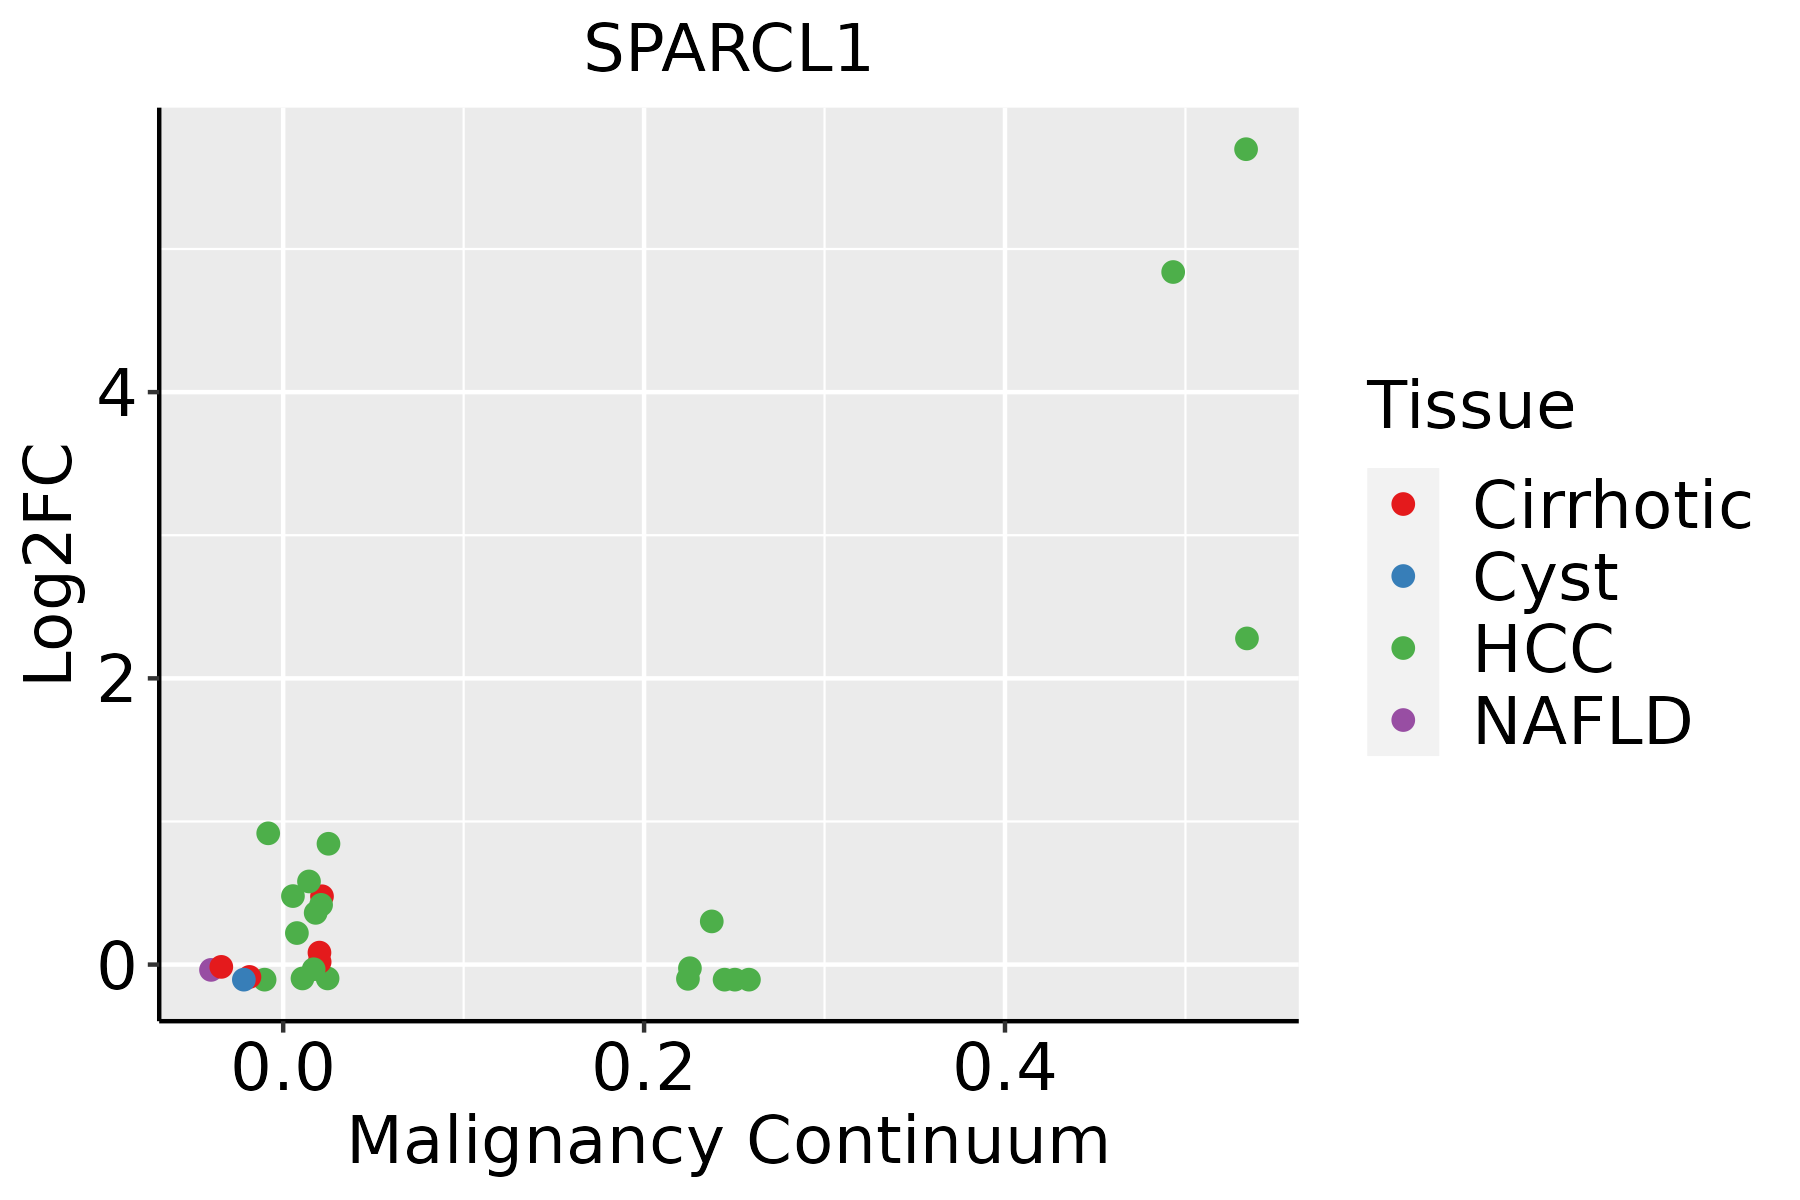 | HCC: Hepatocellular carcinoma |
| NAFLD: Non-alcoholic fatty liver disease | ||
| Oral Cavity | 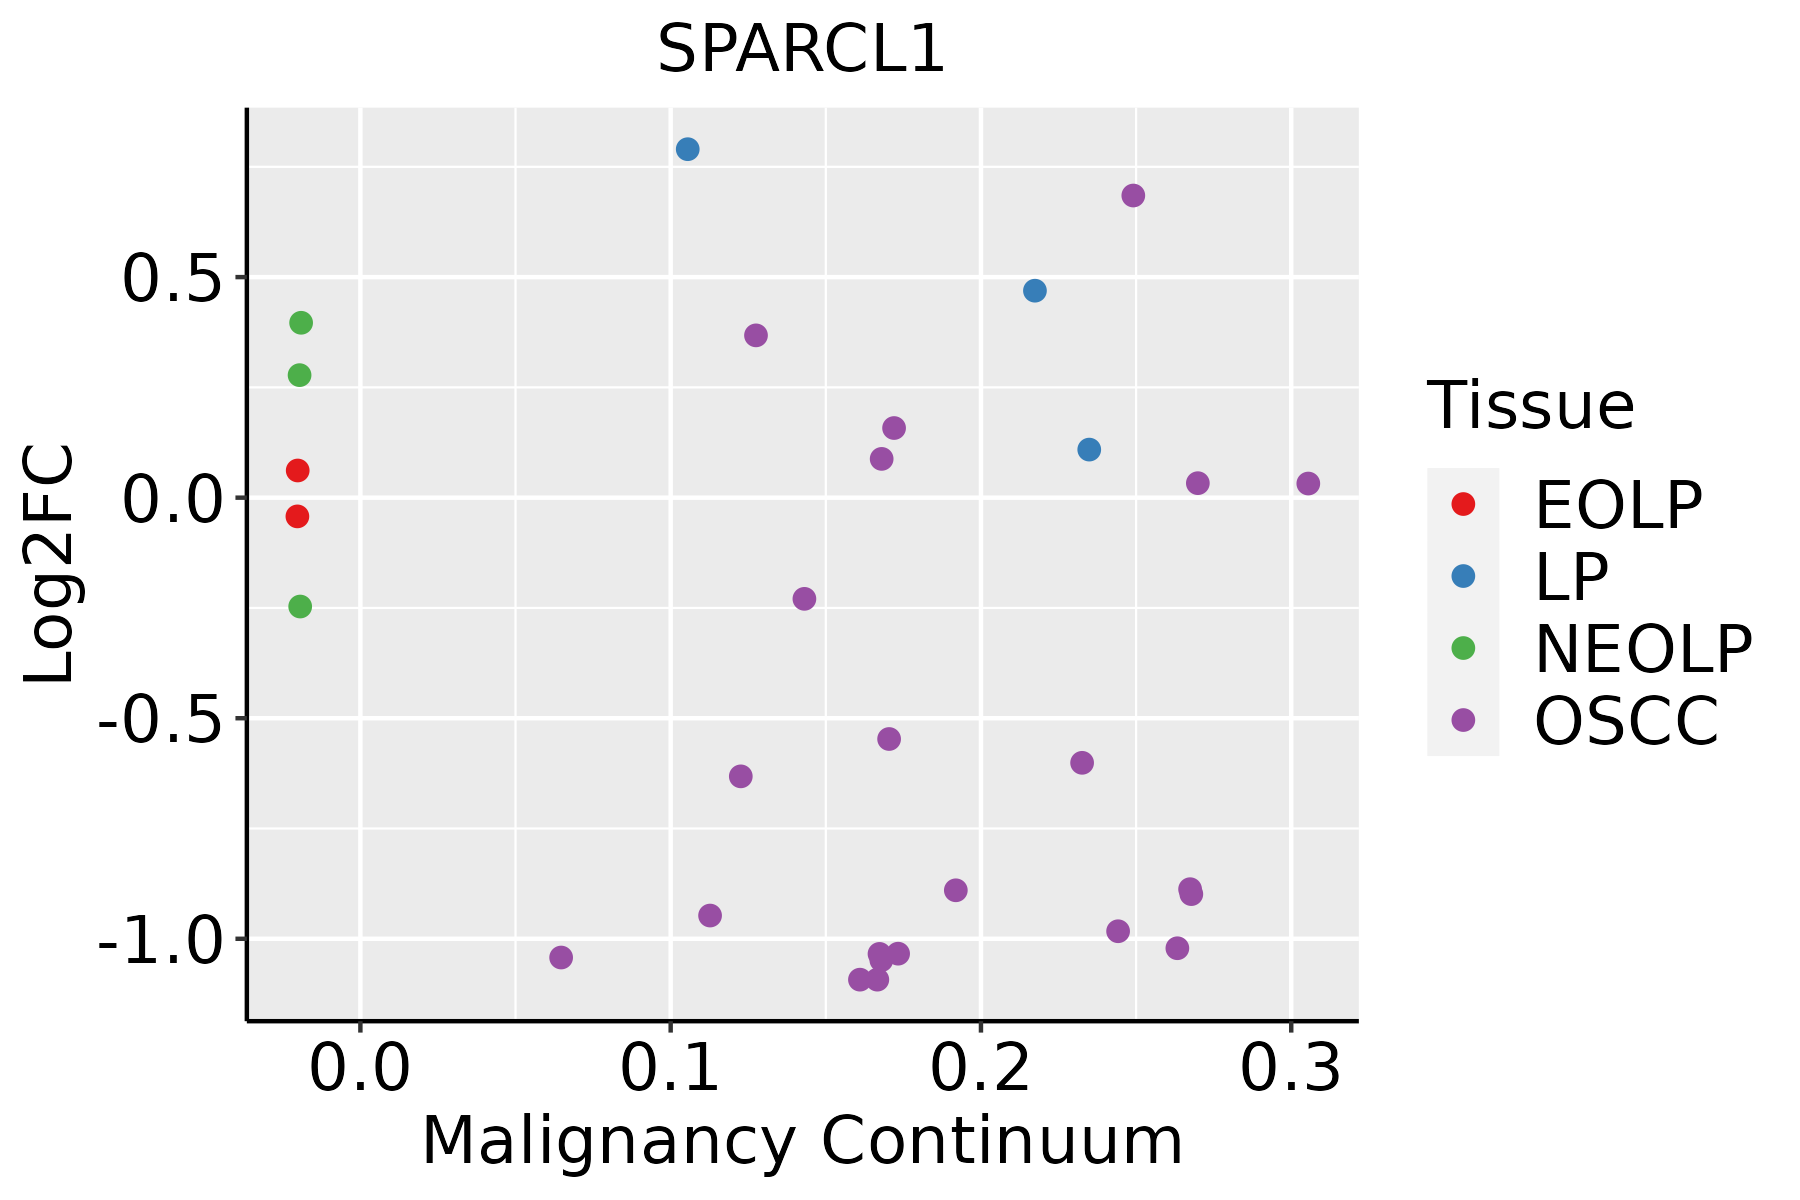 | EOLP: Erosive Oral lichen planus |
| LP: leukoplakia | ||
| NEOLP: Non-erosive oral lichen planus | ||
| OSCC: Oral squamous cell carcinoma | ||
| Prostate |  | BPH: Benign Prostatic Hyperplasia |
| Skin | 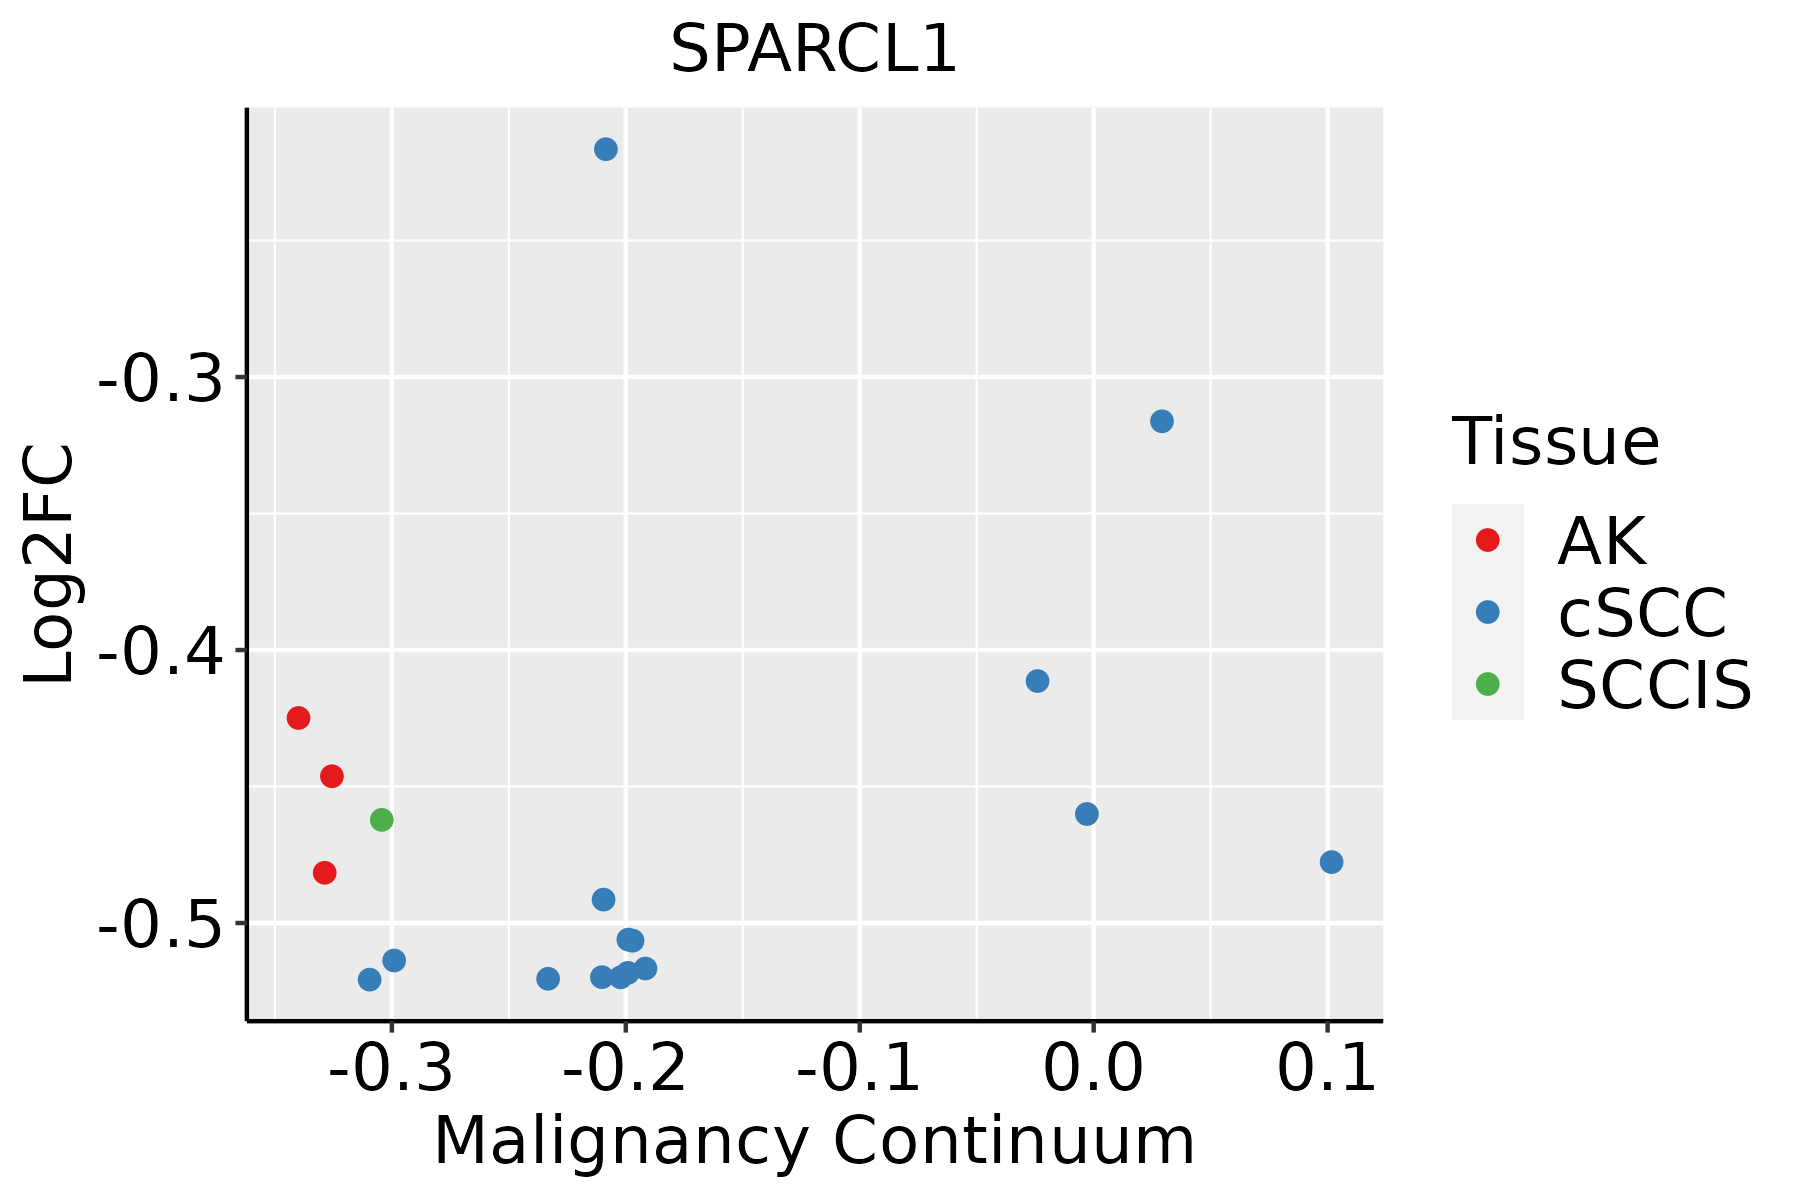 | AK: Actinic keratosis |
| cSCC: Cutaneous squamous cell carcinoma | ||
| SCCIS:squamous cell carcinoma in situ | ||
| Thyroid | 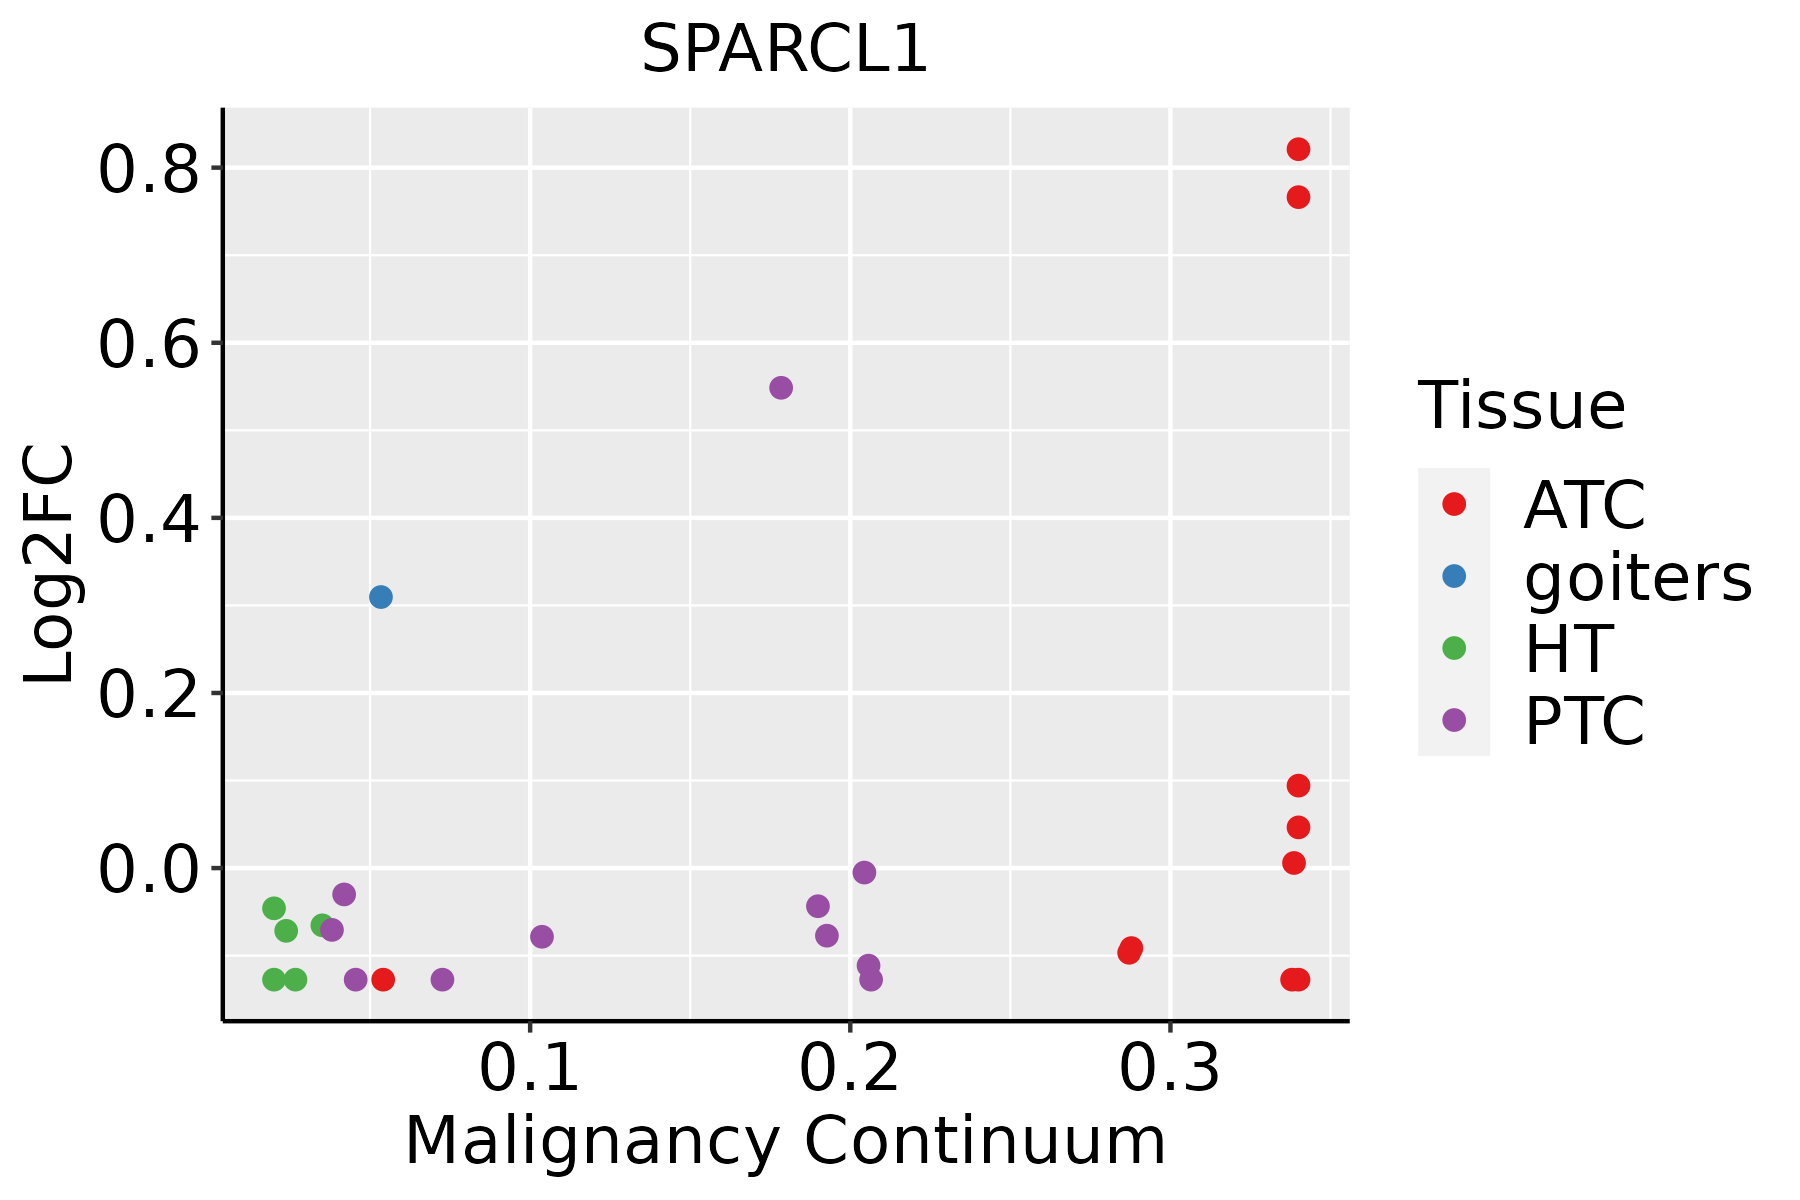 | ATC: Anaplastic thyroid cancer |
| HT: Hashimoto's thyroiditis | ||
| PTC: Papillary thyroid cancer |
| ∗log2FC in expression of this searched gene in stem-like cells from each diseased tissue sample relative to stem-like cells in normal samples in each tissue plotted against the malignancy continuum. Samples are colored based on if they are from different disease stage. |
Top |
Malignant transformation related pathway analysis |
| Find out the enriched GO biological processes and KEGG pathways involved in transition from healthy to precancer to cancer |
| Tissue | Disease Stage | Enriched GO biological Processes |
| Colorectum | AD |  |
| Colorectum | SER |  |
| Colorectum | MSS |  |
| Colorectum | MSI-H |  |
| Colorectum | FAP |  |
| ∗Top 15 enriched GO BP terms are showed in the bar plot of each disease state in each tissue. Each row represents a significant GO biological process which is colored according to the -log10(p.adjust). |
| Page: 1 2 3 4 5 6 7 8 9 |
| GO ID | Tissue | Disease Stage | Description | Gene Ratio | Bg Ratio | pvalue | p.adjust | Count |
| GO:0098742 | Cervix | N_HPV | cell-cell adhesion via plasma-membrane adhesion molecules | 17/534 | 273/18723 | 2.26e-03 | 2.11e-02 | 17 |
| GO:00508086 | Endometrium | AEH | synapse organization | 67/2100 | 426/18723 | 2.67e-03 | 1.94e-02 | 67 |
| GO:005080812 | Endometrium | EEC | synapse organization | 68/2168 | 426/18723 | 3.73e-03 | 2.49e-02 | 68 |
| GO:00508087 | Prostate | BPH | synapse organization | 103/3107 | 426/18723 | 3.19e-05 | 3.61e-04 | 103 |
| GO:005080813 | Prostate | Tumor | synapse organization | 105/3246 | 426/18723 | 7.20e-05 | 7.62e-04 | 105 |
| GO:00508088 | Skin | AK | synapse organization | 71/1910 | 426/18723 | 2.21e-05 | 4.07e-04 | 71 |
| GO:005080814 | Skin | SCCIS | synapse organization | 42/919 | 426/18723 | 1.43e-05 | 4.70e-04 | 42 |
| GO:00987421 | Skin | SCCIS | cell-cell adhesion via plasma-membrane adhesion molecules | 26/919 | 273/18723 | 9.83e-04 | 1.23e-02 | 26 |
| GO:00508089 | Thyroid | PTC | synapse organization | 161/5968 | 426/18723 | 5.11e-03 | 2.36e-02 | 161 |
| Page: 1 |
| Pathway ID | Tissue | Disease Stage | Description | Gene Ratio | Bg Ratio | pvalue | p.adjust | qvalue | Count |
| Page: 1 |
Top |
Cell-cell communication analysis |
| Identification of potential cell-cell interactions between two cell types and their ligand-receptor pairs for different disease states |
| Ligand | Receptor | LRpair | Pathway | Tissue | Disease Stage |
| Page: 1 |
Top |
Single-cell gene regulatory network inference analysis |
| Find out the significant the regulons (TFs) and the target genes of each regulon across cell types for different disease states |
| TF | Cell Type | Tissue | Disease Stage | Target Gene | RSS | Regulon Activity |
| ∗The dot plots of a searched regulon are shown for all cell subpopulations in each disease state of each tissue based on the regulon specific score inferred using pySCENIC and by calculating the average expression. |
| Page: 1 |
Top |
Somatic mutation of malignant transformation related genes |
| Annotation of somatic variants for genes involved in malignant transformation |
| Hugo Symbol | Variant Class | Variant Classification | dbSNP RS | HGVSc | HGVSp | HGVSp Short | SWISSPROT | BIOTYPE | SIFT | PolyPhen | Tumor Sample Barcode | Tissue | Histology | Sex | Age | Stage | Therapy Types | Drugs | Outcome |
| SPARCL1 | SNV | Missense_Mutation | novel | c.667G>C | p.Glu223Gln | p.E223Q | Q14515 | protein_coding | deleterious(0.04) | possibly_damaging(0.575) | TCGA-A2-A0CR-01 | Breast | breast invasive carcinoma | Female | <65 | I/II | Chemotherapy | adriamycin | CR |
| SPARCL1 | SNV | Missense_Mutation | novel | c.176C>T | p.Ser59Phe | p.S59F | Q14515 | protein_coding | deleterious(0.03) | possibly_damaging(0.656) | TCGA-AN-A046-01 | Breast | breast invasive carcinoma | Female | >=65 | I/II | Unknown | Unknown | SD |
| SPARCL1 | SNV | Missense_Mutation | c.1078N>A | p.Asp360Asn | p.D360N | Q14515 | protein_coding | deleterious(0.02) | benign(0.028) | TCGA-AN-A0FT-01 | Breast | breast invasive carcinoma | Female | <65 | I/II | Unknown | Unknown | SD | |
| SPARCL1 | SNV | Missense_Mutation | novel | c.1039N>A | p.Asp347Asn | p.D347N | Q14515 | protein_coding | tolerated(0.24) | possibly_damaging(0.539) | TCGA-BH-A0B6-01 | Breast | breast invasive carcinoma | Female | <65 | I/II | Unknown | Unknown | SD |
| SPARCL1 | SNV | Missense_Mutation | c.419T>C | p.Phe140Ser | p.F140S | Q14515 | protein_coding | tolerated(0.16) | benign(0.015) | TCGA-BH-A18U-01 | Breast | breast invasive carcinoma | Female | >=65 | III/IV | Unknown | Unknown | SD | |
| SPARCL1 | SNV | Missense_Mutation | novel | c.1418N>C | p.Gly473Ala | p.G473A | Q14515 | protein_coding | deleterious(0.03) | probably_damaging(1) | TCGA-OL-A66H-01 | Breast | breast invasive carcinoma | Female | >=65 | I/II | Unknown | Unknown | SD |
| SPARCL1 | insertion | Frame_Shift_Ins | novel | c.1040_1041insCAGGGTTTCACCTTGTTGG | p.Gly348ArgfsTer10 | p.G348Rfs*10 | Q14515 | protein_coding | TCGA-A8-A0A1-01 | Breast | breast invasive carcinoma | Female | >=65 | I/II | Hormone Therapy | tamoxiphen | SD | ||
| SPARCL1 | SNV | Missense_Mutation | c.907N>A | p.Glu303Lys | p.E303K | Q14515 | protein_coding | deleterious(0.04) | benign(0.009) | TCGA-C5-A1BN-01 | Cervix | cervical & endocervical cancer | Female | <65 | I/II | Chemotherapy | cisplatin | PD | |
| SPARCL1 | SNV | Missense_Mutation | c.232N>C | p.Glu78Gln | p.E78Q | Q14515 | protein_coding | deleterious(0.01) | benign(0.07) | TCGA-C5-A1BN-01 | Cervix | cervical & endocervical cancer | Female | <65 | I/II | Chemotherapy | cisplatin | PD | |
| SPARCL1 | SNV | Missense_Mutation | c.184N>A | p.Asp62Asn | p.D62N | Q14515 | protein_coding | tolerated(0.49) | benign(0.003) | TCGA-C5-A7CL-01 | Cervix | cervical & endocervical cancer | Female | <65 | III/IV | Chemotherapy | cisplatin | PD |
| Page: 1 2 3 4 5 6 7 8 9 |
Top |
Related drugs of malignant transformation related genes |
| Identification of chemicals and drugs interact with genes involved in malignant transfromation |
| (DGIdb 4.0) |
| Entrez ID | Symbol | Category | Interaction Types | Drug Claim Name | Drug Name | PMIDs |
| Page: 1 |

Copyright 2023-Present -The University of Texas Health Science Center at Houston |