
|
|||||
|
 | |
| |
| |
| |
| |
| |
|
Gene: SPARC |
Gene summary for SPARC |
| Gene information | Species | Human | Gene symbol | SPARC | Gene ID | 6678 |
| Gene name | secreted protein acidic and cysteine rich | |
| Gene Alias | BM-40 | |
| Cytomap | 5q33.1 | |
| Gene Type | protein-coding | GO ID | GO:0000902 | UniProtAcc | P09486 |
Top |
Malignant transformation analysis |
| Identification of the aberrant gene expression in precancerous and cancerous lesions by comparing the gene expression of stem-like cells in diseased tissues with normal stem cells |
| Entrez ID | Symbol | Replicates | Species | Organ | Tissue | Adj P-value | Log2FC | Malignancy |
| 6678 | SPARC | GSM4909281 | Human | Breast | IDC | 2.27e-28 | 6.17e-01 | 0.21 |
| 6678 | SPARC | GSM4909291 | Human | Breast | IDC | 2.88e-05 | 3.00e-01 | 0.1753 |
| 6678 | SPARC | GSM4909302 | Human | Breast | IDC | 9.36e-34 | 7.48e-01 | 0.1545 |
| 6678 | SPARC | DCIS2 | Human | Breast | DCIS | 4.27e-35 | 1.27e-01 | 0.0085 |
| 6678 | SPARC | AEH-subject1 | Human | Endometrium | AEH | 2.63e-42 | -1.05e+00 | -0.3059 |
| 6678 | SPARC | AEH-subject2 | Human | Endometrium | AEH | 1.34e-41 | -1.02e+00 | -0.2525 |
| 6678 | SPARC | AEH-subject3 | Human | Endometrium | AEH | 5.03e-36 | -1.03e+00 | -0.2576 |
| 6678 | SPARC | AEH-subject4 | Human | Endometrium | AEH | 1.05e-12 | -6.17e-01 | -0.2657 |
| 6678 | SPARC | AEH-subject5 | Human | Endometrium | AEH | 5.86e-38 | -1.09e+00 | -0.2953 |
| 6678 | SPARC | EEC-subject1 | Human | Endometrium | EEC | 6.57e-50 | -1.18e+00 | -0.2682 |
| 6678 | SPARC | EEC-subject2 | Human | Endometrium | EEC | 1.67e-54 | -1.19e+00 | -0.2607 |
| 6678 | SPARC | EEC-subject3 | Human | Endometrium | EEC | 2.62e-33 | -8.79e-01 | -0.2525 |
| 6678 | SPARC | EEC-subject4 | Human | Endometrium | EEC | 2.14e-27 | -8.92e-01 | -0.2571 |
| 6678 | SPARC | EEC-subject5 | Human | Endometrium | EEC | 7.98e-40 | -1.06e+00 | -0.249 |
| 6678 | SPARC | GSM5276934 | Human | Endometrium | EEC | 4.42e-28 | -8.98e-01 | -0.0913 |
| 6678 | SPARC | GSM5276935 | Human | Endometrium | EEC | 1.13e-55 | -1.21e+00 | -0.123 |
| 6678 | SPARC | GSM5276937 | Human | Endometrium | EEC | 3.66e-11 | -4.08e-01 | -0.0897 |
| 6678 | SPARC | GSM6177620_NYU_UCEC1_lib1_lib1 | Human | Endometrium | EEC | 1.73e-57 | -1.25e+00 | -0.1869 |
| 6678 | SPARC | GSM6177620_NYU_UCEC1_lib2_lib2 | Human | Endometrium | EEC | 4.72e-52 | -1.23e+00 | -0.1875 |
| 6678 | SPARC | GSM6177620_NYU_UCEC1_lib3_lib3 | Human | Endometrium | EEC | 2.67e-61 | -1.26e+00 | -0.1883 |
| Page: 1 2 3 4 5 6 |
| Tissue | Expression Dynamics | Abbreviation |
| Breast |  | IDC: Invasive ductal carcinoma |
| DCIS: Ductal carcinoma in situ | ||
| Precancer(BRCA1-mut): Precancerous lesion from BRCA1 mutation carriers | ||
| Endometrium | 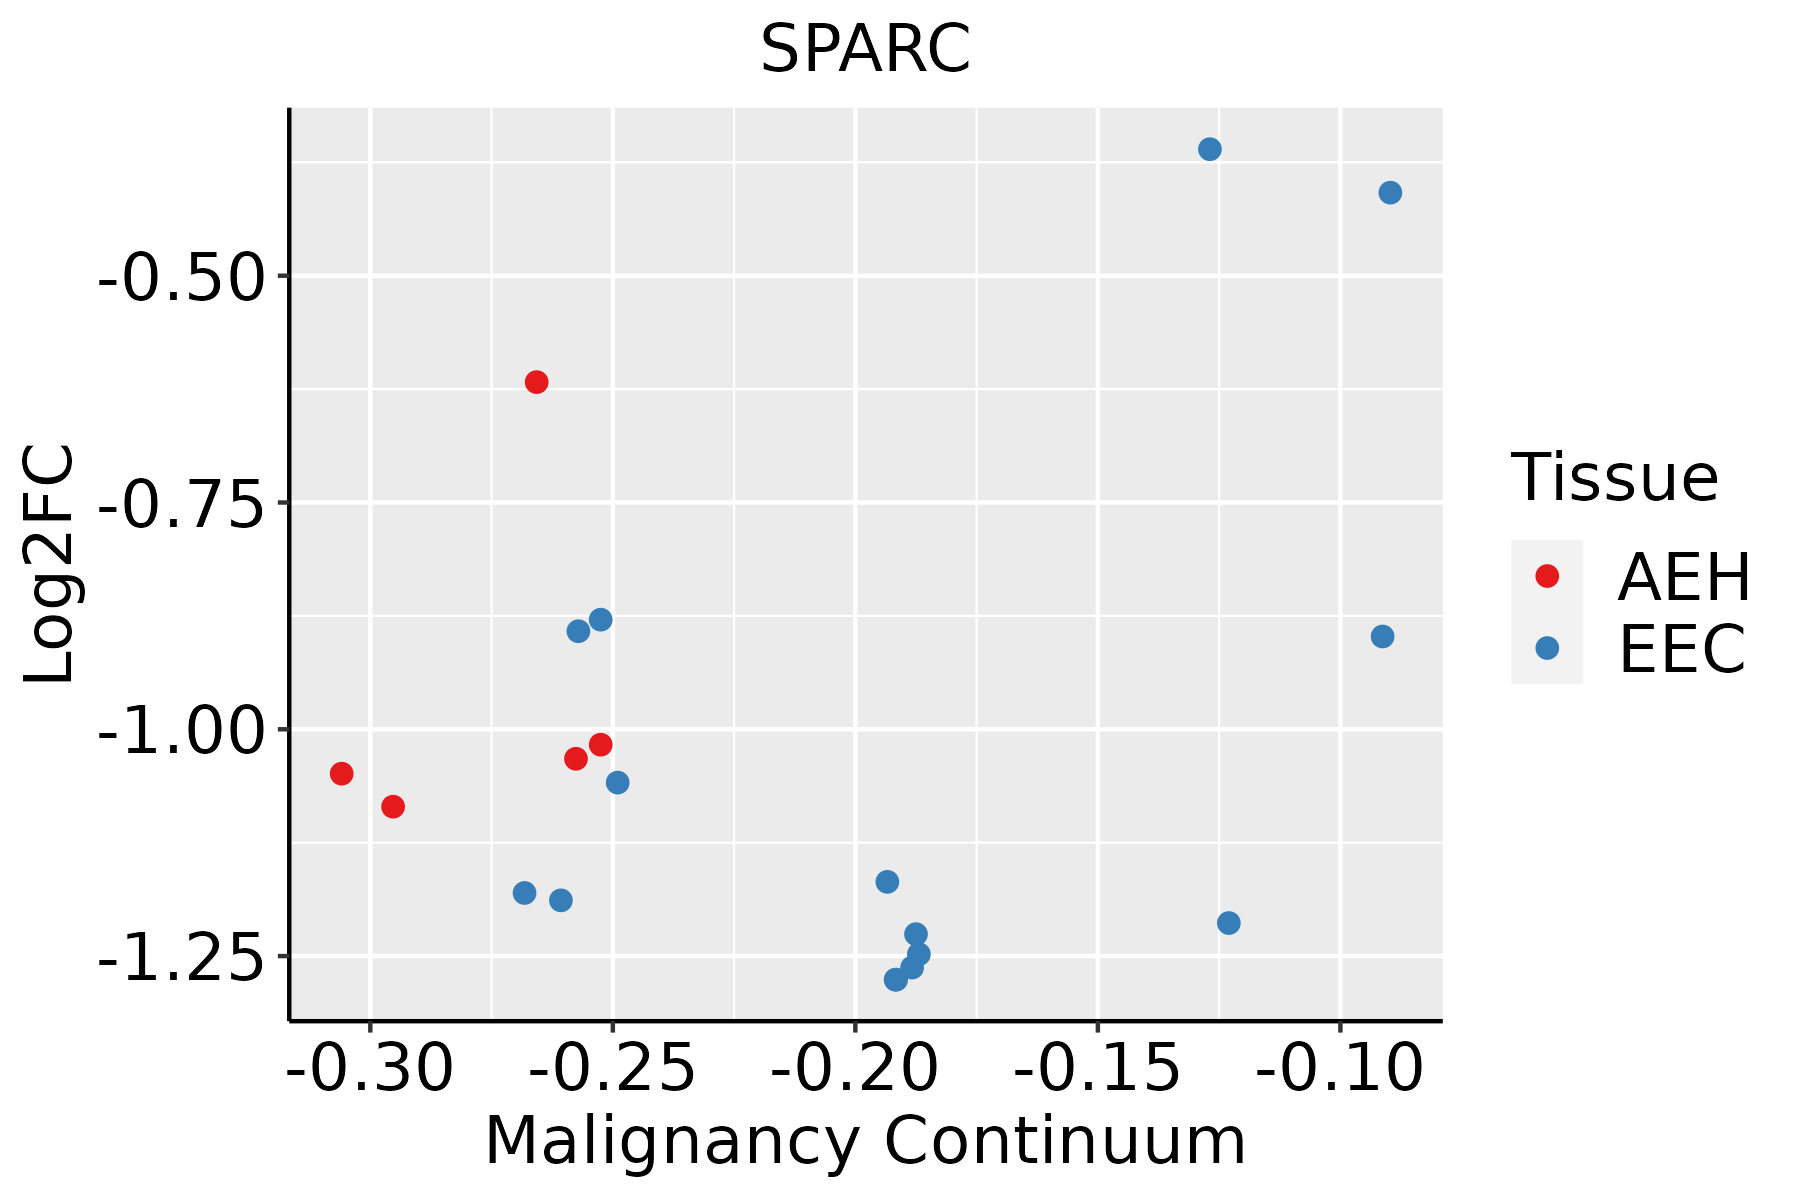 | AEH: Atypical endometrial hyperplasia |
| EEC: Endometrioid Cancer | ||
| Esophagus | 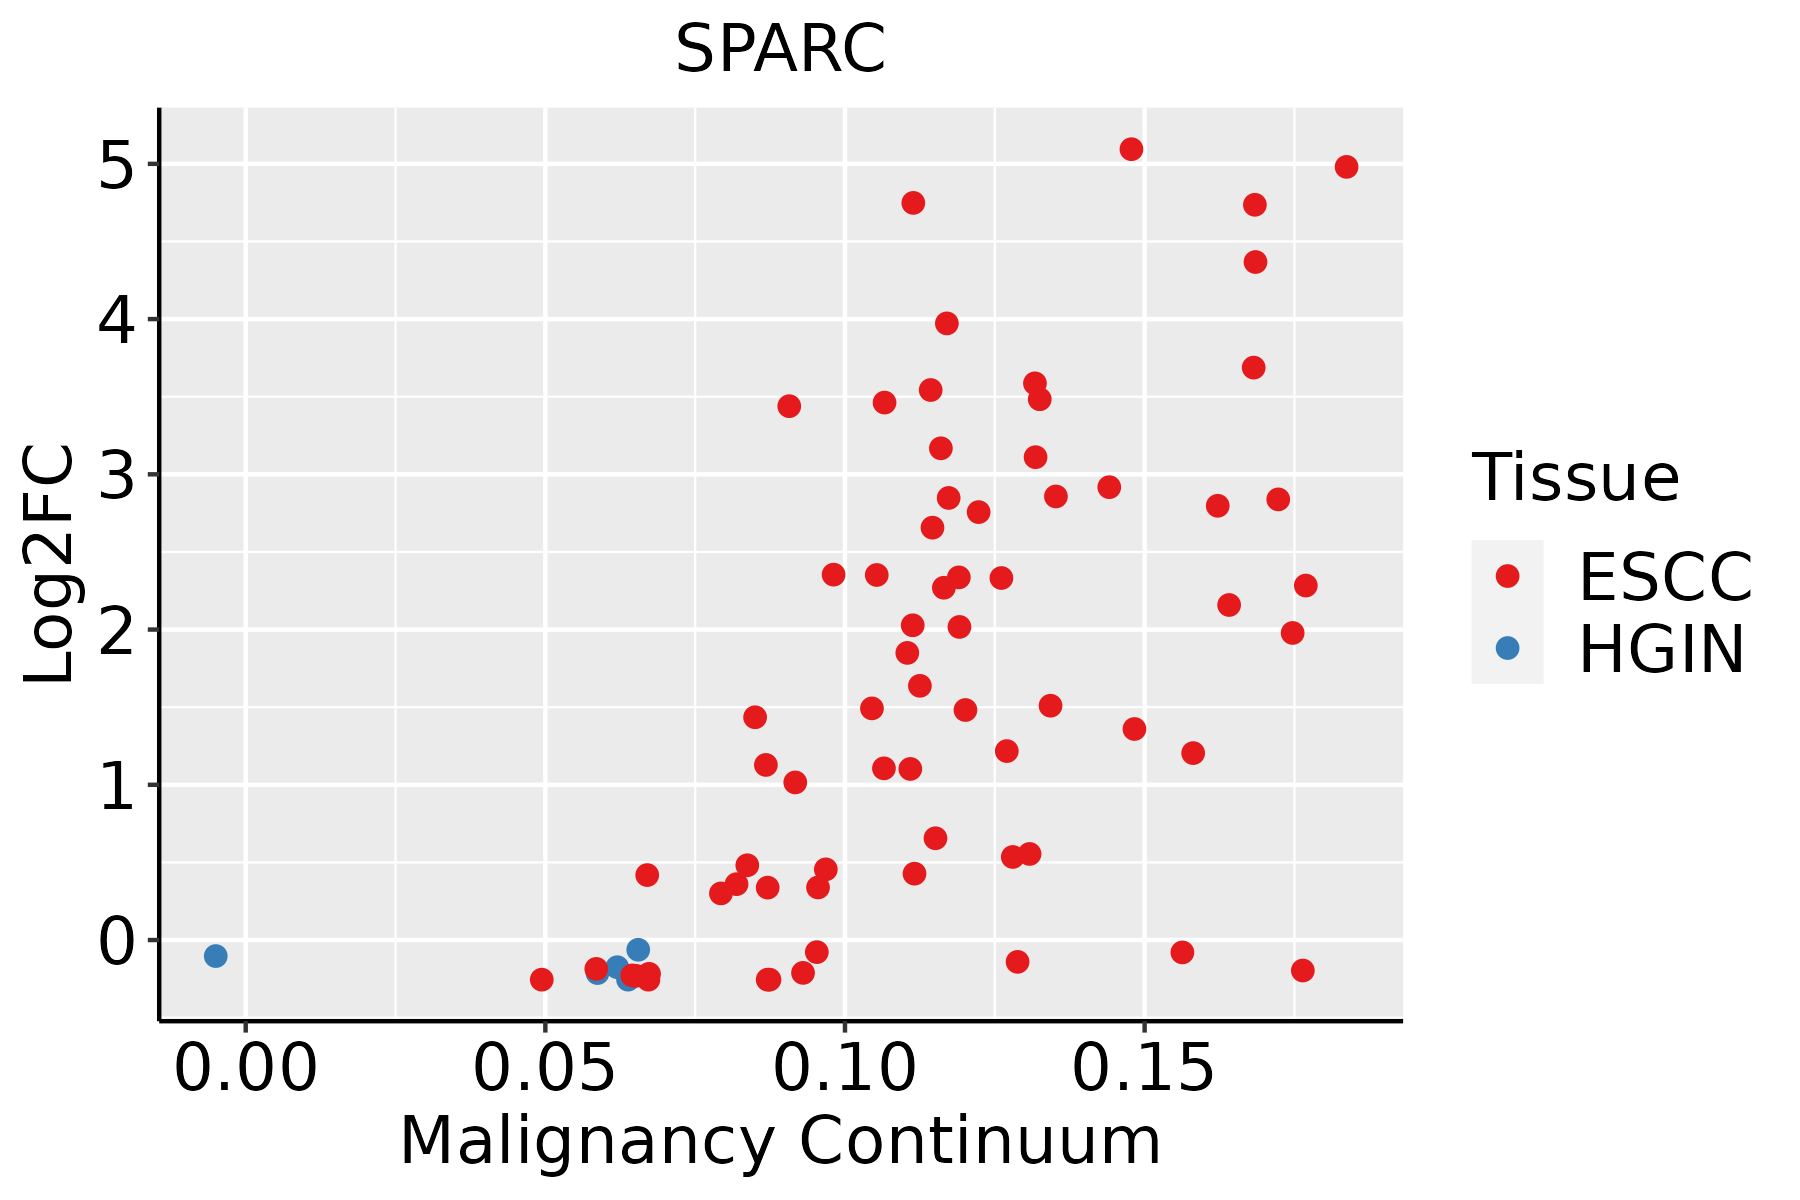 | ESCC: Esophageal squamous cell carcinoma |
| HGIN: High-grade intraepithelial neoplasias | ||
| LGIN: Low-grade intraepithelial neoplasias | ||
| Liver |  | HCC: Hepatocellular carcinoma |
| NAFLD: Non-alcoholic fatty liver disease | ||
| Oral Cavity | 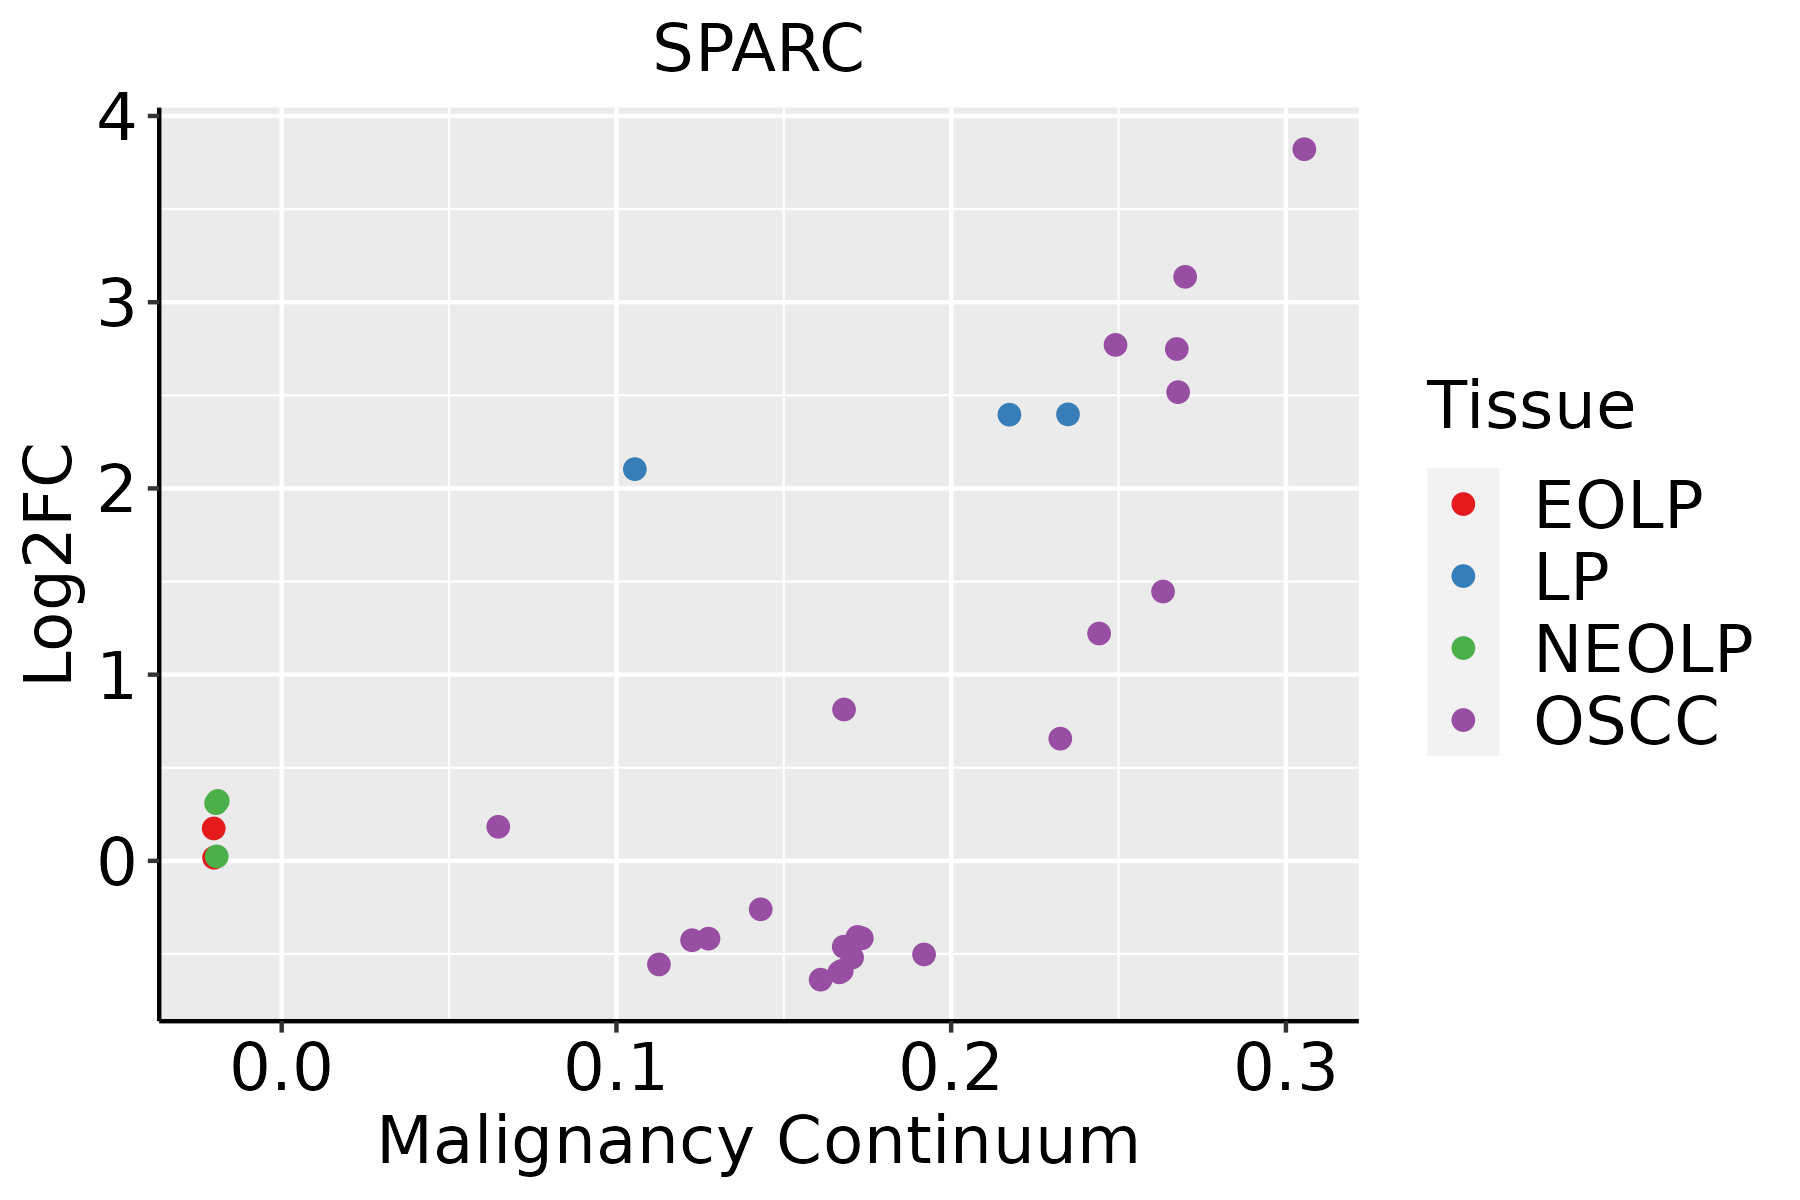 | EOLP: Erosive Oral lichen planus |
| LP: leukoplakia | ||
| NEOLP: Non-erosive oral lichen planus | ||
| OSCC: Oral squamous cell carcinoma | ||
| Skin | 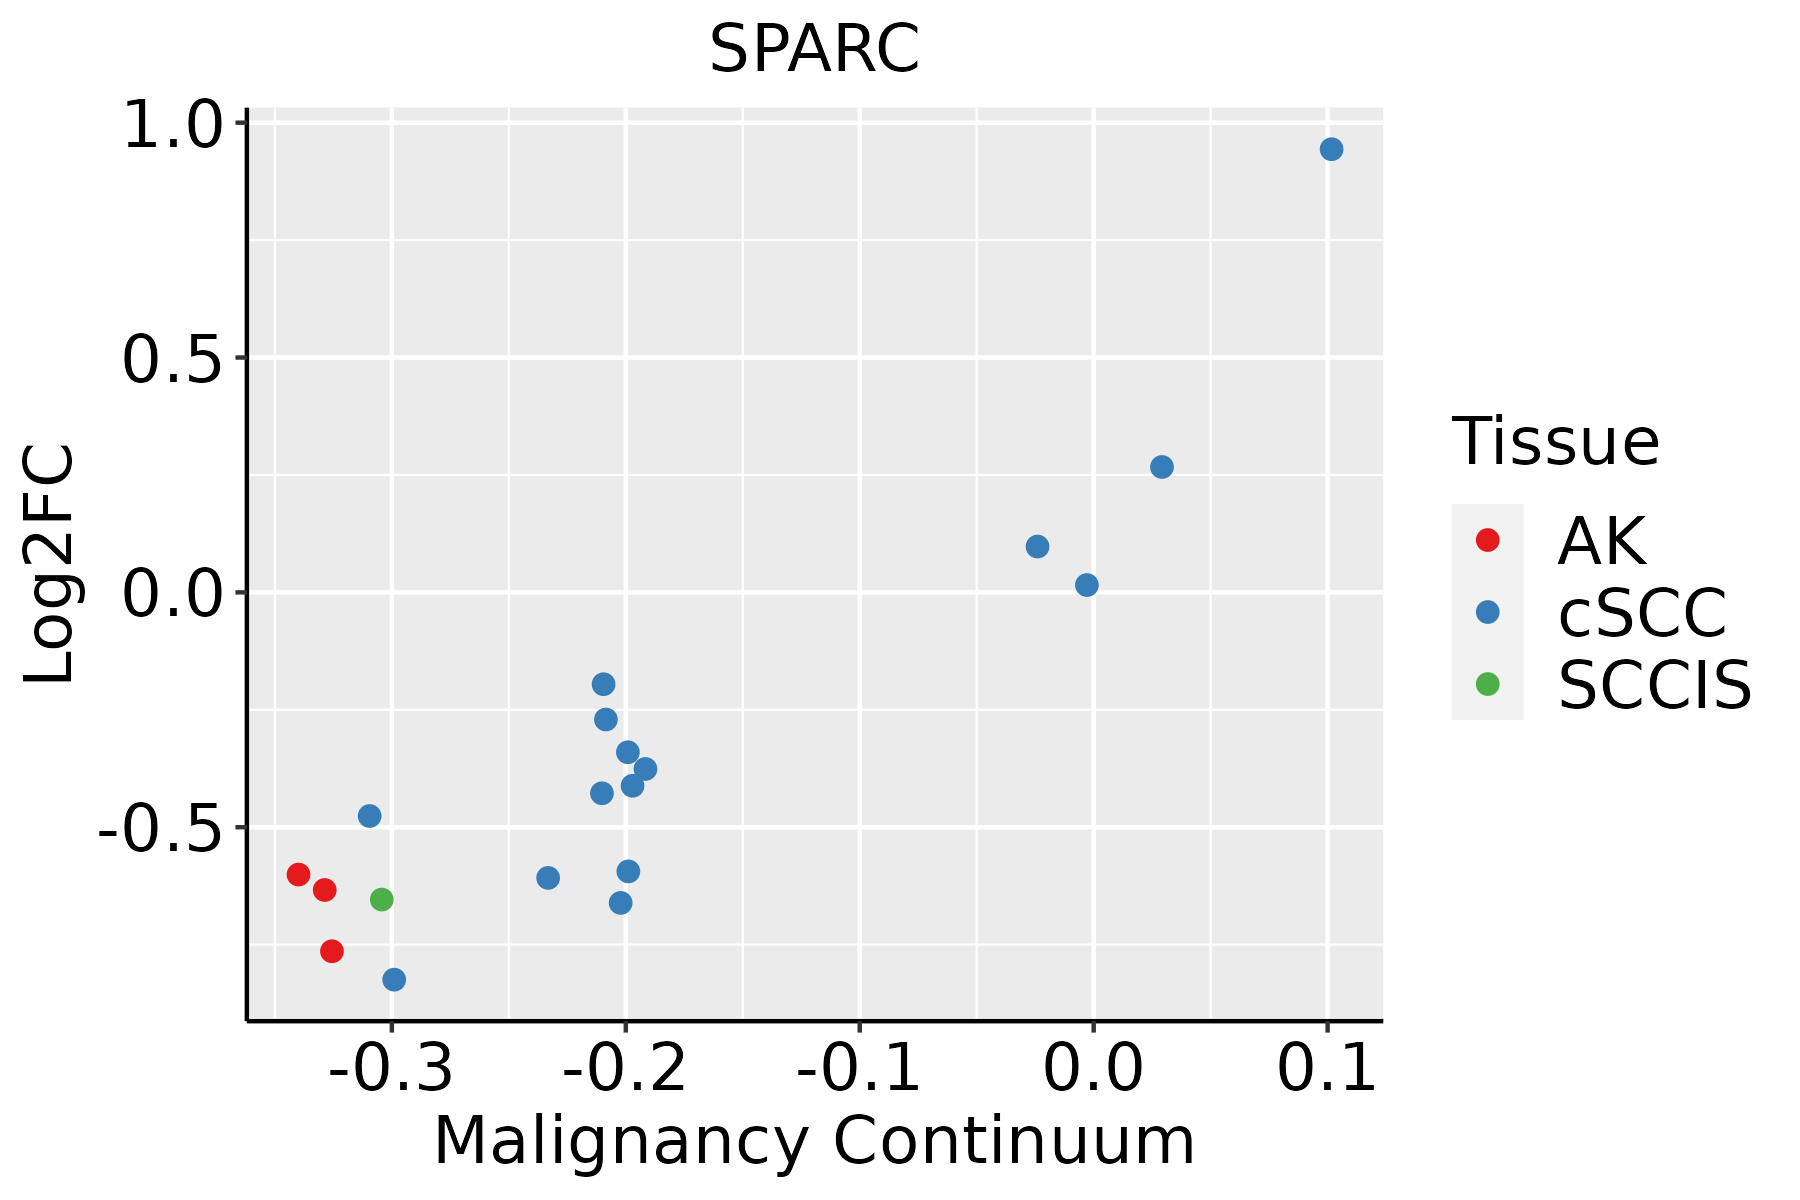 | AK: Actinic keratosis |
| cSCC: Cutaneous squamous cell carcinoma | ||
| SCCIS:squamous cell carcinoma in situ | ||
| Thyroid | 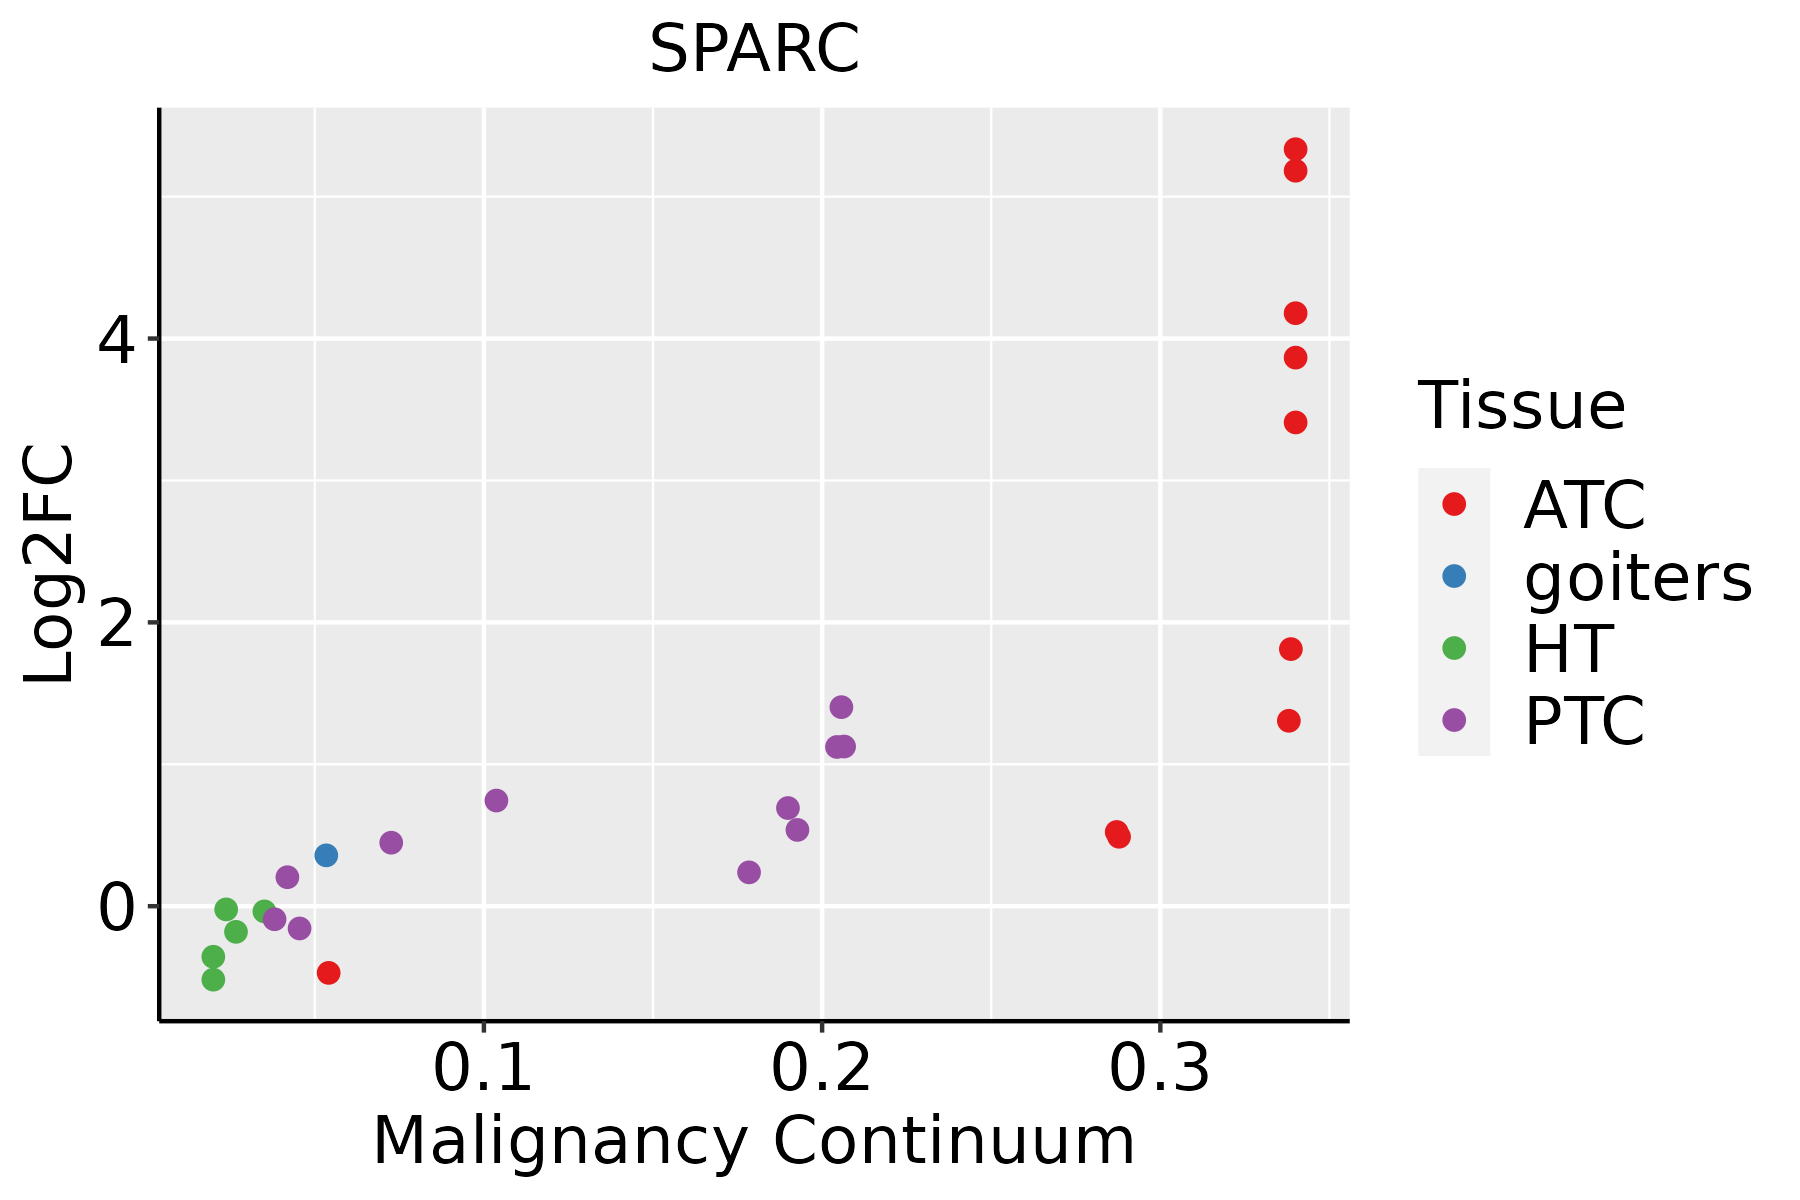 | ATC: Anaplastic thyroid cancer |
| HT: Hashimoto's thyroiditis | ||
| PTC: Papillary thyroid cancer |
| ∗log2FC in expression of this searched gene in stem-like cells from each diseased tissue sample relative to stem-like cells in normal samples in each tissue plotted against the malignancy continuum. Samples are colored based on if they are from different disease stage. |
Top |
Malignant transformation related pathway analysis |
| Find out the enriched GO biological processes and KEGG pathways involved in transition from healthy to precancer to cancer |
| Tissue | Disease Stage | Enriched GO biological Processes |
| Colorectum | AD |  |
| Colorectum | SER |  |
| Colorectum | MSS |  |
| Colorectum | MSI-H |  |
| Colorectum | FAP |  |
| ∗Top 15 enriched GO BP terms are showed in the bar plot of each disease state in each tissue. Each row represents a significant GO biological process which is colored according to the -log10(p.adjust). |
| Page: 1 2 3 4 5 6 7 8 9 |
| GO ID | Tissue | Disease Stage | Description | Gene Ratio | Bg Ratio | pvalue | p.adjust | Count |
| GO:004854514 | Breast | IDC | response to steroid hormone | 70/1434 | 339/18723 | 1.34e-14 | 4.23e-12 | 70 |
| GO:001003814 | Breast | IDC | response to metal ion | 65/1434 | 373/18723 | 2.95e-10 | 3.42e-08 | 65 |
| GO:003196013 | Breast | IDC | response to corticosteroid | 37/1434 | 167/18723 | 3.10e-09 | 2.63e-07 | 37 |
| GO:005138413 | Breast | IDC | response to glucocorticoid | 32/1434 | 148/18723 | 6.52e-08 | 4.07e-06 | 32 |
| GO:004668613 | Breast | IDC | response to cadmium ion | 19/1434 | 68/18723 | 4.97e-07 | 2.45e-05 | 19 |
| GO:000166714 | Breast | IDC | ameboidal-type cell migration | 64/1434 | 475/18723 | 6.65e-06 | 2.05e-04 | 64 |
| GO:005067313 | Breast | IDC | epithelial cell proliferation | 60/1434 | 437/18723 | 7.13e-06 | 2.15e-04 | 60 |
| GO:005067812 | Breast | IDC | regulation of epithelial cell proliferation | 54/1434 | 381/18723 | 8.07e-06 | 2.39e-04 | 54 |
| GO:001063112 | Breast | IDC | epithelial cell migration | 51/1434 | 357/18723 | 1.14e-05 | 3.08e-04 | 51 |
| GO:009013212 | Breast | IDC | epithelium migration | 51/1434 | 360/18723 | 1.44e-05 | 3.70e-04 | 51 |
| GO:003428414 | Breast | IDC | response to monosaccharide | 36/1434 | 225/18723 | 1.94e-05 | 4.83e-04 | 36 |
| GO:005159114 | Breast | IDC | response to cAMP | 20/1434 | 93/18723 | 2.00e-05 | 4.91e-04 | 20 |
| GO:009013012 | Breast | IDC | tissue migration | 51/1434 | 365/18723 | 2.11e-05 | 5.11e-04 | 51 |
| GO:003166714 | Breast | IDC | response to nutrient levels | 62/1434 | 474/18723 | 2.33e-05 | 5.57e-04 | 62 |
| GO:001063212 | Breast | IDC | regulation of epithelial cell migration | 43/1434 | 292/18723 | 2.61e-05 | 6.17e-04 | 43 |
| GO:001063413 | Breast | IDC | positive regulation of epithelial cell migration | 30/1434 | 176/18723 | 2.76e-05 | 6.50e-04 | 30 |
| GO:000974314 | Breast | IDC | response to carbohydrate | 38/1434 | 253/18723 | 4.87e-05 | 1.07e-03 | 38 |
| GO:004668312 | Breast | IDC | response to organophosphorus | 24/1434 | 131/18723 | 5.22e-05 | 1.12e-03 | 24 |
| GO:000758412 | Breast | IDC | response to nutrient | 29/1434 | 174/18723 | 5.69e-05 | 1.20e-03 | 29 |
| GO:003249612 | Breast | IDC | response to lipopolysaccharide | 47/1434 | 343/18723 | 7.13e-05 | 1.43e-03 | 47 |
| Page: 1 2 3 4 5 6 7 8 9 10 11 12 13 14 15 16 17 18 19 20 21 22 23 24 |
| Pathway ID | Tissue | Disease Stage | Description | Gene Ratio | Bg Ratio | pvalue | p.adjust | qvalue | Count |
| Page: 1 |
Top |
Cell-cell communication analysis |
| Identification of potential cell-cell interactions between two cell types and their ligand-receptor pairs for different disease states |
| Ligand | Receptor | LRpair | Pathway | Tissue | Disease Stage |
| Page: 1 |
Top |
Single-cell gene regulatory network inference analysis |
| Find out the significant the regulons (TFs) and the target genes of each regulon across cell types for different disease states |
| TF | Cell Type | Tissue | Disease Stage | Target Gene | RSS | Regulon Activity |
| ∗The dot plots of a searched regulon are shown for all cell subpopulations in each disease state of each tissue based on the regulon specific score inferred using pySCENIC and by calculating the average expression. |
| Page: 1 |
Top |
Somatic mutation of malignant transformation related genes |
| Annotation of somatic variants for genes involved in malignant transformation |
| Hugo Symbol | Variant Class | Variant Classification | dbSNP RS | HGVSc | HGVSp | HGVSp Short | SWISSPROT | BIOTYPE | SIFT | PolyPhen | Tumor Sample Barcode | Tissue | Histology | Sex | Age | Stage | Therapy Types | Drugs | Outcome |
| SPARC | SNV | Missense_Mutation | c.730N>A | p.Asp244Asn | p.D244N | P09486 | protein_coding | deleterious(0) | probably_damaging(1) | TCGA-AC-A23H-01 | Breast | breast invasive carcinoma | Female | >=65 | I/II | Unknown | Unknown | PD | |
| SPARC | SNV | Missense_Mutation | c.454A>G | p.Ile152Val | p.I152V | P09486 | protein_coding | deleterious(0.04) | benign(0.07) | TCGA-2W-A8YY-01 | Cervix | cervical & endocervical cancer | Female | <65 | I/II | Chemotherapy | cisplatin | CR | |
| SPARC | SNV | Missense_Mutation | novel | c.678G>A | p.Met226Ile | p.M226I | P09486 | protein_coding | deleterious(0.01) | benign(0.296) | TCGA-EA-A410-01 | Cervix | cervical & endocervical cancer | Female | <65 | I/II | Unknown | Unknown | SD |
| SPARC | SNV | Missense_Mutation | novel | c.413G>T | p.Gly138Val | p.G138V | P09486 | protein_coding | deleterious(0) | probably_damaging(0.999) | TCGA-5M-AAT6-01 | Colorectum | colon adenocarcinoma | Female | <65 | III/IV | Unknown | Unknown | PD |
| SPARC | SNV | Missense_Mutation | novel | c.49G>A | p.Ala17Thr | p.A17T | P09486 | protein_coding | tolerated_low_confidence(0.06) | benign(0.065) | TCGA-5M-AAT6-01 | Colorectum | colon adenocarcinoma | Female | <65 | III/IV | Unknown | Unknown | PD |
| SPARC | SNV | Missense_Mutation | c.770N>T | p.Ala257Val | p.A257V | P09486 | protein_coding | tolerated(0.14) | probably_damaging(0.996) | TCGA-A6-2686-01 | Colorectum | colon adenocarcinoma | Female | >=65 | I/II | Unknown | Unknown | SD | |
| SPARC | SNV | Missense_Mutation | rs532217814 | c.844G>A | p.Ala282Thr | p.A282T | P09486 | protein_coding | tolerated(0.54) | benign(0.284) | TCGA-A6-6141-01 | Colorectum | colon adenocarcinoma | Male | <65 | I/II | Chemotherapy | 5-fu | SD |
| SPARC | SNV | Missense_Mutation | c.261N>T | p.Glu87Asp | p.E87D | P09486 | protein_coding | tolerated(0.29) | benign(0) | TCGA-AA-3510-01 | Colorectum | colon adenocarcinoma | Male | >=65 | I/II | Unknown | Unknown | SD | |
| SPARC | SNV | Missense_Mutation | rs373654699 | c.661G>A | p.Glu221Lys | p.E221K | P09486 | protein_coding | tolerated(0.33) | benign(0.007) | TCGA-AA-3977-01 | Colorectum | colon adenocarcinoma | Male | >=65 | I/II | Unknown | Unknown | SD |
| SPARC | SNV | Missense_Mutation | novel | c.131N>A | p.Gly44Glu | p.G44E | P09486 | protein_coding | deleterious(0.02) | probably_damaging(0.999) | TCGA-AA-3984-01 | Colorectum | colon adenocarcinoma | Female | <65 | I/II | Unknown | Unknown | SD |
| Page: 1 2 3 4 5 6 |
Top |
Related drugs of malignant transformation related genes |
| Identification of chemicals and drugs interact with genes involved in malignant transfromation |
| (DGIdb 4.0) |
| Entrez ID | Symbol | Category | Interaction Types | Drug Claim Name | Drug Name | PMIDs |
| 6678 | SPARC | CELL SURFACE, DRUGGABLE GENOME | NAB-PACLITAXEL |
| Page: 1 |

Copyright 2023-Present -The University of Texas Health Science Center at Houston |