Schematic overview of the cellular and molecular mechanisms involved in the cancer progression, including the proposed cellular and molecular mechanisms in cancer cells trajectory. AT1: alveolar type 1 cells; AT2: alveolar type 2 cells; AAH: atypical adenomatous hyperplasia; AIS: adenocarcinoma in situ; MIA: minimally invasive adenocarcinoma; IA: invasive adenocarcinoma; EMT: epithelial-mesenchymal transition

Home

Download

Statistics

Help

Contact

Center for Computational Systems Medicine
leaf

Gene summary

leaf

Malignant transformation analysis

leaf

Malignant transformation related pathway analysis

leaf

Cell-cell communication analysis

leaf

Single-cell gene regulatory network inference analysis

leaf

Somatic mutation of malignant transformation related genes

leaf

Related drugs of malignant transformation related genes

Gene: SPAG9

Gene summary for SPAG9

check button Gene summary.

Gene informationSpeciesHuman
Gene symbol

SPAG9

Gene ID

9043

Gene namesperm associated antigen 9
Gene AliasCT89
Cytomap17q21.33
Gene Typeprotein-coding
GO ID

GO:0000165

UniProtAcc

O60271


Top

Malignant transformation analysis

check button Identification of the aberrant gene expression in precancerous and cancerous lesions by comparing the gene expression of stem-like cells in diseased tissues with normal stem cells
check button Malignant transformation involving gene list.
Entrez IDSymbolReplicatesSpeciesOrganTissueAdj P-valueLog2FCMalignancy
9043SPAG9CA_HPV_1HumanCervixCC2.43e-043.40e-020.0264
9043SPAG9CCI_2HumanCervixCC5.60e-051.02e+000.5249
9043SPAG9AEH-subject1HumanEndometriumAEH5.63e-114.29e-01-0.3059
9043SPAG9AEH-subject2HumanEndometriumAEH5.07e-032.10e-01-0.2525
9043SPAG9AEH-subject3HumanEndometriumAEH4.51e-021.86e-01-0.2576
9043SPAG9AEH-subject4HumanEndometriumAEH7.58e-196.15e-01-0.2657
9043SPAG9AEH-subject5HumanEndometriumAEH7.37e-206.46e-01-0.2953
9043SPAG9EEC-subject1HumanEndometriumEEC3.24e-123.85e-01-0.2682
9043SPAG9EEC-subject2HumanEndometriumEEC8.60e-032.40e-01-0.2607
9043SPAG9EEC-subject3HumanEndometriumEEC4.33e-224.55e-01-0.2525
9043SPAG9EEC-subject4HumanEndometriumEEC3.09e-114.35e-01-0.2571
9043SPAG9EEC-subject5HumanEndometriumEEC4.93e-084.37e-01-0.249
9043SPAG9GSM5276934HumanEndometriumEEC1.12e-226.56e-01-0.0913
9043SPAG9GSM5276937HumanEndometriumEEC1.25e-479.14e-01-0.0897
9043SPAG9GSM6177620_NYU_UCEC1_lib1_lib1HumanEndometriumEEC9.31e-11-1.33e-01-0.1869
9043SPAG9GSM6177620_NYU_UCEC1_lib2_lib2HumanEndometriumEEC2.44e-08-1.01e-01-0.1875
9043SPAG9GSM6177620_NYU_UCEC1_lib3_lib3HumanEndometriumEEC1.35e-09-1.81e-01-0.1883
9043SPAG9GSM6177621_NYU_UCEC2_lib1_lib1HumanEndometriumEEC4.39e-08-1.97e-01-0.1934
9043SPAG9GSM6177622_NYU_UCEC3_lib1_lib1HumanEndometriumEEC4.88e-16-5.84e-02-0.1917
9043SPAG9GSM6177622_NYU_UCEC3_lib2_lib2HumanEndometriumEEC2.59e-15-1.26e-01-0.1916
Page: 1 2 3 4 5 6 7 8 9 10 11 12 

check button Transcriptomic changes along malignancy continuum.
TissueExpression DynamicsAbbreviation
CervixThe image shows the transcriptomic changes along malignancy continuum.log2FC in expression of this searched gene in stem-like cells from each diseased tissue sample relative to stem-like cells in normal samples in each tissue plotted against the malignancy continuum. Samples are colored based on if they are from different disease stage.CC: Cervix cancer
HSIL_HPV: HPV-infected high-grade squamous intraepithelial lesions
N_HPV: HPV-infected normal cervix
EndometriumThe image shows the transcriptomic changes along malignancy continuum.log2FC in expression of this searched gene in stem-like cells from each diseased tissue sample relative to stem-like cells in normal samples in each tissue plotted against the malignancy continuum. Samples are colored based on if they are from different disease stage.
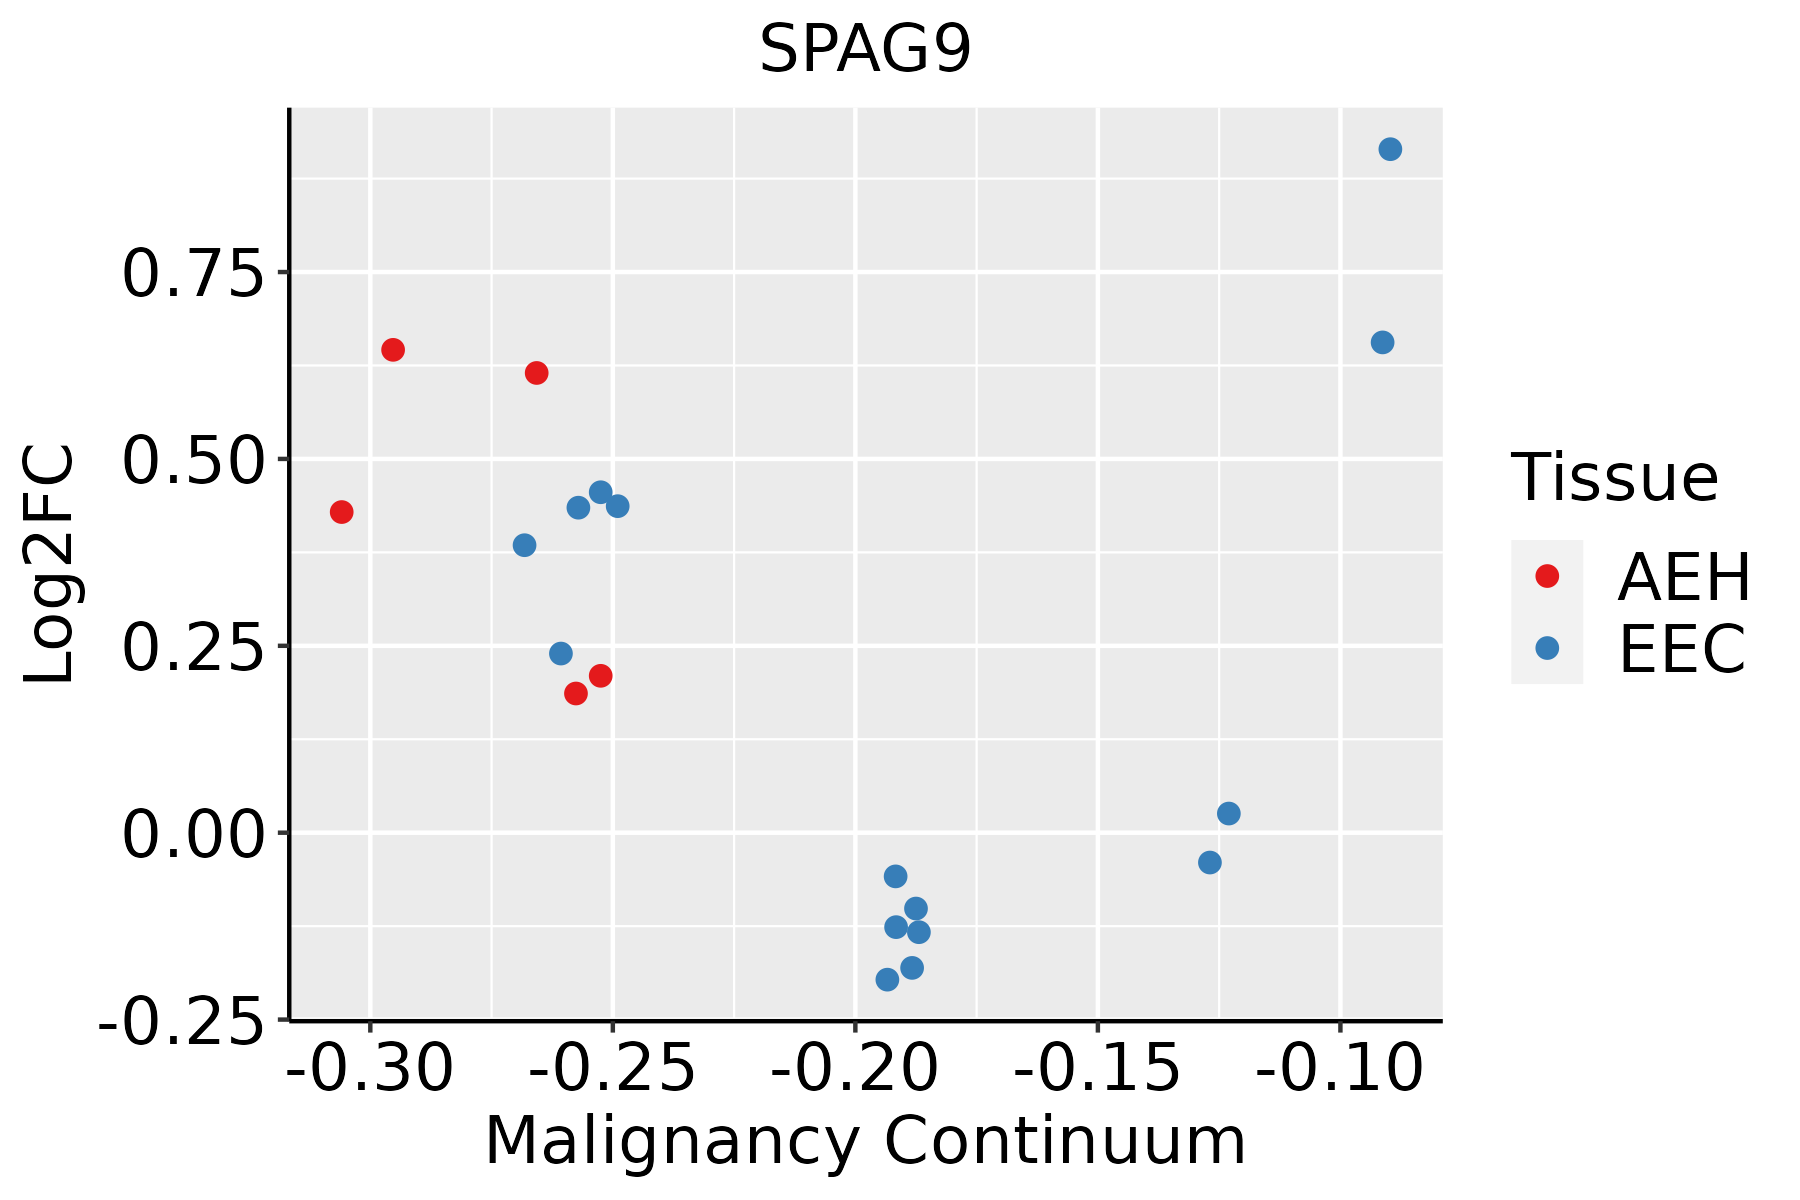
AEH: Atypical endometrial hyperplasia
EEC: Endometrioid Cancer
EsophagusThe image shows the transcriptomic changes along malignancy continuum.log2FC in expression of this searched gene in stem-like cells from each diseased tissue sample relative to stem-like cells in normal samples in each tissue plotted against the malignancy continuum. Samples are colored based on if they are from different disease stage.
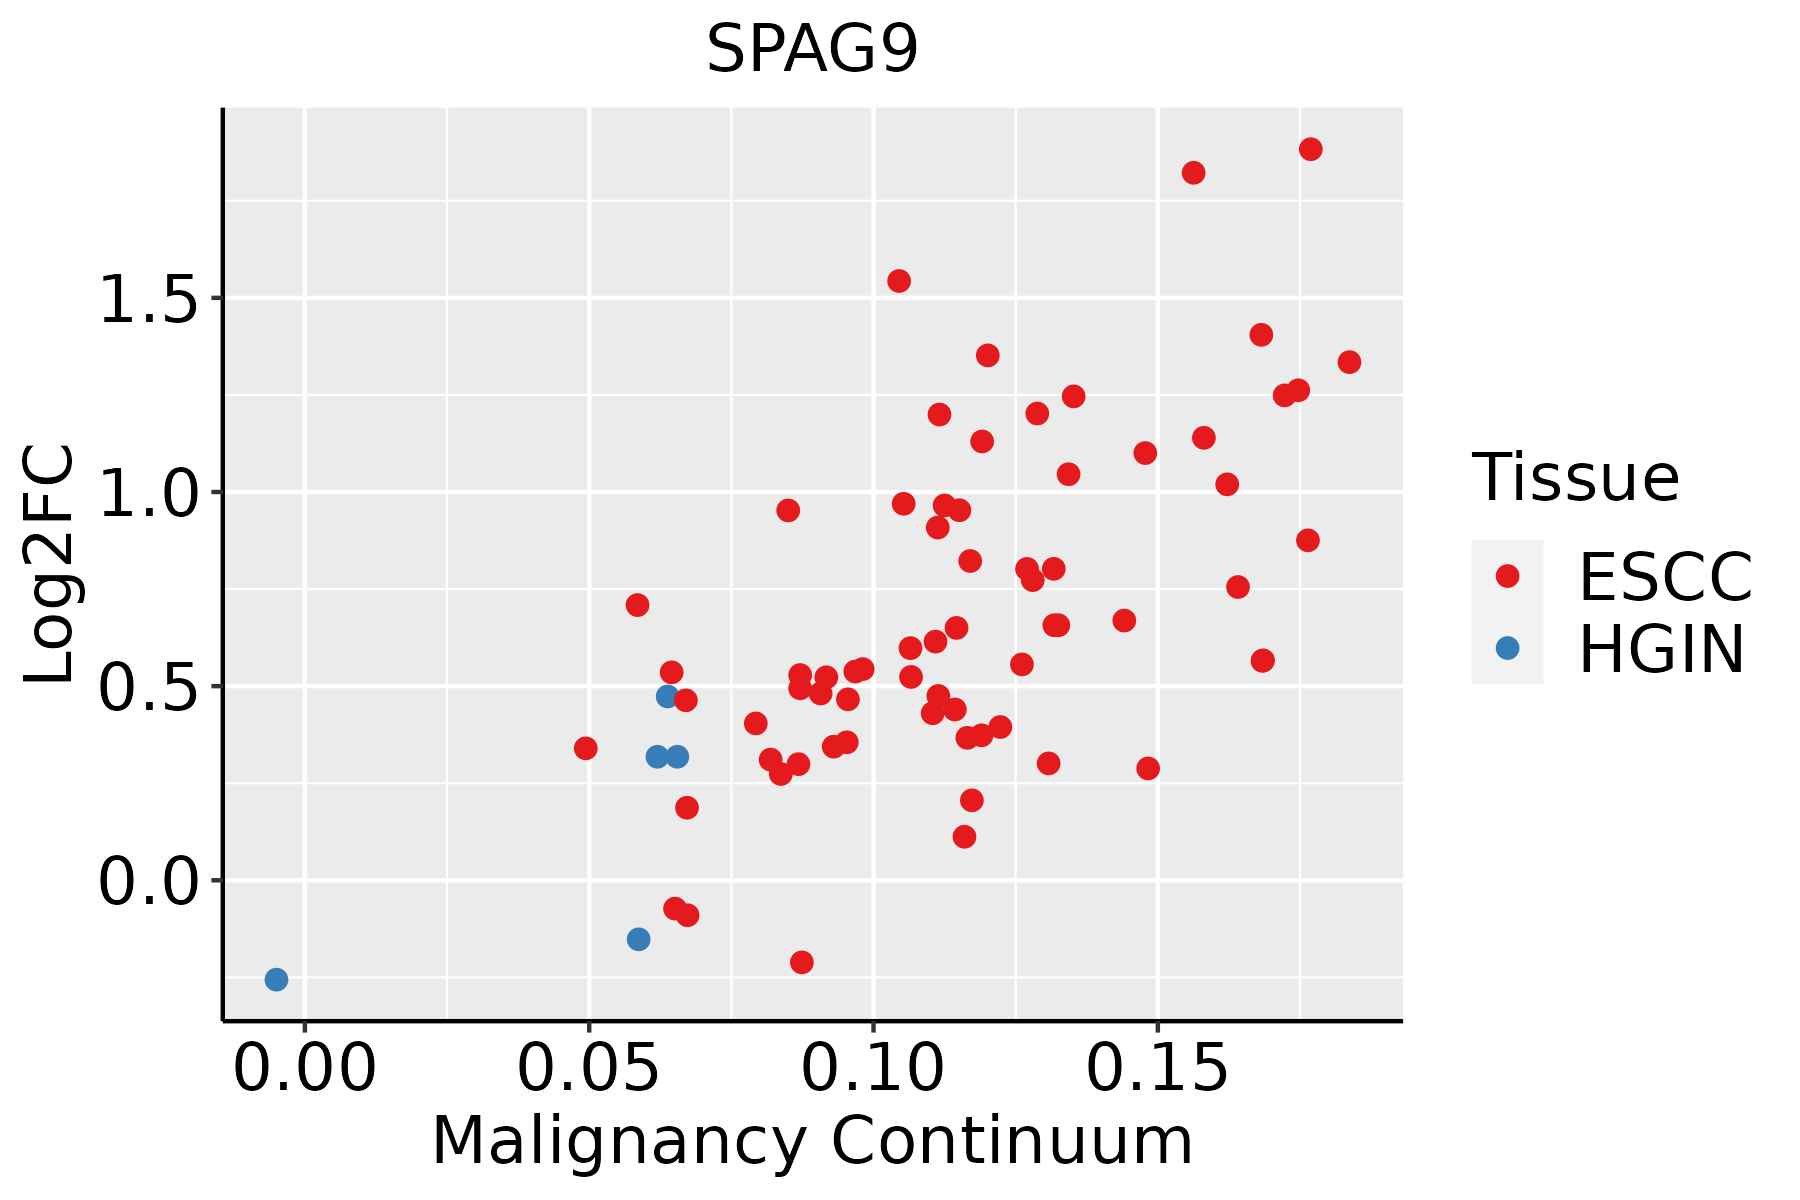
ESCC: Esophageal squamous cell carcinoma
HGIN: High-grade intraepithelial neoplasias
LGIN: Low-grade intraepithelial neoplasias
GCThe image shows the transcriptomic changes along malignancy continuum.log2FC in expression of this searched gene in stem-like cells from each diseased tissue sample relative to stem-like cells in normal samples in each tissue plotted against the malignancy continuum. Samples are colored based on if they are from different disease stage.CAG: Chronic atrophic gastritis
CAG with IM: Chronic atrophic gastritis with intestinal metaplasia
CSG: Chronic superficial gastritis
GC: Gastric cancer
SIM: Severe intestinal metaplasia
WIM: Wild intestinal metaplasia
LiverThe image shows the transcriptomic changes along malignancy continuum.log2FC in expression of this searched gene in stem-like cells from each diseased tissue sample relative to stem-like cells in normal samples in each tissue plotted against the malignancy continuum. Samples are colored based on if they are from different disease stage.HCC: Hepatocellular carcinoma
NAFLD: Non-alcoholic fatty liver disease
LungThe image shows the transcriptomic changes along malignancy continuum.log2FC in expression of this searched gene in stem-like cells from each diseased tissue sample relative to stem-like cells in normal samples in each tissue plotted against the malignancy continuum. Samples are colored based on if they are from different disease stage.
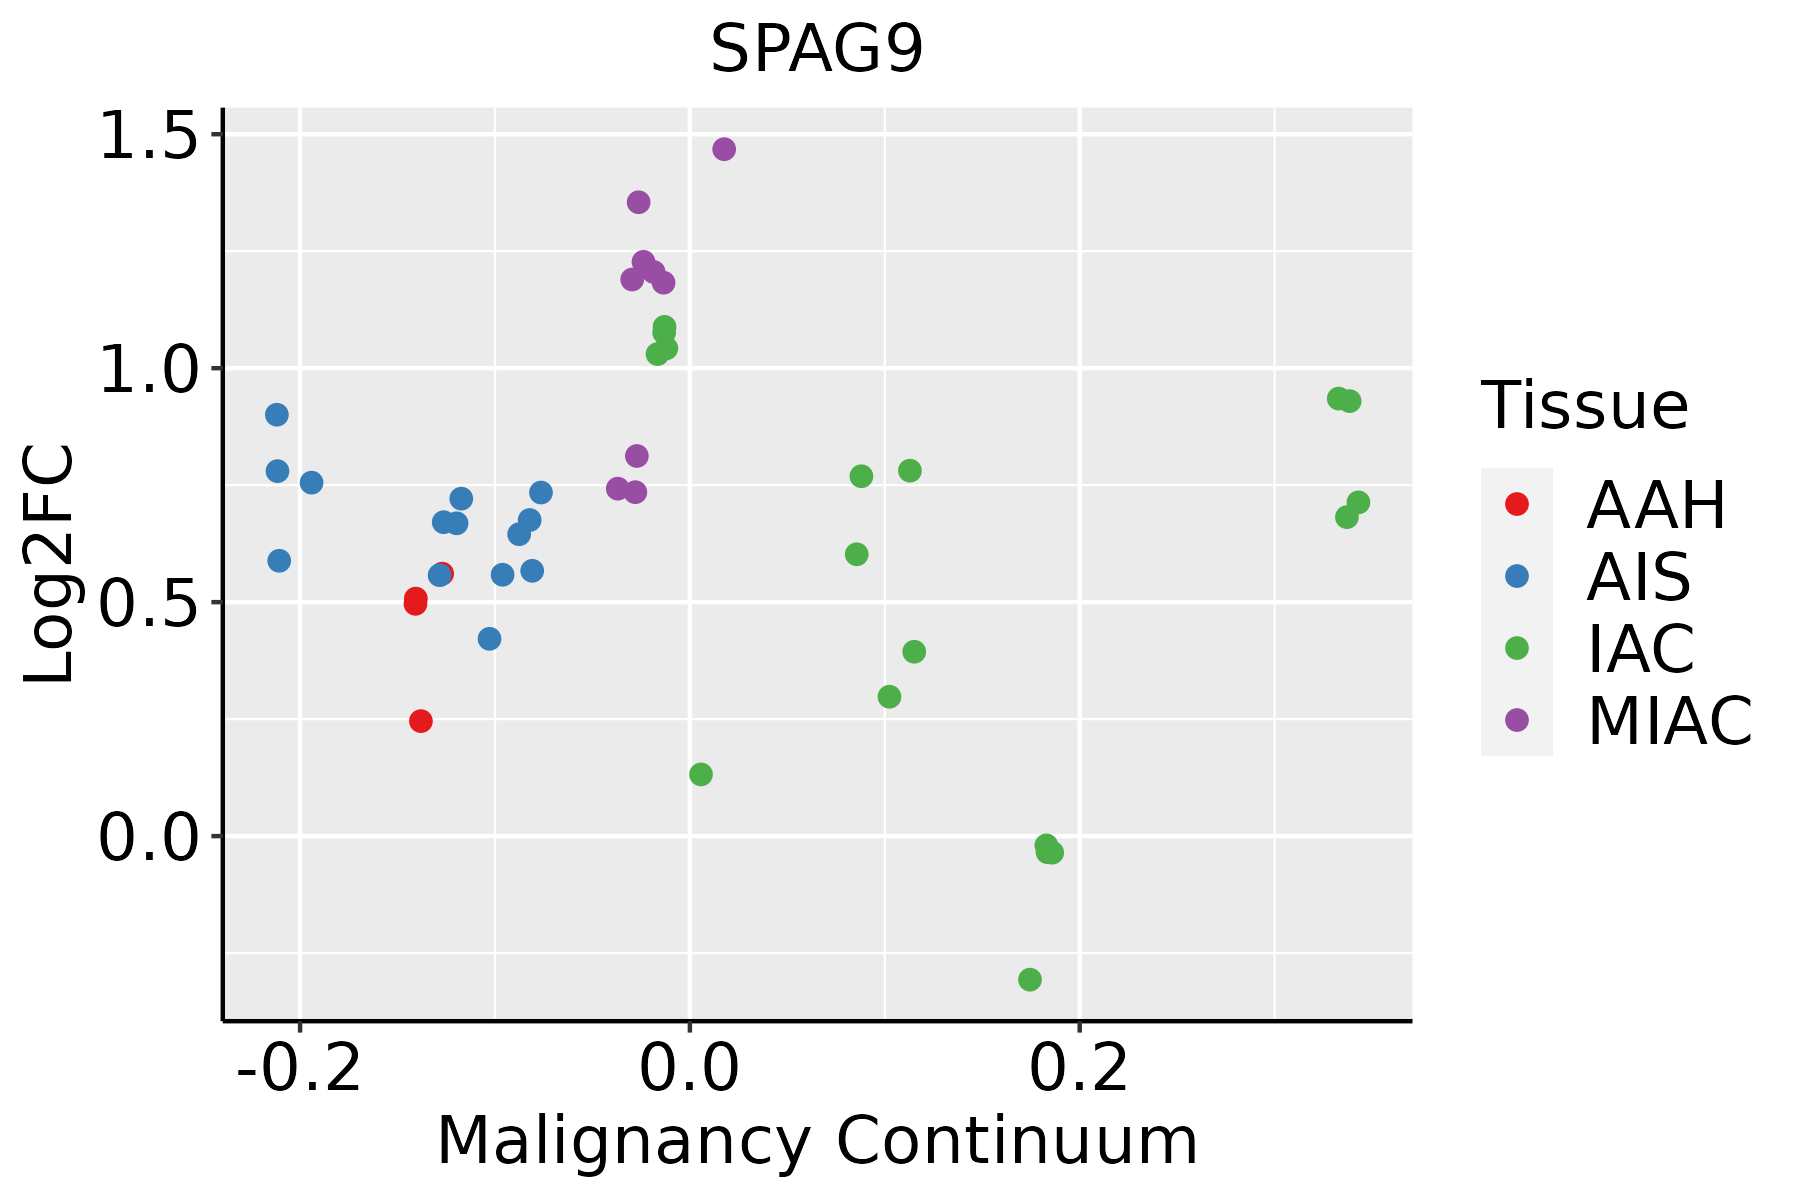
AAH: Atypical adenomatous hyperplasia
AIS: Adenocarcinoma in situ
IAC: Invasive lung adenocarcinoma
MIA: Minimally invasive adenocarcinoma
Oral CavityThe image shows the transcriptomic changes along malignancy continuum.log2FC in expression of this searched gene in stem-like cells from each diseased tissue sample relative to stem-like cells in normal samples in each tissue plotted against the malignancy continuum. Samples are colored based on if they are from different disease stage.
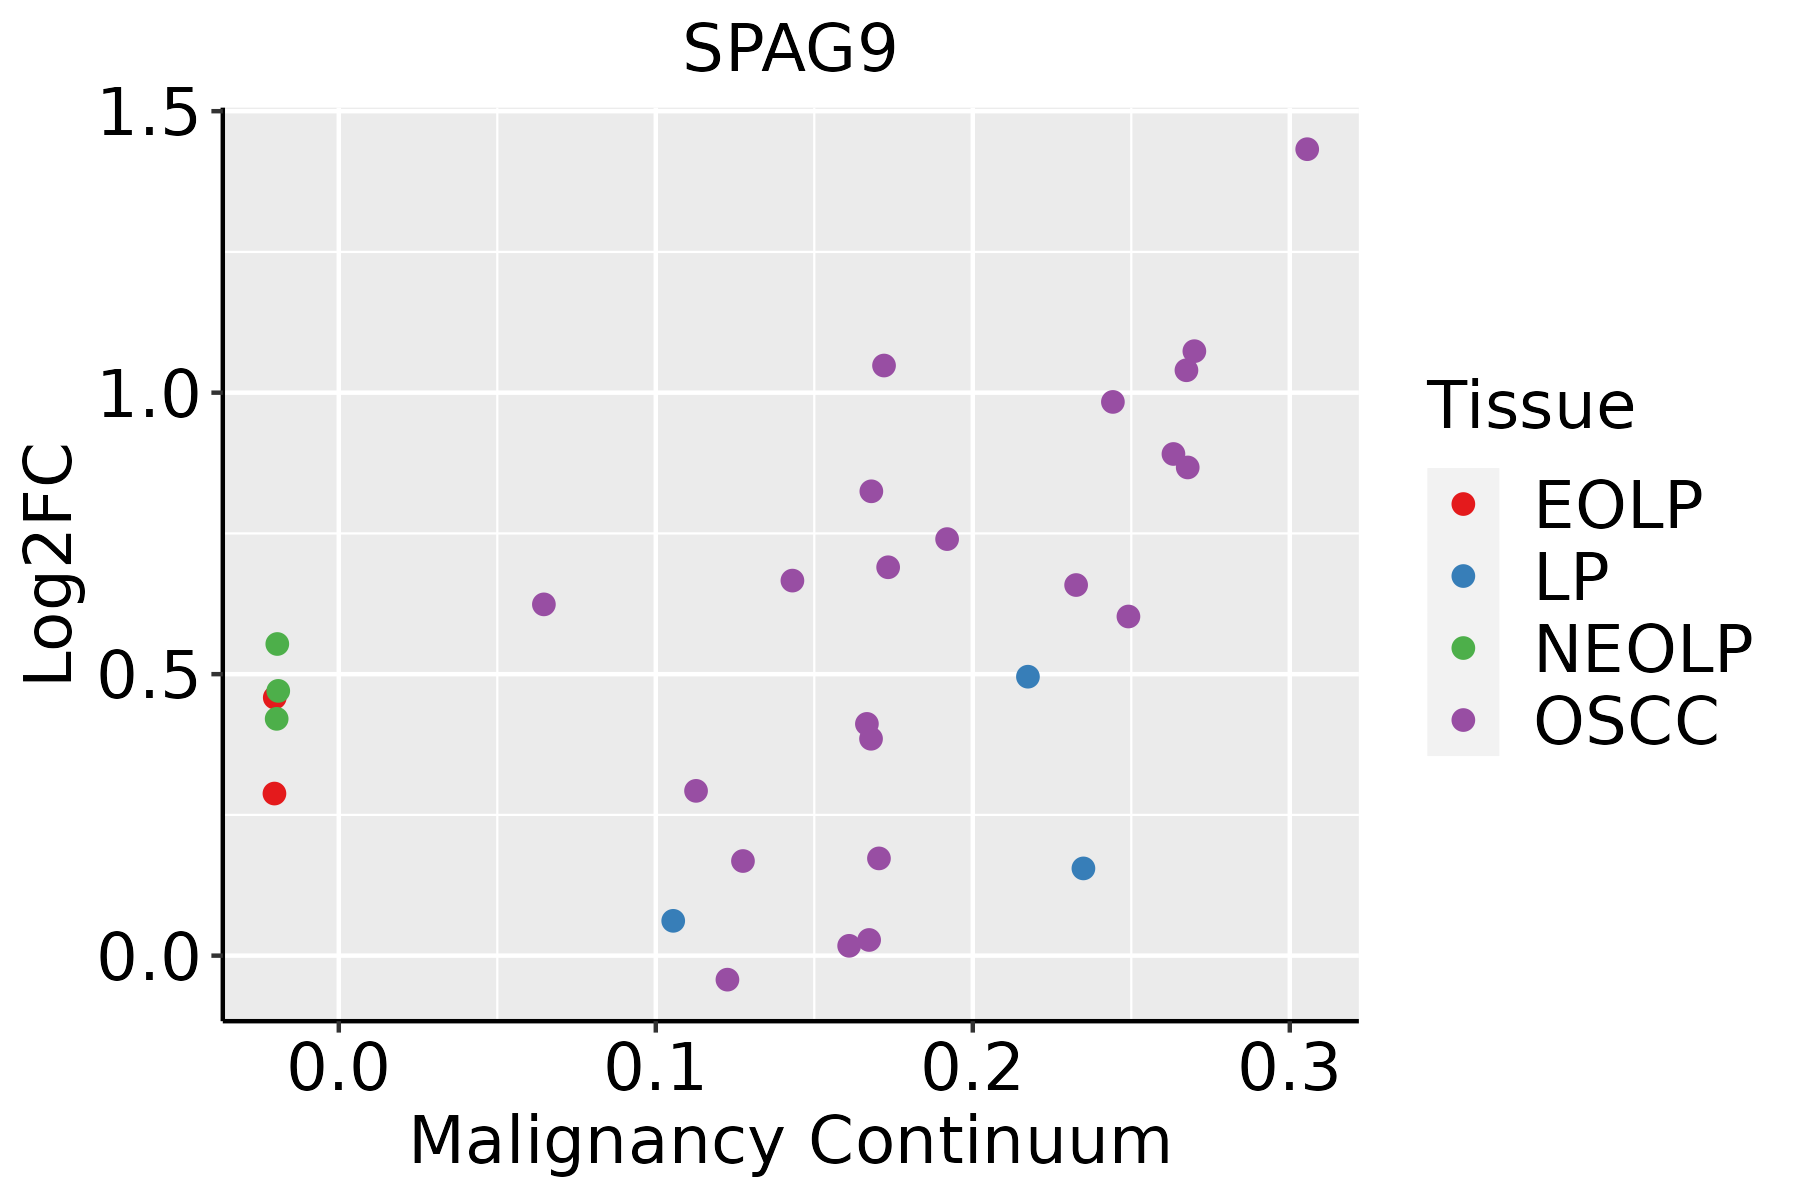
EOLP: Erosive Oral lichen planus
LP: leukoplakia
NEOLP: Non-erosive oral lichen planus
OSCC: Oral squamous cell carcinoma
ProstateThe image shows the transcriptomic changes along malignancy continuum.log2FC in expression of this searched gene in stem-like cells from each diseased tissue sample relative to stem-like cells in normal samples in each tissue plotted against the malignancy continuum. Samples are colored based on if they are from different disease stage.BPH: Benign Prostatic Hyperplasia
SkinThe image shows the transcriptomic changes along malignancy continuum.log2FC in expression of this searched gene in stem-like cells from each diseased tissue sample relative to stem-like cells in normal samples in each tissue plotted against the malignancy continuum. Samples are colored based on if they are from different disease stage.
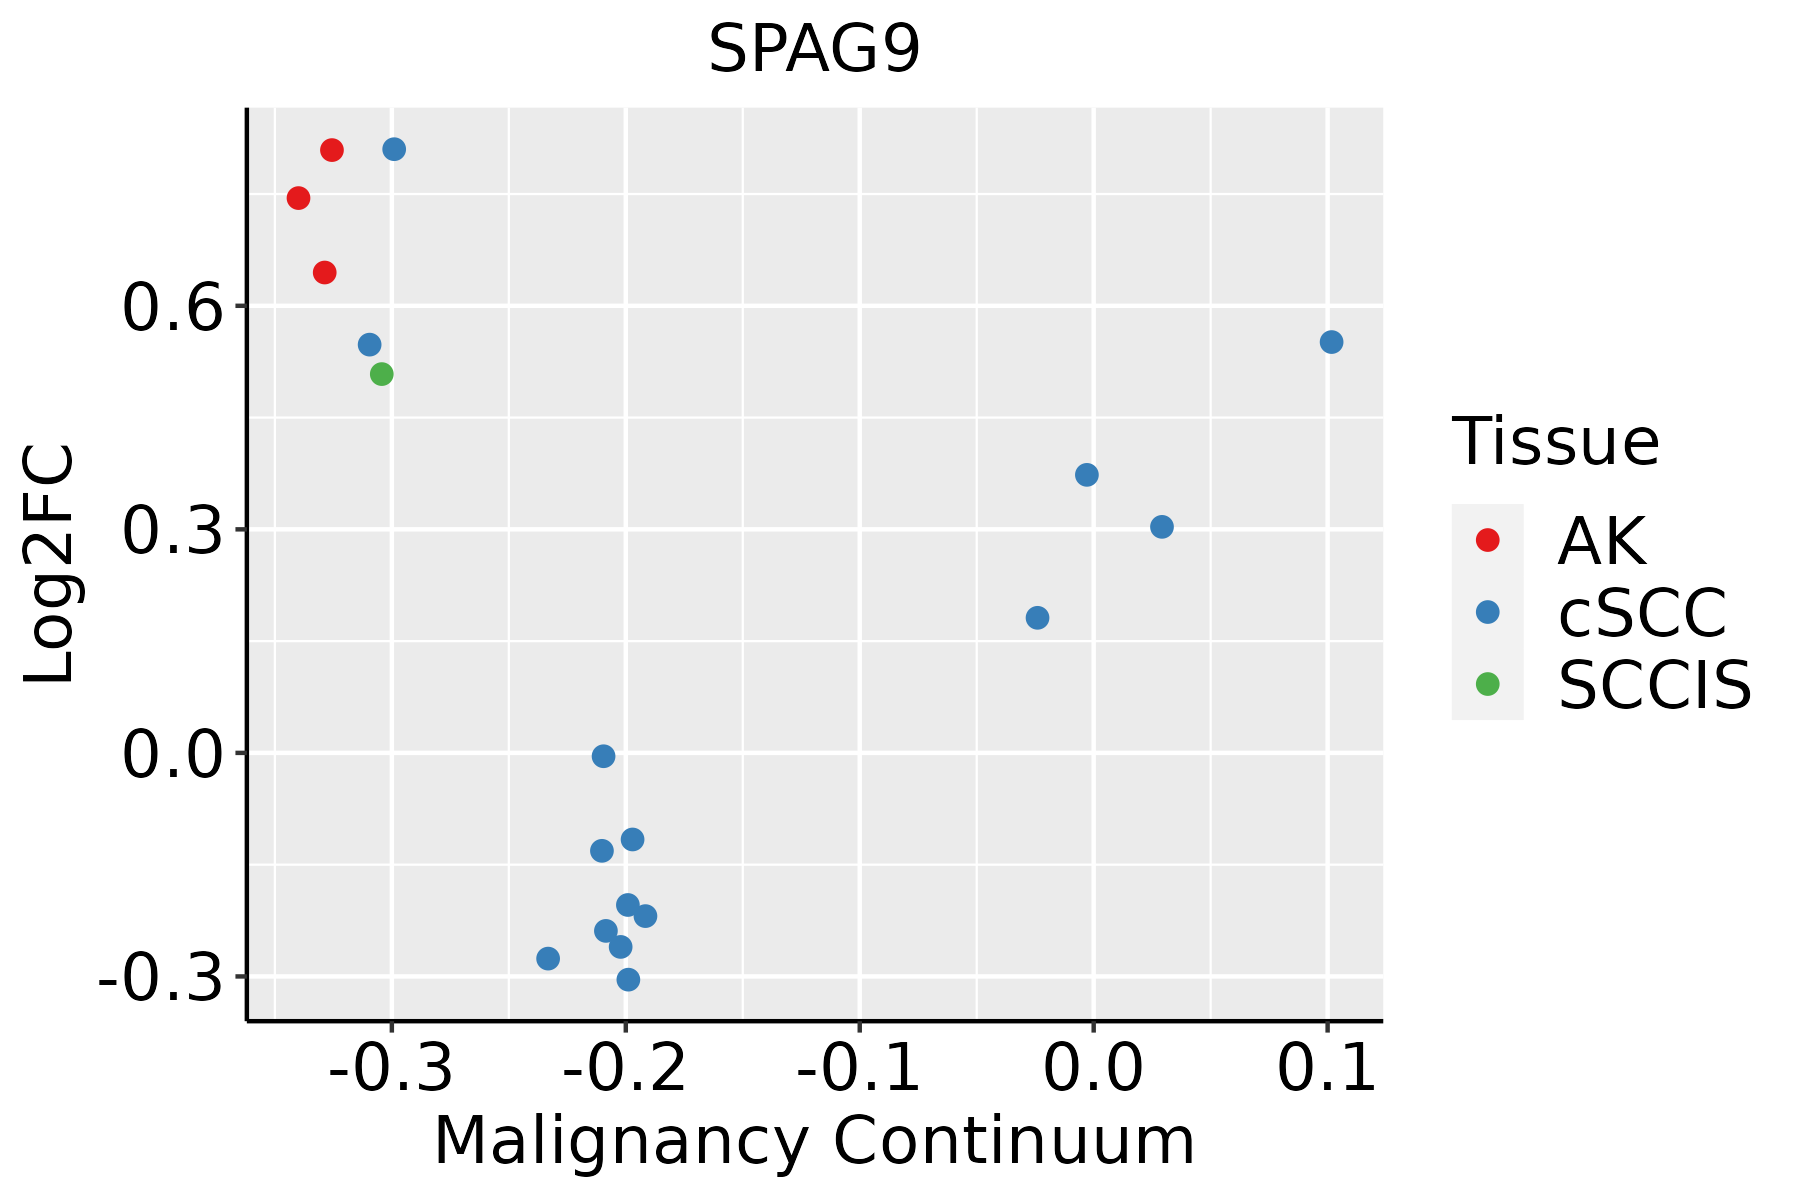
AK: Actinic keratosis
cSCC: Cutaneous squamous cell carcinoma
SCCIS:squamous cell carcinoma in situ
ThyroidThe image shows the transcriptomic changes along malignancy continuum.log2FC in expression of this searched gene in stem-like cells from each diseased tissue sample relative to stem-like cells in normal samples in each tissue plotted against the malignancy continuum. Samples are colored based on if they are from different disease stage.ATC: Anaplastic thyroid cancer
HT: Hashimoto's thyroiditis
PTC: Papillary thyroid cancer
∗log2FC in expression of this searched gene in stem-like cells from each diseased tissue sample relative to stem-like cells in normal samples in each tissue plotted against the malignancy continuum. Samples are colored based on if they are from different disease stage.

Top

Malignant transformation related pathway analysis

check buttonFind out the enriched GO biological processes and KEGG pathways involved in transition from healthy to precancer to cancer
check button Figure of enriched GO biological processes.
TissueDisease StageEnriched GO biological Processes
ColorectumADGO analysis - Figure of enriched GO biological processes: Top 15 enriched GO BP terms are showed in the bar plot of each disease state in each tissue. Each row represents a significant GO biological process which is colored according to the -log10(p.adjust).
ColorectumSERGO analysis - Figure of enriched GO biological processes: Top 15 enriched GO BP terms are showed in the bar plot of each disease state in each tissue. Each row represents a significant GO biological process which is colored according to the -log10(p.adjust).
ColorectumMSSGO analysis - Figure of enriched GO biological processes: Top 15 enriched GO BP terms are showed in the bar plot of each disease state in each tissue. Each row represents a significant GO biological process which is colored according to the -log10(p.adjust).
ColorectumMSI-HGO analysis - Figure of enriched GO biological processes: Top 15 enriched GO BP terms are showed in the bar plot of each disease state in each tissue. Each row represents a significant GO biological process which is colored according to the -log10(p.adjust).
ColorectumFAPGO analysis - Figure of enriched GO biological processes: Top 15 enriched GO BP terms are showed in the bar plot of each disease state in each tissue. Each row represents a significant GO biological process which is colored according to the -log10(p.adjust).
∗Top 15 enriched GO BP terms are showed in the bar plot of each disease state in each tissue. Each row represents a significant GO biological process which is colored according to the -log10(p.adjust).
Page: 1 2 3 4 5 6 7 8 9 

check button Enriched GO biological processes.
GO IDTissueDisease StageDescriptionGene RatioBg Ratiopvaluep.adjustCount
GO:002260410CervixCCregulation of cell morphogenesis84/2311309/187231.00e-124.29e-1084
GO:004593610CervixCCnegative regulation of phosphate metabolic process88/2311441/187232.92e-068.27e-0588
GO:001056310CervixCCnegative regulation of phosphorus metabolic process88/2311442/187233.21e-068.77e-0588
GO:004232610CervixCCnegative regulation of phosphorylation77/2311385/187231.09e-052.38e-0477
GO:00160498CervixCCcell growth92/2311482/187231.16e-052.49e-0492
GO:000193310CervixCCnegative regulation of protein phosphorylation69/2311342/187232.29e-054.01e-0469
GO:00434104CervixCCpositive regulation of MAPK cascade90/2311480/187232.92e-054.83e-0490
GO:00015588CervixCCregulation of cell growth77/2311414/187231.40e-041.70e-0377
GO:00161977CervixCCendosomal transport48/2311230/187231.65e-041.97e-0348
GO:00486386CervixCCregulation of developmental growth61/2311330/187237.69e-046.85e-0361
GO:00426924CervixCCmuscle cell differentiation69/2311384/187238.12e-047.09e-0369
GO:00605606CervixCCdevelopmental growth involved in morphogenesis46/2311234/187238.82e-047.63e-0346
GO:19901385CervixCCneuron projection extension34/2311172/187233.52e-032.27e-0234
GO:00164827CervixCCcytosolic transport33/2311168/187234.43e-032.70e-0233
GO:00511464CervixCCstriated muscle cell differentiation50/2311283/187235.53e-033.19e-0250
GO:00485886CervixCCdevelopmental cell growth42/2311234/187237.88e-034.15e-0242
GO:0045665CervixCCnegative regulation of neuron differentiation16/231169/187238.75e-034.48e-0216
GO:002260415EndometriumAEHregulation of cell morphogenesis79/2100309/187231.04e-122.24e-1079
GO:00160499EndometriumAEHcell growth93/2100482/187231.00e-074.99e-0693
GO:00605607EndometriumAEHdevelopmental growth involved in morphogenesis53/2100234/187234.02e-071.67e-0553
Page: 1 2 3 4 5 6 7 8 9 10 11 12 13 14 15 16 17 18 

check button Enriched KEGG pathways.
Pathway IDTissueDisease StageDescriptionGene RatioBg Ratiopvaluep.adjustqvalueCount
Page: 1 

Top

Cell-cell communication analysis

check buttonIdentification of potential cell-cell interactions between two cell types and their ligand-receptor pairs for different disease states
LigandReceptorLRpairPathwayTissueDisease Stage
Page: 1 

Top

Single-cell gene regulatory network inference analysis

check buttonFind out the significant the regulons (TFs) and the target genes of each regulon across cell types for different disease states
TFCell TypeTissueDisease StageTarget GeneRSSRegulon Activity
∗The dot plots of a searched regulon are shown for all cell subpopulations in each disease state of each tissue based on the regulon specific score inferred using pySCENIC and by calculating the average expression.
Page: 1 

Top

Somatic mutation of malignant transformation related genes

check buttonAnnotation of somatic variants for genes involved in malignant transformation
Hugo SymbolVariant ClassVariant ClassificationdbSNP RSHGVScHGVSpHGVSp ShortSWISSPROTBIOTYPESIFTPolyPhenTumor Sample BarcodeTissueHistologySexAgeStageTherapy TypesDrugsOutcome
SPAG9SNVMissense_Mutationc.2055N>Ap.Met685Ilep.M685IO60271protein_codingdeleterious(0)possibly_damaging(0.829)TCGA-AC-A23H-01Breastbreast invasive carcinomaFemale>=65I/IIUnknownUnknownPD
SPAG9SNVMissense_Mutationc.1695N>Gp.Asn565Lysp.N565KO60271protein_codingtolerated(0.26)benign(0.003)TCGA-AC-A23H-01Breastbreast invasive carcinomaFemale>=65I/IIUnknownUnknownPD
SPAG9SNVMissense_Mutationnovelc.1054N>Ap.Asp352Asnp.D352NO60271protein_codingdeleterious(0)benign(0.153)TCGA-BH-A18U-01Breastbreast invasive carcinomaFemale>=65III/IVUnknownUnknownSD
SPAG9SNVMissense_Mutationc.1414N>Cp.Glu472Glnp.E472QO60271protein_codingtolerated(0.11)probably_damaging(0.986)TCGA-BH-A209-01Breastbreast invasive carcinomaFemale>=65I/IIUnknownUnknownSD
SPAG9SNVMissense_Mutationc.1126N>Cp.Asp376Hisp.D376HO60271protein_codingdeleterious(0.04)benign(0.365)TCGA-D8-A147-01Breastbreast invasive carcinomaFemale<65I/IIChemotherapydoxorubicineSD
SPAG9SNVMissense_Mutationnovelc.2686N>Ap.Glu896Lysp.E896KO60271protein_codingdeleterious(0.03)benign(0.157)TCGA-E2-A1B1-01Breastbreast invasive carcinomaFemale<65I/IIOther, specify in notesbiphosphonatezoledronicSD
SPAG9SNVMissense_Mutationrs764197165c.2489N>Gp.Asn830Serp.N830SO60271protein_codingtolerated(0.77)benign(0.001)TCGA-E2-A1IH-01Breastbreast invasive carcinomaFemale>=65I/IIHormone TherapyaromasinSD
SPAG9SNVMissense_Mutationc.459N>Cp.Lys153Asnp.K153NO60271protein_codingdeleterious(0)possibly_damaging(0.816)TCGA-GM-A2D9-01Breastbreast invasive carcinomaFemale>=65I/IIHormone TherapyarimidexSD
SPAG9SNVMissense_Mutationc.202G>Ap.Asp68Asnp.D68NO60271protein_codingtolerated(1)benign(0)TCGA-GM-A2DH-01Breastbreast invasive carcinomaFemale<65I/IIChemotherapytaxolCR
SPAG9SNVMissense_Mutationnovelc.127G>Ap.Asp43Asnp.D43NO60271protein_codingdeleterious(0.01)probably_damaging(0.99)TCGA-LL-A5YP-01Breastbreast invasive carcinomaFemale<65I/IIChemotherapycytoxanSD
Page: 1 2 3 4 5 6 7 8 9 10 11 12 

Top

Related drugs of malignant transformation related genes

check buttonIdentification of chemicals and drugs interact with genes involved in malignant transfromation
(DGIdb 4.0)
Entrez IDSymbolCategoryInteraction TypesDrug Claim NameDrug NamePMIDs
Page: 1