
|
|||||
|
 | |
| |
| |
| |
| |
| |
|
Gene: SPAG7 |
Gene summary for SPAG7 |
| Gene information | Species | Human | Gene symbol | SPAG7 | Gene ID | 9552 |
| Gene name | sperm associated antigen 7 | |
| Gene Alias | ACRP | |
| Cytomap | 17p13.2 | |
| Gene Type | protein-coding | GO ID | GO:0005575 | UniProtAcc | O75391 |
Top |
Malignant transformation analysis |
| Identification of the aberrant gene expression in precancerous and cancerous lesions by comparing the gene expression of stem-like cells in diseased tissues with normal stem cells |
| Entrez ID | Symbol | Replicates | Species | Organ | Tissue | Adj P-value | Log2FC | Malignancy |
| 9552 | SPAG7 | HTA11_3410_2000001011 | Human | Colorectum | AD | 2.45e-04 | 9.13e-02 | 0.0155 |
| 9552 | SPAG7 | HTA11_2487_2000001011 | Human | Colorectum | SER | 7.61e-08 | 3.63e-01 | -0.1808 |
| 9552 | SPAG7 | HTA11_2951_2000001011 | Human | Colorectum | AD | 4.37e-02 | 3.73e-01 | 0.0216 |
| 9552 | SPAG7 | HTA11_1938_2000001011 | Human | Colorectum | AD | 1.33e-04 | 3.19e-01 | -0.0811 |
| 9552 | SPAG7 | HTA11_347_2000001011 | Human | Colorectum | AD | 1.59e-10 | 3.30e-01 | -0.1954 |
| 9552 | SPAG7 | HTA11_411_2000001011 | Human | Colorectum | SER | 3.80e-08 | 6.26e-01 | -0.2602 |
| 9552 | SPAG7 | HTA11_3361_2000001011 | Human | Colorectum | AD | 8.45e-07 | 4.00e-01 | -0.1207 |
| 9552 | SPAG7 | HTA11_83_2000001011 | Human | Colorectum | SER | 3.24e-04 | 3.73e-01 | -0.1526 |
| 9552 | SPAG7 | HTA11_696_2000001011 | Human | Colorectum | AD | 2.60e-14 | 4.25e-01 | -0.1464 |
| 9552 | SPAG7 | HTA11_866_2000001011 | Human | Colorectum | AD | 6.23e-09 | 3.30e-01 | -0.1001 |
| 9552 | SPAG7 | HTA11_1391_2000001011 | Human | Colorectum | AD | 7.41e-18 | 5.42e-01 | -0.059 |
| 9552 | SPAG7 | HTA11_2992_2000001011 | Human | Colorectum | SER | 5.76e-05 | 4.73e-01 | -0.1706 |
| 9552 | SPAG7 | HTA11_5212_2000001011 | Human | Colorectum | AD | 3.74e-04 | 4.22e-01 | -0.2061 |
| 9552 | SPAG7 | HTA11_546_2000001011 | Human | Colorectum | AD | 1.88e-04 | 3.23e-01 | -0.0842 |
| 9552 | SPAG7 | HTA11_7862_2000001011 | Human | Colorectum | AD | 7.34e-05 | 4.05e-01 | -0.0179 |
| 9552 | SPAG7 | HTA11_866_3004761011 | Human | Colorectum | AD | 1.99e-14 | 4.49e-01 | 0.096 |
| 9552 | SPAG7 | HTA11_8622_2000001021 | Human | Colorectum | SER | 7.47e-07 | 3.29e-01 | 0.0528 |
| 9552 | SPAG7 | HTA11_7663_2000001011 | Human | Colorectum | SER | 1.83e-02 | 3.61e-01 | 0.0131 |
| 9552 | SPAG7 | HTA11_10623_2000001011 | Human | Colorectum | AD | 9.35e-08 | 4.55e-01 | -0.0177 |
| 9552 | SPAG7 | HTA11_10711_2000001011 | Human | Colorectum | AD | 2.56e-04 | 2.95e-01 | 0.0338 |
| Page: 1 2 3 4 5 6 7 8 |
| Tissue | Expression Dynamics | Abbreviation |
| Colorectum (GSE201348) |  | FAP: Familial adenomatous polyposis |
| CRC: Colorectal cancer | ||
| Colorectum (HTA11) |  | AD: Adenomas |
| SER: Sessile serrated lesions | ||
| MSI-H: Microsatellite-high colorectal cancer | ||
| MSS: Microsatellite stable colorectal cancer | ||
| Esophagus |  | ESCC: Esophageal squamous cell carcinoma |
| HGIN: High-grade intraepithelial neoplasias | ||
| LGIN: Low-grade intraepithelial neoplasias | ||
| Liver | 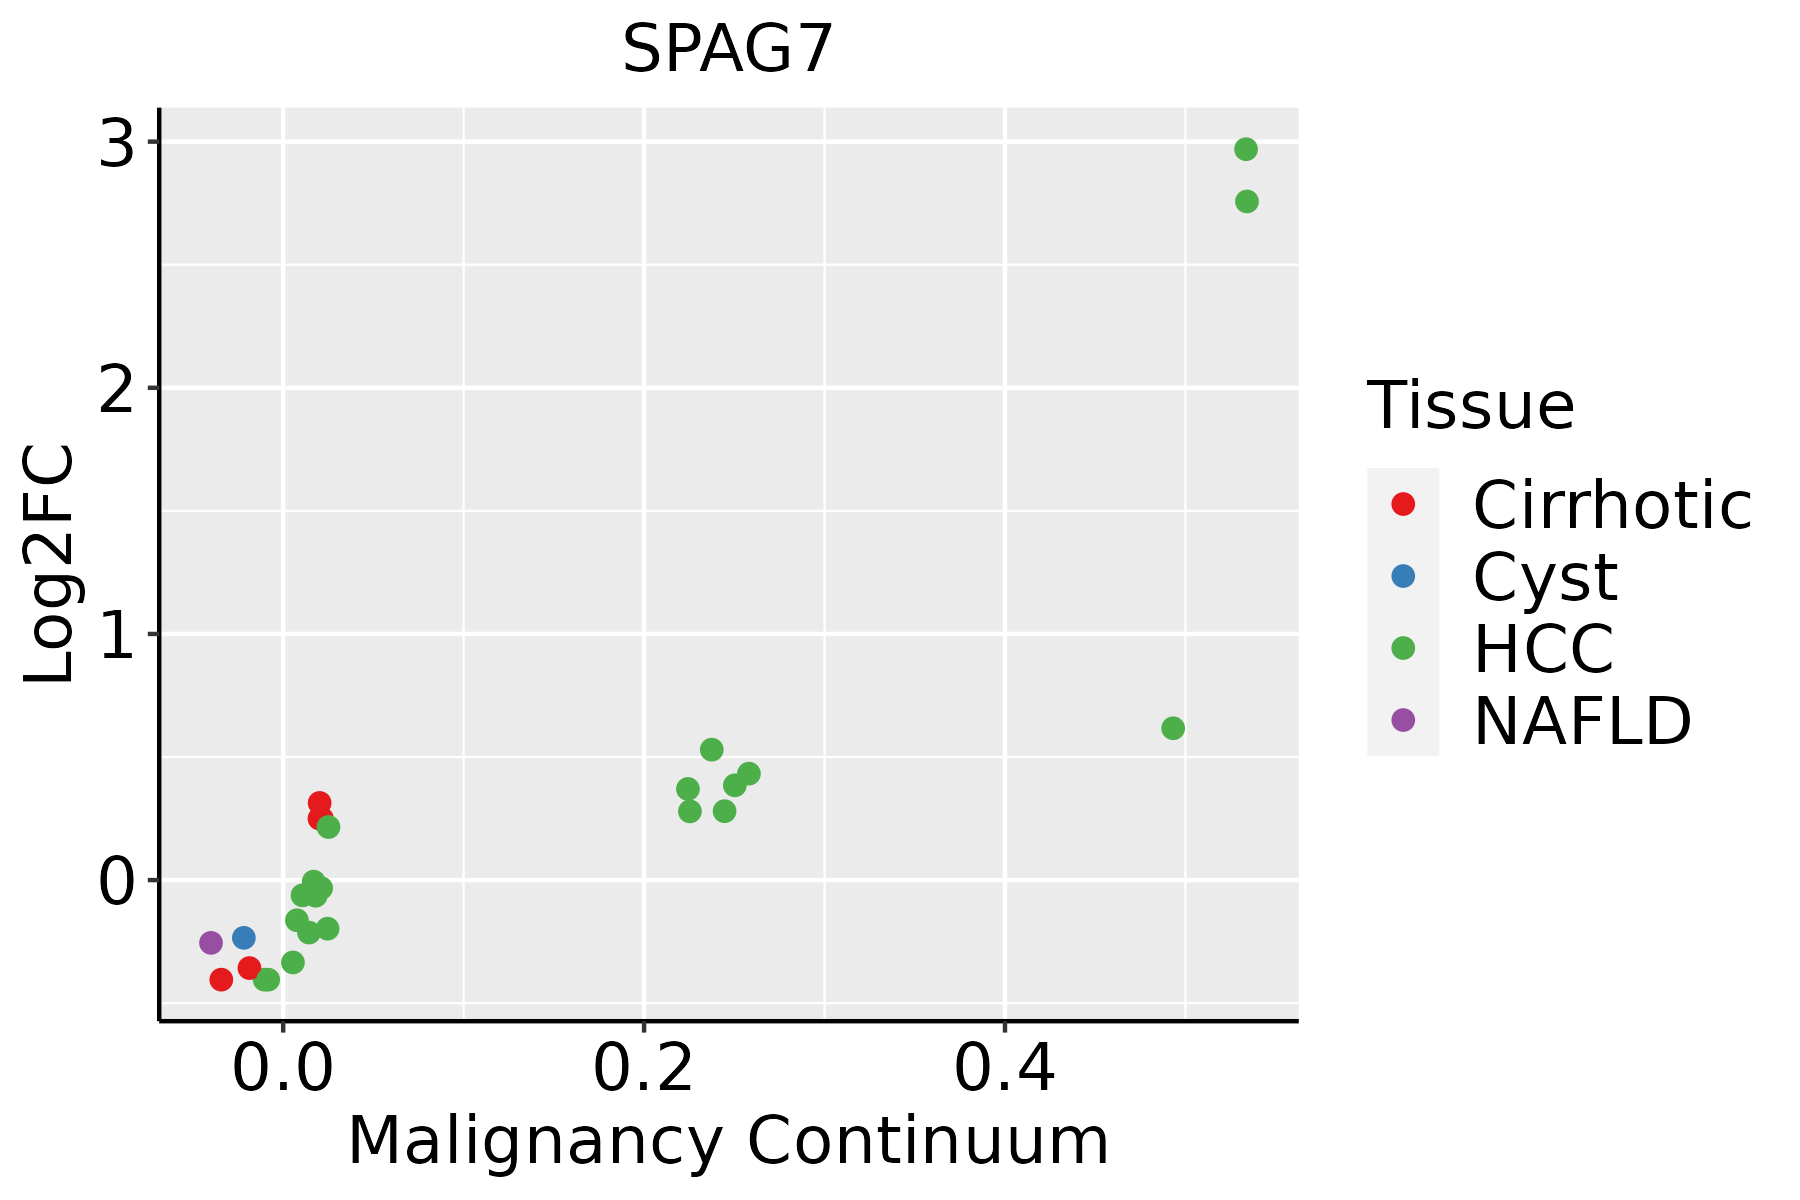 | HCC: Hepatocellular carcinoma |
| NAFLD: Non-alcoholic fatty liver disease | ||
| Oral Cavity | 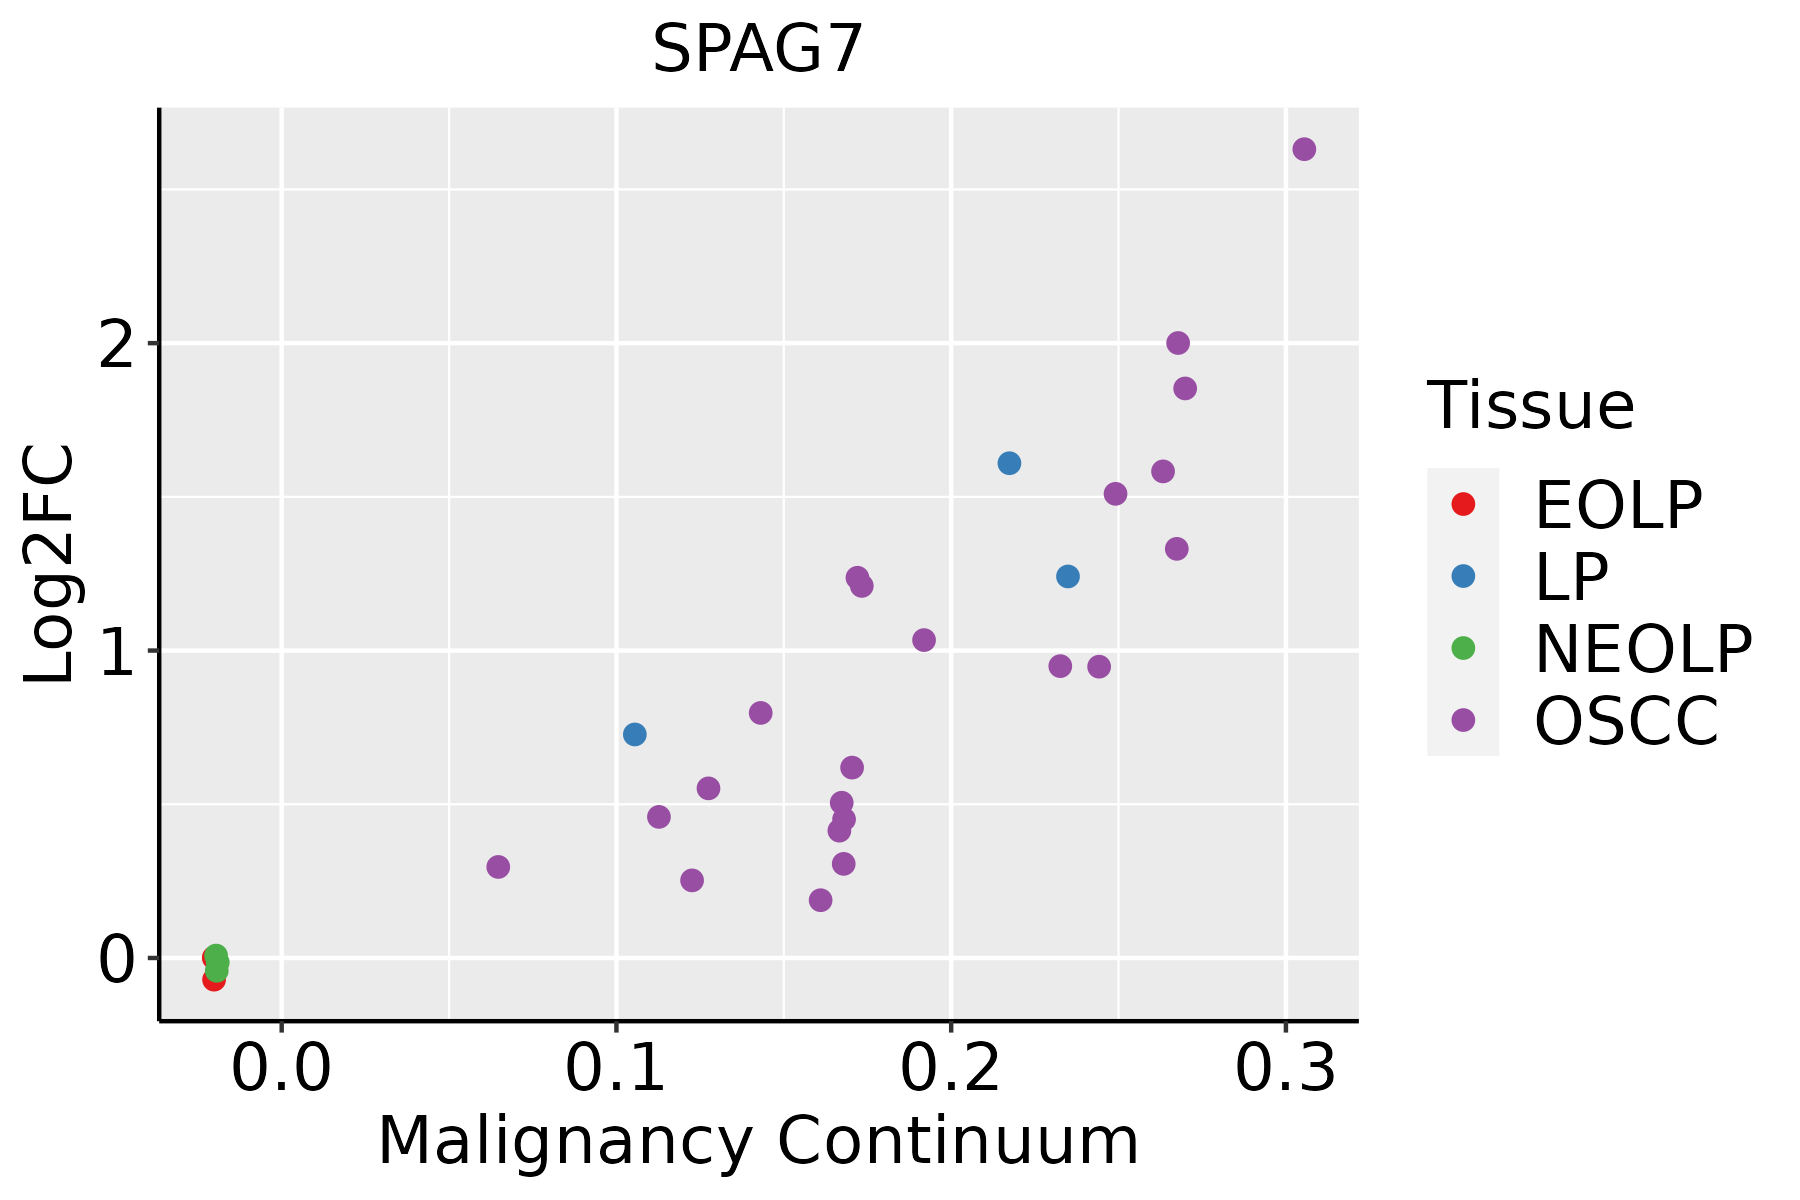 | EOLP: Erosive Oral lichen planus |
| LP: leukoplakia | ||
| NEOLP: Non-erosive oral lichen planus | ||
| OSCC: Oral squamous cell carcinoma | ||
| Skin | 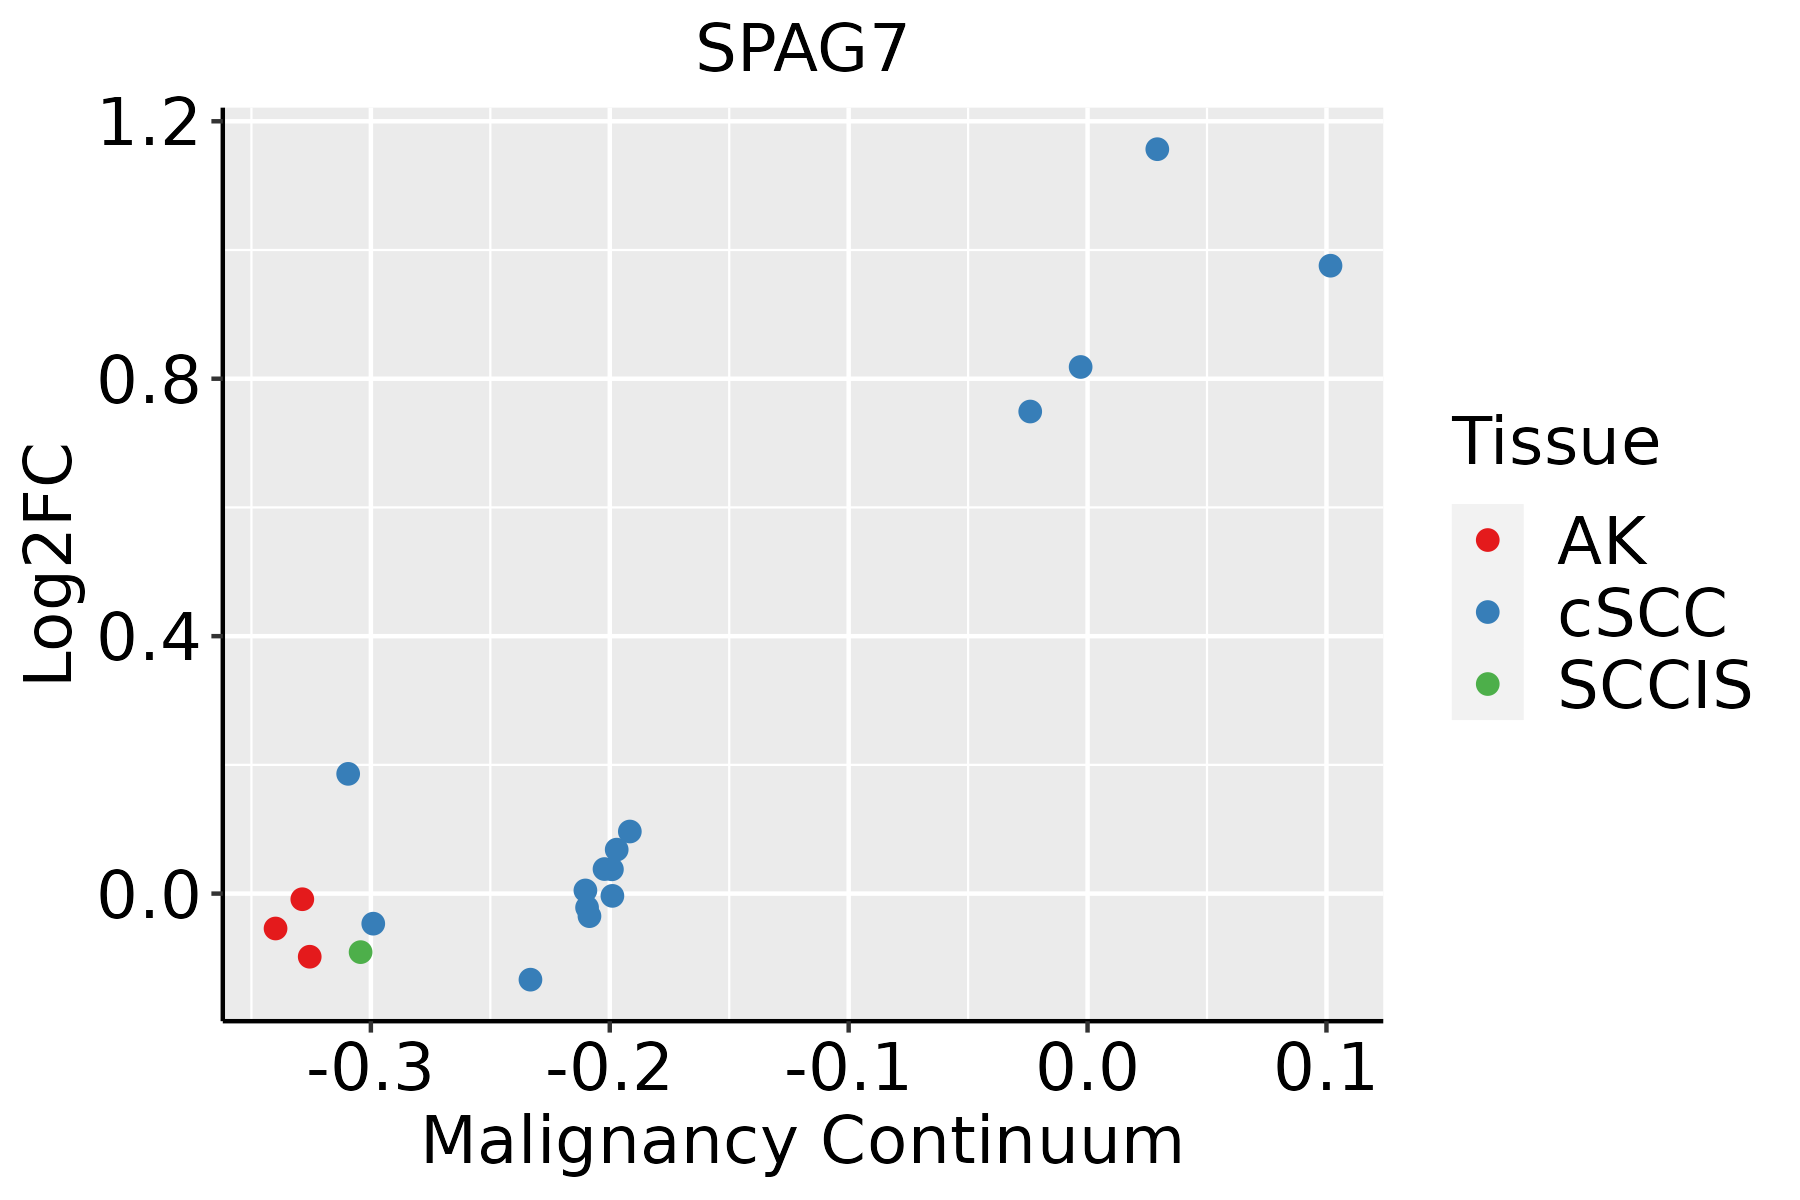 | AK: Actinic keratosis |
| cSCC: Cutaneous squamous cell carcinoma | ||
| SCCIS:squamous cell carcinoma in situ | ||
| Thyroid |  | ATC: Anaplastic thyroid cancer |
| HT: Hashimoto's thyroiditis | ||
| PTC: Papillary thyroid cancer |
| ∗log2FC in expression of this searched gene in stem-like cells from each diseased tissue sample relative to stem-like cells in normal samples in each tissue plotted against the malignancy continuum. Samples are colored based on if they are from different disease stage. |
Top |
Malignant transformation related pathway analysis |
| Find out the enriched GO biological processes and KEGG pathways involved in transition from healthy to precancer to cancer |
| Tissue | Disease Stage | Enriched GO biological Processes |
| Colorectum | AD |  |
| Colorectum | SER |  |
| Colorectum | MSS |  |
| Colorectum | MSI-H |  |
| Colorectum | FAP |  |
| ∗Top 15 enriched GO BP terms are showed in the bar plot of each disease state in each tissue. Each row represents a significant GO biological process which is colored according to the -log10(p.adjust). |
| Page: 1 2 3 4 5 6 7 8 9 |
| GO ID | Tissue | Disease Stage | Description | Gene Ratio | Bg Ratio | pvalue | p.adjust | Count |
| Page: 1 |
| Pathway ID | Tissue | Disease Stage | Description | Gene Ratio | Bg Ratio | pvalue | p.adjust | qvalue | Count |
| Page: 1 |
Top |
Cell-cell communication analysis |
| Identification of potential cell-cell interactions between two cell types and their ligand-receptor pairs for different disease states |
| Ligand | Receptor | LRpair | Pathway | Tissue | Disease Stage |
| Page: 1 |
Top |
Single-cell gene regulatory network inference analysis |
| Find out the significant the regulons (TFs) and the target genes of each regulon across cell types for different disease states |
| TF | Cell Type | Tissue | Disease Stage | Target Gene | RSS | Regulon Activity |
| ∗The dot plots of a searched regulon are shown for all cell subpopulations in each disease state of each tissue based on the regulon specific score inferred using pySCENIC and by calculating the average expression. |
| Page: 1 |
Top |
Somatic mutation of malignant transformation related genes |
| Annotation of somatic variants for genes involved in malignant transformation |
| Hugo Symbol | Variant Class | Variant Classification | dbSNP RS | HGVSc | HGVSp | HGVSp Short | SWISSPROT | BIOTYPE | SIFT | PolyPhen | Tumor Sample Barcode | Tissue | Histology | Sex | Age | Stage | Therapy Types | Drugs | Outcome |
| SPAG7 | SNV | Missense_Mutation | c.664N>A | p.Glu222Lys | p.E222K | O75391 | protein_coding | tolerated(0.33) | benign(0.099) | TCGA-AC-A23H-01 | Breast | breast invasive carcinoma | Female | >=65 | I/II | Unknown | Unknown | PD | |
| SPAG7 | SNV | Missense_Mutation | novel | c.231G>C | p.Glu77Asp | p.E77D | O75391 | protein_coding | tolerated(0.17) | benign(0.233) | TCGA-JW-A5VL-01 | Cervix | cervical & endocervical cancer | Female | <65 | I/II | Unknown | Unknown | SD |
| SPAG7 | SNV | Missense_Mutation | c.429G>C | p.Gln143His | p.Q143H | O75391 | protein_coding | tolerated(0.1) | benign(0.254) | TCGA-JX-A3Q0-01 | Cervix | cervical & endocervical cancer | Female | <65 | III/IV | Unknown | Unknown | SD | |
| SPAG7 | SNV | Missense_Mutation | c.145N>T | p.Arg49Cys | p.R49C | O75391 | protein_coding | deleterious(0) | possibly_damaging(0.877) | TCGA-EI-6917-01 | Colorectum | rectum adenocarcinoma | Male | <65 | III/IV | Chemotherapy | 5fluorouracil+oxaciplatina+l-folinian | SD | |
| SPAG7 | SNV | Missense_Mutation | c.145N>T | p.Arg49Cys | p.R49C | O75391 | protein_coding | deleterious(0) | possibly_damaging(0.877) | TCGA-AP-A059-01 | Endometrium | uterine corpus endometrioid carcinoma | Female | >=65 | I/II | Unknown | Unknown | SD | |
| SPAG7 | SNV | Missense_Mutation | rs377700806 | c.649N>T | p.Arg217Trp | p.R217W | O75391 | protein_coding | deleterious(0) | possibly_damaging(0.73) | TCGA-AX-A1C9-01 | Endometrium | uterine corpus endometrioid carcinoma | Female | >=65 | I/II | Unknown | Unknown | SD |
| SPAG7 | SNV | Missense_Mutation | novel | c.260N>C | p.Val87Ala | p.V87A | O75391 | protein_coding | deleterious(0.04) | benign(0.223) | TCGA-BK-A56F-01 | Endometrium | uterine corpus endometrioid carcinoma | Female | >=65 | I/II | Unknown | Unknown | SD |
| SPAG7 | SNV | Missense_Mutation | c.172G>A | p.Asp58Asn | p.D58N | O75391 | protein_coding | tolerated(0.38) | benign(0.005) | TCGA-BS-A0UV-01 | Endometrium | uterine corpus endometrioid carcinoma | Female | <65 | III/IV | Unknown | Unknown | SD | |
| SPAG7 | SNV | Missense_Mutation | c.134N>G | p.Lys45Arg | p.K45R | O75391 | protein_coding | tolerated(0.78) | benign(0.092) | TCGA-CC-5261-01 | Liver | liver hepatocellular carcinoma | Male | <65 | I/II | Unknown | Unknown | SD | |
| SPAG7 | SNV | Missense_Mutation | c.134N>G | p.Lys45Arg | p.K45R | O75391 | protein_coding | tolerated(0.78) | benign(0.092) | TCGA-DD-A11A-01 | Liver | liver hepatocellular carcinoma | Male | >=65 | I/II | Unknown | Unknown | SD |
| Page: 1 2 |
Top |
Related drugs of malignant transformation related genes |
| Identification of chemicals and drugs interact with genes involved in malignant transfromation |
| (DGIdb 4.0) |
| Entrez ID | Symbol | Category | Interaction Types | Drug Claim Name | Drug Name | PMIDs |
| Page: 1 |

Copyright 2023-Present -The University of Texas Health Science Center at Houston |