
|
|||||
|
 | |
| |
| |
| |
| |
| |
|
Gene: SPAG5 |
Gene summary for SPAG5 |
| Gene information | Species | Human | Gene symbol | SPAG5 | Gene ID | 10615 |
| Gene name | sperm associated antigen 5 | |
| Gene Alias | DEEPEST | |
| Cytomap | 17q11.2 | |
| Gene Type | protein-coding | GO ID | GO:0000070 | UniProtAcc | Q96R06 |
Top |
Malignant transformation analysis |
| Identification of the aberrant gene expression in precancerous and cancerous lesions by comparing the gene expression of stem-like cells in diseased tissues with normal stem cells |
| Entrez ID | Symbol | Replicates | Species | Organ | Tissue | Adj P-value | Log2FC | Malignancy |
| 10615 | SPAG5 | LZE7T | Human | Esophagus | ESCC | 1.02e-03 | 1.89e-01 | 0.0667 |
| 10615 | SPAG5 | P2T-E | Human | Esophagus | ESCC | 2.02e-06 | 1.81e-01 | 0.1177 |
| 10615 | SPAG5 | P4T-E | Human | Esophagus | ESCC | 2.20e-02 | 1.02e-01 | 0.1323 |
| 10615 | SPAG5 | P5T-E | Human | Esophagus | ESCC | 1.78e-03 | 1.24e-01 | 0.1327 |
| 10615 | SPAG5 | P9T-E | Human | Esophagus | ESCC | 1.45e-04 | 1.49e-01 | 0.1131 |
| 10615 | SPAG5 | P10T-E | Human | Esophagus | ESCC | 2.06e-08 | 2.11e-01 | 0.116 |
| 10615 | SPAG5 | P15T-E | Human | Esophagus | ESCC | 3.26e-02 | 1.11e-01 | 0.1149 |
| 10615 | SPAG5 | P17T-E | Human | Esophagus | ESCC | 1.49e-05 | 3.08e-01 | 0.1278 |
| 10615 | SPAG5 | P21T-E | Human | Esophagus | ESCC | 1.36e-04 | 2.36e-01 | 0.1617 |
| 10615 | SPAG5 | P24T-E | Human | Esophagus | ESCC | 4.17e-05 | 1.89e-01 | 0.1287 |
| 10615 | SPAG5 | P28T-E | Human | Esophagus | ESCC | 2.50e-03 | 1.41e-01 | 0.1149 |
| 10615 | SPAG5 | P31T-E | Human | Esophagus | ESCC | 2.35e-02 | 1.40e-01 | 0.1251 |
| 10615 | SPAG5 | P32T-E | Human | Esophagus | ESCC | 2.03e-09 | 2.55e-01 | 0.1666 |
| 10615 | SPAG5 | P36T-E | Human | Esophagus | ESCC | 7.72e-03 | 1.72e-01 | 0.1187 |
| 10615 | SPAG5 | P37T-E | Human | Esophagus | ESCC | 5.37e-05 | 2.02e-01 | 0.1371 |
| 10615 | SPAG5 | P42T-E | Human | Esophagus | ESCC | 9.46e-03 | 1.54e-01 | 0.1175 |
| 10615 | SPAG5 | P49T-E | Human | Esophagus | ESCC | 7.48e-03 | 4.57e-01 | 0.1768 |
| 10615 | SPAG5 | P52T-E | Human | Esophagus | ESCC | 1.30e-15 | 3.04e-01 | 0.1555 |
| 10615 | SPAG5 | P54T-E | Human | Esophagus | ESCC | 2.07e-06 | 2.04e-01 | 0.0975 |
| 10615 | SPAG5 | P62T-E | Human | Esophagus | ESCC | 1.21e-03 | 1.54e-01 | 0.1302 |
| Page: 1 2 |
| Tissue | Expression Dynamics | Abbreviation |
| Esophagus | 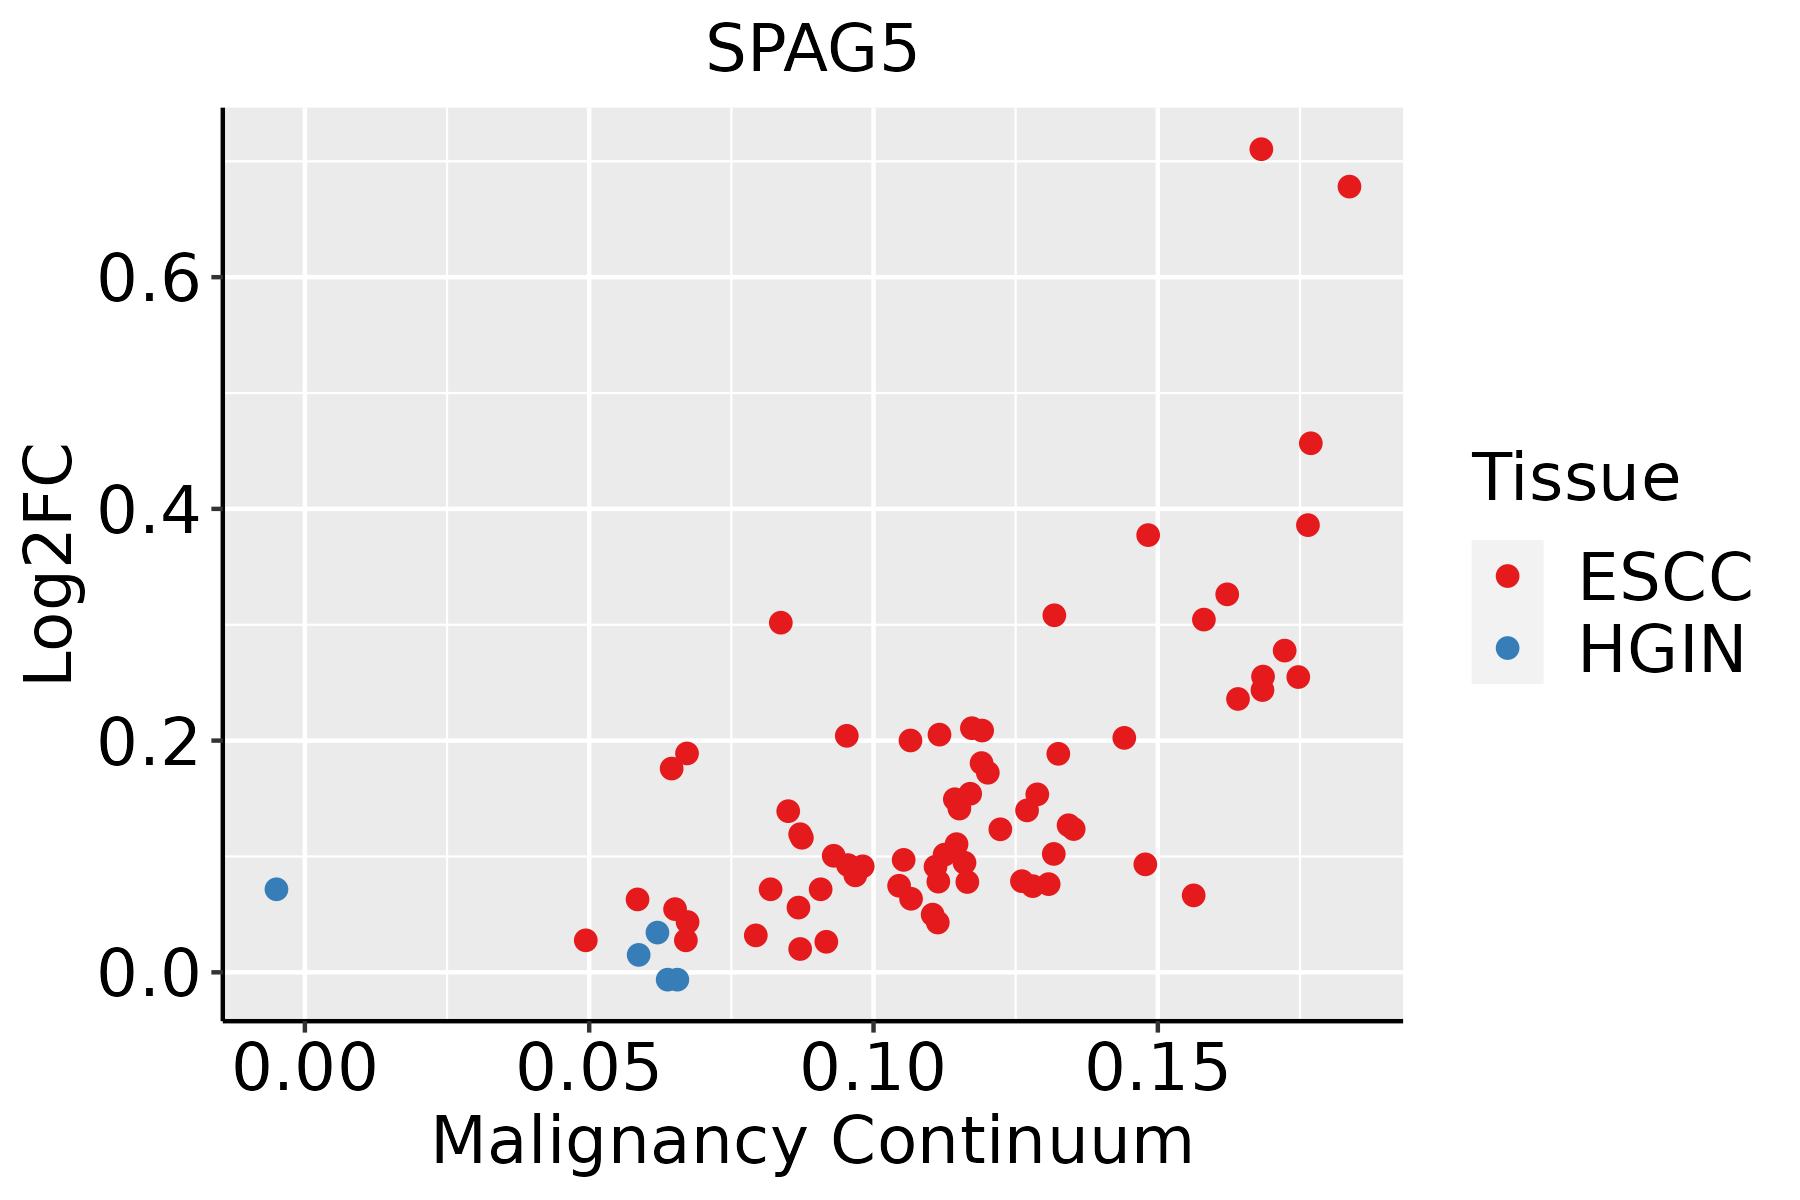 | ESCC: Esophageal squamous cell carcinoma |
| HGIN: High-grade intraepithelial neoplasias | ||
| LGIN: Low-grade intraepithelial neoplasias |
| ∗log2FC in expression of this searched gene in stem-like cells from each diseased tissue sample relative to stem-like cells in normal samples in each tissue plotted against the malignancy continuum. Samples are colored based on if they are from different disease stage. |
Top |
Malignant transformation related pathway analysis |
| Find out the enriched GO biological processes and KEGG pathways involved in transition from healthy to precancer to cancer |
| Tissue | Disease Stage | Enriched GO biological Processes |
| Colorectum | AD |  |
| Colorectum | SER |  |
| Colorectum | MSS |  |
| Colorectum | MSI-H |  |
| Colorectum | FAP |  |
| ∗Top 15 enriched GO BP terms are showed in the bar plot of each disease state in each tissue. Each row represents a significant GO biological process which is colored according to the -log10(p.adjust). |
| Page: 1 2 3 4 5 6 7 8 9 |
| GO ID | Tissue | Disease Stage | Description | Gene Ratio | Bg Ratio | pvalue | p.adjust | Count |
| GO:014001414 | Esophagus | ESCC | mitotic nuclear division | 218/8552 | 287/18723 | 6.17e-26 | 1.78e-23 | 218 |
| GO:003238618 | Esophagus | ESCC | regulation of intracellular transport | 243/8552 | 337/18723 | 3.20e-23 | 7.25e-21 | 243 |
| GO:005165617 | Esophagus | ESCC | establishment of organelle localization | 273/8552 | 390/18723 | 9.13e-23 | 1.81e-20 | 273 |
| GO:000007011 | Esophagus | ESCC | mitotic sister chromatid segregation | 138/8552 | 168/18723 | 1.37e-22 | 2.63e-20 | 138 |
| GO:00008194 | Esophagus | ESCC | sister chromatid segregation | 157/8552 | 202/18723 | 8.41e-21 | 1.33e-18 | 157 |
| GO:000705911 | Esophagus | ESCC | chromosome segregation | 238/8552 | 346/18723 | 1.72e-18 | 1.82e-16 | 238 |
| GO:0032388110 | Esophagus | ESCC | positive regulation of intracellular transport | 152/8552 | 202/18723 | 7.89e-18 | 7.36e-16 | 152 |
| GO:000705114 | Esophagus | ESCC | spindle organization | 134/8552 | 184/18723 | 5.70e-14 | 2.87e-12 | 134 |
| GO:005131011 | Esophagus | ESCC | metaphase plate congression | 58/8552 | 65/18723 | 1.81e-13 | 8.63e-12 | 58 |
| GO:00482853 | Esophagus | ESCC | organelle fission | 301/8552 | 488/18723 | 4.64e-13 | 2.12e-11 | 301 |
| GO:00988133 | Esophagus | ESCC | nuclear chromosome segregation | 187/8552 | 281/18723 | 1.00e-12 | 4.36e-11 | 187 |
| GO:005130311 | Esophagus | ESCC | establishment of chromosome localization | 67/8552 | 80/18723 | 1.92e-12 | 8.09e-11 | 67 |
| GO:005000011 | Esophagus | ESCC | chromosome localization | 68/8552 | 82/18723 | 3.37e-12 | 1.32e-10 | 68 |
| GO:00002802 | Esophagus | ESCC | nuclear division | 270/8552 | 439/18723 | 1.17e-11 | 4.24e-10 | 270 |
| GO:004578710 | Esophagus | ESCC | positive regulation of cell cycle | 196/8552 | 313/18723 | 9.27e-10 | 2.24e-08 | 196 |
| GO:000716320 | Esophagus | ESCC | establishment or maintenance of cell polarity | 143/8552 | 218/18723 | 2.05e-09 | 4.65e-08 | 143 |
| GO:00512256 | Esophagus | ESCC | spindle assembly | 85/8552 | 117/18723 | 2.72e-09 | 5.98e-08 | 85 |
| GO:005149520 | Esophagus | ESCC | positive regulation of cytoskeleton organization | 147/8552 | 226/18723 | 2.93e-09 | 6.38e-08 | 147 |
| GO:00705078 | Esophagus | ESCC | regulation of microtubule cytoskeleton organization | 99/8552 | 148/18723 | 1.43e-07 | 2.29e-06 | 99 |
| GO:003001018 | Esophagus | ESCC | establishment of cell polarity | 96/8552 | 143/18723 | 1.69e-07 | 2.67e-06 | 96 |
| Page: 1 2 |
| Pathway ID | Tissue | Disease Stage | Description | Gene Ratio | Bg Ratio | pvalue | p.adjust | qvalue | Count |
| Page: 1 |
Top |
Cell-cell communication analysis |
| Identification of potential cell-cell interactions between two cell types and their ligand-receptor pairs for different disease states |
| Ligand | Receptor | LRpair | Pathway | Tissue | Disease Stage |
| Page: 1 |
Top |
Single-cell gene regulatory network inference analysis |
| Find out the significant the regulons (TFs) and the target genes of each regulon across cell types for different disease states |
| TF | Cell Type | Tissue | Disease Stage | Target Gene | RSS | Regulon Activity |
| ∗The dot plots of a searched regulon are shown for all cell subpopulations in each disease state of each tissue based on the regulon specific score inferred using pySCENIC and by calculating the average expression. |
| Page: 1 |
Top |
Somatic mutation of malignant transformation related genes |
| Annotation of somatic variants for genes involved in malignant transformation |
| Hugo Symbol | Variant Class | Variant Classification | dbSNP RS | HGVSc | HGVSp | HGVSp Short | SWISSPROT | BIOTYPE | SIFT | PolyPhen | Tumor Sample Barcode | Tissue | Histology | Sex | Age | Stage | Therapy Types | Drugs | Outcome |
| SPAG5 | SNV | Missense_Mutation | c.1814C>T | p.Ser605Phe | p.S605F | Q96R06 | protein_coding | tolerated(0.08) | benign(0.09) | TCGA-A7-A26G-01 | Breast | breast invasive carcinoma | Female | <65 | I/II | Chemotherapy | taxotere | SD | |
| SPAG5 | SNV | Missense_Mutation | rs761413655 | c.313N>G | p.Ile105Val | p.I105V | Q96R06 | protein_coding | tolerated_low_confidence(1) | benign(0) | TCGA-A8-A09B-01 | Breast | breast invasive carcinoma | Female | <65 | III/IV | Chemotherapy | 5-fluorouracil | SD |
| SPAG5 | SNV | Missense_Mutation | novel | c.994N>A | p.Leu332Ile | p.L332I | Q96R06 | protein_coding | tolerated(0.49) | benign(0.167) | TCGA-AN-A046-01 | Breast | breast invasive carcinoma | Female | >=65 | I/II | Unknown | Unknown | SD |
| SPAG5 | SNV | Missense_Mutation | c.3463N>C | p.Asp1155His | p.D1155H | Q96R06 | protein_coding | deleterious(0.03) | probably_damaging(0.988) | TCGA-AR-A251-01 | Breast | breast invasive carcinoma | Female | <65 | III/IV | Chemotherapy | doxorubicin | SD | |
| SPAG5 | SNV | Missense_Mutation | rs200191186 | c.3206G>A | p.Arg1069Lys | p.R1069K | Q96R06 | protein_coding | tolerated(0.6) | benign(0.013) | TCGA-B6-A3ZX-01 | Breast | breast invasive carcinoma | Female | <65 | III/IV | Chemotherapy | cyclophosphamide | PD |
| SPAG5 | SNV | Missense_Mutation | c.959N>T | p.Ala320Val | p.A320V | Q96R06 | protein_coding | tolerated(0.17) | benign(0.038) | TCGA-BH-A0HF-01 | Breast | breast invasive carcinoma | Female | >=65 | I/II | Hormone Therapy | arimidex | SD | |
| SPAG5 | SNV | Missense_Mutation | c.249N>A | p.Phe83Leu | p.F83L | Q96R06 | protein_coding | tolerated_low_confidence(0.18) | benign(0.088) | TCGA-C8-A1HL-01 | Breast | breast invasive carcinoma | Female | <65 | III/IV | Unknown | Unknown | SD | |
| SPAG5 | SNV | Missense_Mutation | rs144335125 | c.3454N>T | p.Arg1152Trp | p.R1152W | Q96R06 | protein_coding | deleterious(0) | probably_damaging(0.999) | TCGA-E2-A14P-01 | Breast | breast invasive carcinoma | Female | >=65 | III/IV | Targeted Molecular therapy | trastuzumab | SD |
| SPAG5 | SNV | Missense_Mutation | c.374N>T | p.Tyr125Phe | p.Y125F | Q96R06 | protein_coding | tolerated_low_confidence(0.67) | benign(0.001) | TCGA-E2-A14T-01 | Breast | breast invasive carcinoma | Female | <65 | I/II | Chemotherapy | doxorubicin | SD | |
| SPAG5 | SNV | Missense_Mutation | c.1306G>C | p.Asp436His | p.D436H | Q96R06 | protein_coding | deleterious(0.03) | probably_damaging(0.919) | TCGA-E2-A1IN-01 | Breast | breast invasive carcinoma | Female | <65 | I/II | Hormone Therapy | arimidex | SD |
| Page: 1 2 3 4 5 6 7 8 9 10 11 |
Top |
Related drugs of malignant transformation related genes |
| Identification of chemicals and drugs interact with genes involved in malignant transfromation |
| (DGIdb 4.0) |
| Entrez ID | Symbol | Category | Interaction Types | Drug Claim Name | Drug Name | PMIDs |
| Page: 1 |

Copyright 2023-Present -The University of Texas Health Science Center at Houston |