
|
|||||
|
 | |
| |
| |
| |
| |
| |
|
Gene: SPAG4 |
Gene summary for SPAG4 |
| Gene information | Species | Human | Gene symbol | SPAG4 | Gene ID | 6676 |
| Gene name | sperm associated antigen 4 | |
| Gene Alias | CT127 | |
| Cytomap | 20q11.22 | |
| Gene Type | protein-coding | GO ID | GO:0000003 | UniProtAcc | Q9NPE6 |
Top |
Malignant transformation analysis |
| Identification of the aberrant gene expression in precancerous and cancerous lesions by comparing the gene expression of stem-like cells in diseased tissues with normal stem cells |
| Entrez ID | Symbol | Replicates | Species | Organ | Tissue | Adj P-value | Log2FC | Malignancy |
| 6676 | SPAG4 | HCC1_Meng | Human | Liver | HCC | 1.19e-27 | 1.60e-01 | 0.0246 |
| 6676 | SPAG4 | HCC2 | Human | Liver | HCC | 6.47e-07 | 3.07e+00 | 0.5341 |
| 6676 | SPAG4 | S014 | Human | Liver | HCC | 2.69e-19 | 7.94e-01 | 0.2254 |
| 6676 | SPAG4 | S015 | Human | Liver | HCC | 3.13e-15 | 8.48e-01 | 0.2375 |
| 6676 | SPAG4 | S016 | Human | Liver | HCC | 8.01e-20 | 6.00e-01 | 0.2243 |
| 6676 | SPAG4 | S027 | Human | Liver | HCC | 8.62e-04 | 3.96e-01 | 0.2446 |
| 6676 | SPAG4 | S028 | Human | Liver | HCC | 2.63e-05 | 3.48e-01 | 0.2503 |
| 6676 | SPAG4 | S029 | Human | Liver | HCC | 1.20e-15 | 7.61e-01 | 0.2581 |
| 6676 | SPAG4 | PTC06 | Human | Thyroid | PTC | 3.49e-02 | 1.14e-01 | 0.2057 |
| 6676 | SPAG4 | PTC07 | Human | Thyroid | PTC | 4.82e-02 | 6.18e-02 | 0.2044 |
| 6676 | SPAG4 | ATC09 | Human | Thyroid | ATC | 1.76e-29 | 9.43e-01 | 0.2871 |
| 6676 | SPAG4 | ATC11 | Human | Thyroid | ATC | 7.49e-03 | 2.53e-01 | 0.3386 |
| 6676 | SPAG4 | ATC12 | Human | Thyroid | ATC | 3.28e-16 | 3.87e-01 | 0.34 |
| 6676 | SPAG4 | ATC13 | Human | Thyroid | ATC | 1.28e-08 | 1.91e-01 | 0.34 |
| 6676 | SPAG4 | ATC1 | Human | Thyroid | ATC | 2.06e-28 | 9.98e-01 | 0.2878 |
| 6676 | SPAG4 | ATC3 | Human | Thyroid | ATC | 6.22e-03 | 2.11e-01 | 0.338 |
| 6676 | SPAG4 | ATC4 | Human | Thyroid | ATC | 8.41e-22 | 5.10e-01 | 0.34 |
| 6676 | SPAG4 | ATC5 | Human | Thyroid | ATC | 5.45e-11 | 2.22e-01 | 0.34 |
| Page: 1 |
| Tissue | Expression Dynamics | Abbreviation |
| Liver | 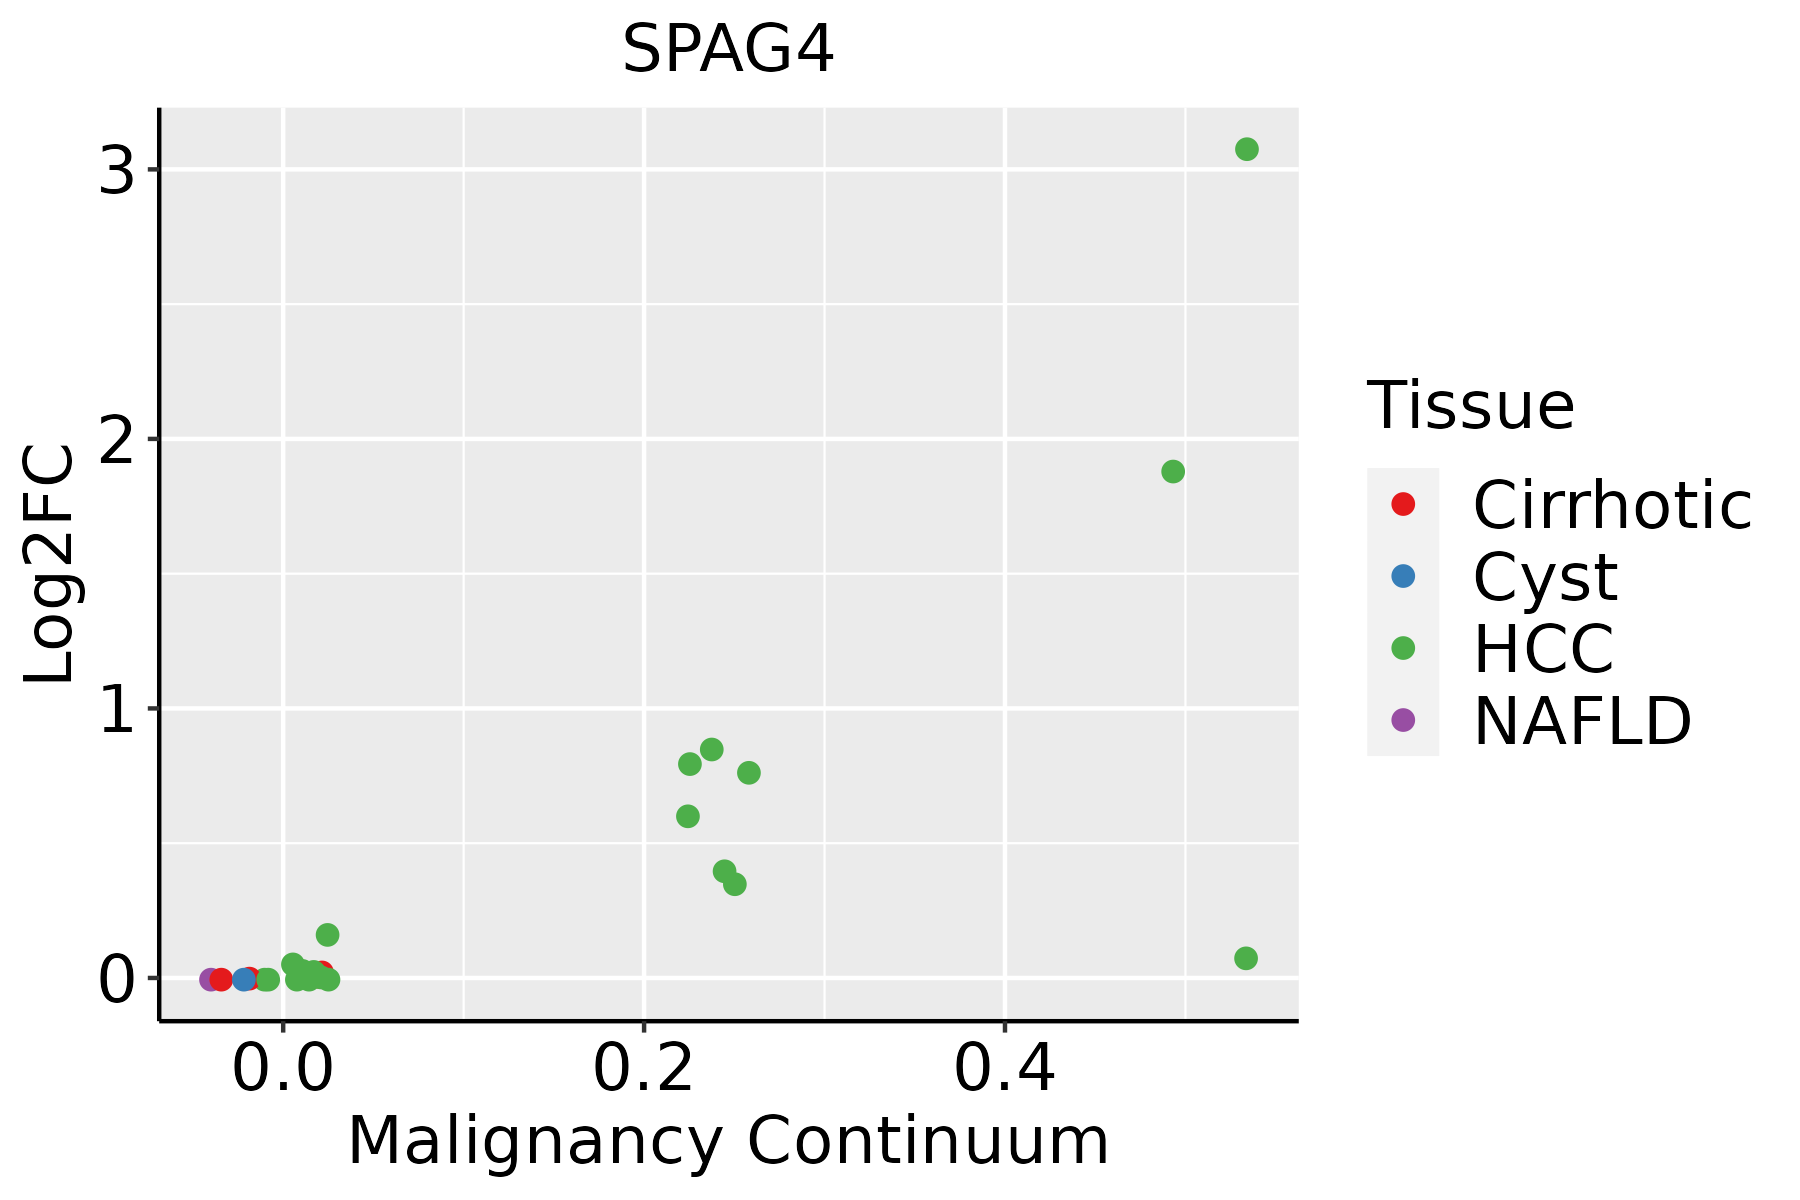 | HCC: Hepatocellular carcinoma |
| NAFLD: Non-alcoholic fatty liver disease | ||
| Thyroid | 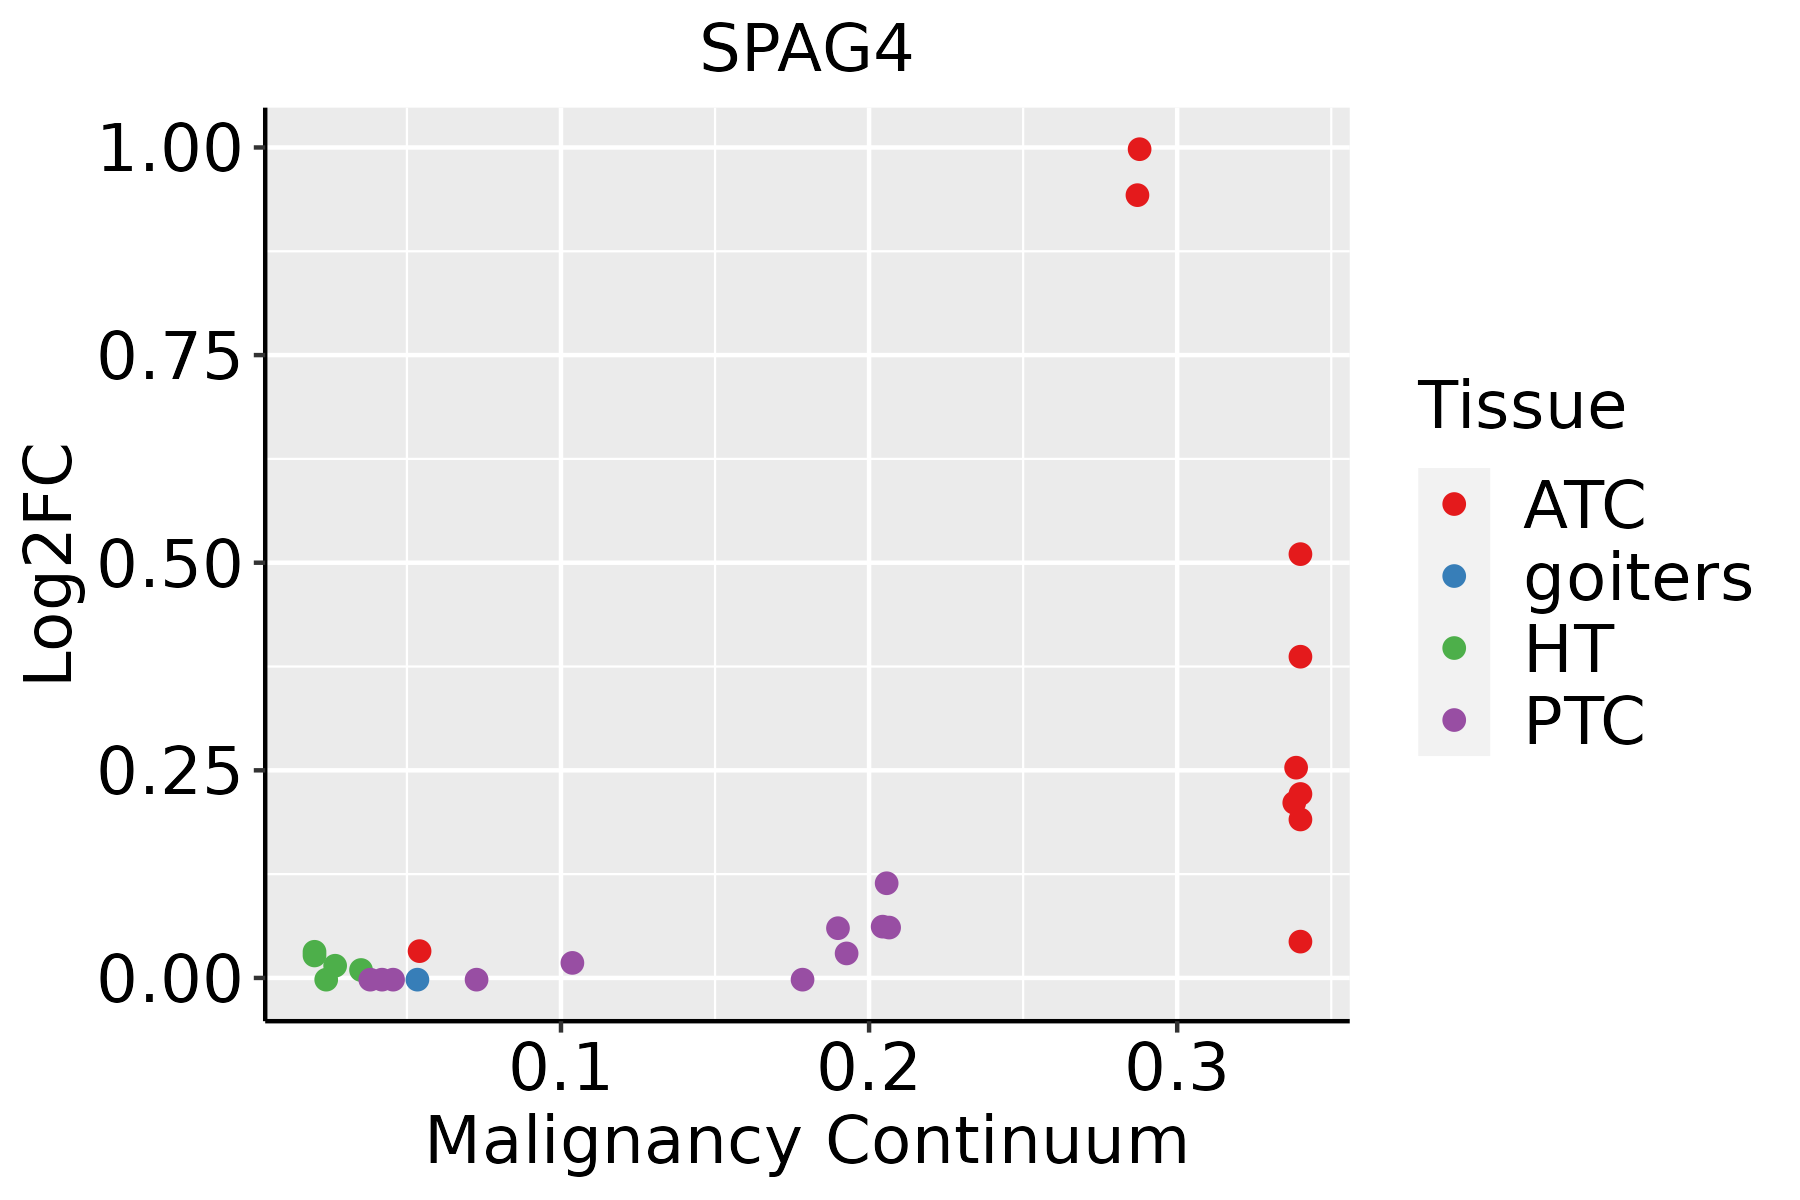 | ATC: Anaplastic thyroid cancer |
| HT: Hashimoto's thyroiditis | ||
| PTC: Papillary thyroid cancer |
| ∗log2FC in expression of this searched gene in stem-like cells from each diseased tissue sample relative to stem-like cells in normal samples in each tissue plotted against the malignancy continuum. Samples are colored based on if they are from different disease stage. |
Top |
Malignant transformation related pathway analysis |
| Find out the enriched GO biological processes and KEGG pathways involved in transition from healthy to precancer to cancer |
| Tissue | Disease Stage | Enriched GO biological Processes |
| Colorectum | AD |  |
| Colorectum | SER |  |
| Colorectum | MSS |  |
| Colorectum | MSI-H |  |
| Colorectum | FAP |  |
| ∗Top 15 enriched GO BP terms are showed in the bar plot of each disease state in each tissue. Each row represents a significant GO biological process which is colored according to the -log10(p.adjust). |
| Page: 1 2 3 4 5 6 7 8 9 |
| GO ID | Tissue | Disease Stage | Description | Gene Ratio | Bg Ratio | pvalue | p.adjust | Count |
| GO:00069971 | Liver | HCC | nucleus organization | 82/7958 | 133/18723 | 6.32e-06 | 7.72e-05 | 82 |
| GO:0006998 | Liver | HCC | nuclear envelope organization | 34/7958 | 47/18723 | 3.27e-05 | 3.29e-04 | 34 |
| GO:00069977 | Thyroid | PTC | nucleus organization | 65/5968 | 133/18723 | 3.16e-05 | 3.01e-04 | 65 |
| GO:00069985 | Thyroid | PTC | nuclear envelope organization | 27/5968 | 47/18723 | 2.57e-04 | 1.84e-03 | 27 |
| GO:000699714 | Thyroid | ATC | nucleus organization | 65/6293 | 133/18723 | 1.87e-04 | 1.26e-03 | 65 |
| GO:000699812 | Thyroid | ATC | nuclear envelope organization | 28/6293 | 47/18723 | 2.31e-04 | 1.49e-03 | 28 |
| Page: 1 |
| Pathway ID | Tissue | Disease Stage | Description | Gene Ratio | Bg Ratio | pvalue | p.adjust | qvalue | Count |
| Page: 1 |
Top |
Cell-cell communication analysis |
| Identification of potential cell-cell interactions between two cell types and their ligand-receptor pairs for different disease states |
| Ligand | Receptor | LRpair | Pathway | Tissue | Disease Stage |
| Page: 1 |
Top |
Single-cell gene regulatory network inference analysis |
| Find out the significant the regulons (TFs) and the target genes of each regulon across cell types for different disease states |
| TF | Cell Type | Tissue | Disease Stage | Target Gene | RSS | Regulon Activity |
| ∗The dot plots of a searched regulon are shown for all cell subpopulations in each disease state of each tissue based on the regulon specific score inferred using pySCENIC and by calculating the average expression. |
| Page: 1 |
Top |
Somatic mutation of malignant transformation related genes |
| Annotation of somatic variants for genes involved in malignant transformation |
| Hugo Symbol | Variant Class | Variant Classification | dbSNP RS | HGVSc | HGVSp | HGVSp Short | SWISSPROT | BIOTYPE | SIFT | PolyPhen | Tumor Sample Barcode | Tissue | Histology | Sex | Age | Stage | Therapy Types | Drugs | Outcome |
| SPAG4 | SNV | Missense_Mutation | c.1040G>A | p.Gly347Glu | p.G347E | Q9NPE6 | protein_coding | deleterious(0.04) | benign(0.031) | TCGA-AC-A23H-01 | Breast | breast invasive carcinoma | Female | >=65 | I/II | Unknown | Unknown | PD | |
| SPAG4 | SNV | Missense_Mutation | c.1102N>A | p.Glu368Lys | p.E368K | Q9NPE6 | protein_coding | deleterious(0.01) | probably_damaging(0.992) | TCGA-D8-A27G-01 | Breast | breast invasive carcinoma | Female | >=65 | I/II | Unknown | Unknown | SD | |
| SPAG4 | SNV | Missense_Mutation | rs375034562 | c.452N>A | p.Gly151Glu | p.G151E | Q9NPE6 | protein_coding | tolerated(0.09) | benign(0.348) | TCGA-FU-A23K-01 | Cervix | cervical & endocervical cancer | Female | <65 | III/IV | Unknown | Unknown | SD |
| SPAG4 | SNV | Missense_Mutation | novel | c.919T>C | p.Phe307Leu | p.F307L | Q9NPE6 | protein_coding | tolerated(0.07) | benign(0.226) | TCGA-AA-3984-01 | Colorectum | colon adenocarcinoma | Female | <65 | I/II | Unknown | Unknown | SD |
| SPAG4 | SNV | Missense_Mutation | novel | c.134N>T | p.Gly45Val | p.G45V | Q9NPE6 | protein_coding | tolerated_low_confidence(0.11) | benign(0.006) | TCGA-CM-5348-01 | Colorectum | colon adenocarcinoma | Male | >=65 | III/IV | Unknown | Unknown | SD |
| SPAG4 | SNV | Missense_Mutation | novel | c.524G>A | p.Ser175Asn | p.S175N | Q9NPE6 | protein_coding | tolerated(0.25) | benign(0.118) | TCGA-EI-6917-01 | Colorectum | rectum adenocarcinoma | Male | <65 | III/IV | Chemotherapy | 5fluorouracil+oxaciplatina+l-folinian | SD |
| SPAG4 | SNV | Missense_Mutation | novel | c.841N>T | p.Asn281Tyr | p.N281Y | Q9NPE6 | protein_coding | deleterious(0.01) | benign(0.259) | TCGA-A5-A0G1-01 | Endometrium | uterine corpus endometrioid carcinoma | Female | >=65 | I/II | Unknown | Unknown | SD |
| SPAG4 | SNV | Missense_Mutation | c.1137N>T | p.Glu379Asp | p.E379D | Q9NPE6 | protein_coding | deleterious(0.04) | benign(0.197) | TCGA-AP-A056-01 | Endometrium | uterine corpus endometrioid carcinoma | Female | <65 | I/II | Unknown | Unknown | SD | |
| SPAG4 | SNV | Missense_Mutation | rs202014559 | c.1271N>A | p.Arg424Gln | p.R424Q | Q9NPE6 | protein_coding | tolerated(0.27) | benign(0.185) | TCGA-AP-A0LM-01 | Endometrium | uterine corpus endometrioid carcinoma | Female | <65 | III/IV | Chemotherapy | cisplatin | SD |
| SPAG4 | SNV | Missense_Mutation | novel | c.471N>A | p.Met157Ile | p.M157I | Q9NPE6 | protein_coding | tolerated(0.06) | benign(0) | TCGA-AX-A2HA-01 | Endometrium | uterine corpus endometrioid carcinoma | Female | <65 | I/II | Unknown | Unknown | SD |
| Page: 1 2 3 |
Top |
Related drugs of malignant transformation related genes |
| Identification of chemicals and drugs interact with genes involved in malignant transfromation |
| (DGIdb 4.0) |
| Entrez ID | Symbol | Category | Interaction Types | Drug Claim Name | Drug Name | PMIDs |
| Page: 1 |

Copyright 2023-Present -The University of Texas Health Science Center at Houston |