
|
|||||
|
 | |
| |
| |
| |
| |
| |
|
Gene: SPAG1 |
Gene summary for SPAG1 |
| Gene information | Species | Human | Gene symbol | SPAG1 | Gene ID | 6674 |
| Gene name | sperm associated antigen 1 | |
| Gene Alias | CILD28 | |
| Cytomap | 8q22.2 | |
| Gene Type | protein-coding | GO ID | GO:0000003 | UniProtAcc | Q07617 |
Top |
Malignant transformation analysis |
| Identification of the aberrant gene expression in precancerous and cancerous lesions by comparing the gene expression of stem-like cells in diseased tissues with normal stem cells |
| Entrez ID | Symbol | Replicates | Species | Organ | Tissue | Adj P-value | Log2FC | Malignancy |
| 6674 | SPAG1 | P2T-E | Human | Esophagus | ESCC | 1.29e-06 | 1.25e-01 | 0.1177 |
| 6674 | SPAG1 | P8T-E | Human | Esophagus | ESCC | 1.14e-13 | 2.64e-01 | 0.0889 |
| 6674 | SPAG1 | P16T-E | Human | Esophagus | ESCC | 1.05e-05 | 1.43e-01 | 0.1153 |
| 6674 | SPAG1 | P22T-E | Human | Esophagus | ESCC | 6.81e-03 | 6.21e-02 | 0.1236 |
| 6674 | SPAG1 | P23T-E | Human | Esophagus | ESCC | 1.50e-13 | 4.36e-01 | 0.108 |
| 6674 | SPAG1 | P26T-E | Human | Esophagus | ESCC | 1.76e-06 | 1.05e-01 | 0.1276 |
| 6674 | SPAG1 | P27T-E | Human | Esophagus | ESCC | 6.28e-10 | 5.25e-02 | 0.1055 |
| 6674 | SPAG1 | P28T-E | Human | Esophagus | ESCC | 5.86e-04 | 4.82e-02 | 0.1149 |
| 6674 | SPAG1 | P32T-E | Human | Esophagus | ESCC | 1.60e-07 | 8.75e-02 | 0.1666 |
| 6674 | SPAG1 | P37T-E | Human | Esophagus | ESCC | 4.08e-04 | 7.65e-02 | 0.1371 |
| 6674 | SPAG1 | P39T-E | Human | Esophagus | ESCC | 2.00e-11 | 2.60e-01 | 0.0894 |
| 6674 | SPAG1 | P52T-E | Human | Esophagus | ESCC | 1.03e-04 | 1.48e-02 | 0.1555 |
| 6674 | SPAG1 | P57T-E | Human | Esophagus | ESCC | 4.40e-05 | 1.40e-01 | 0.0926 |
| 6674 | SPAG1 | P62T-E | Human | Esophagus | ESCC | 1.38e-02 | 1.01e-01 | 0.1302 |
| 6674 | SPAG1 | P74T-E | Human | Esophagus | ESCC | 3.47e-07 | 3.08e-01 | 0.1479 |
| 6674 | SPAG1 | P75T-E | Human | Esophagus | ESCC | 8.64e-19 | 4.46e-01 | 0.1125 |
| 6674 | SPAG1 | P76T-E | Human | Esophagus | ESCC | 2.82e-05 | 1.31e-01 | 0.1207 |
| 6674 | SPAG1 | P82T-E | Human | Esophagus | ESCC | 7.32e-16 | 8.65e-01 | 0.1072 |
| 6674 | SPAG1 | P83T-E | Human | Esophagus | ESCC | 2.38e-03 | 8.47e-02 | 0.1738 |
| 6674 | SPAG1 | P127T-E | Human | Esophagus | ESCC | 1.14e-10 | 2.45e-01 | 0.0826 |
| Page: 1 2 3 |
| Tissue | Expression Dynamics | Abbreviation |
| Esophagus |  | ESCC: Esophageal squamous cell carcinoma |
| HGIN: High-grade intraepithelial neoplasias | ||
| LGIN: Low-grade intraepithelial neoplasias | ||
| Liver | 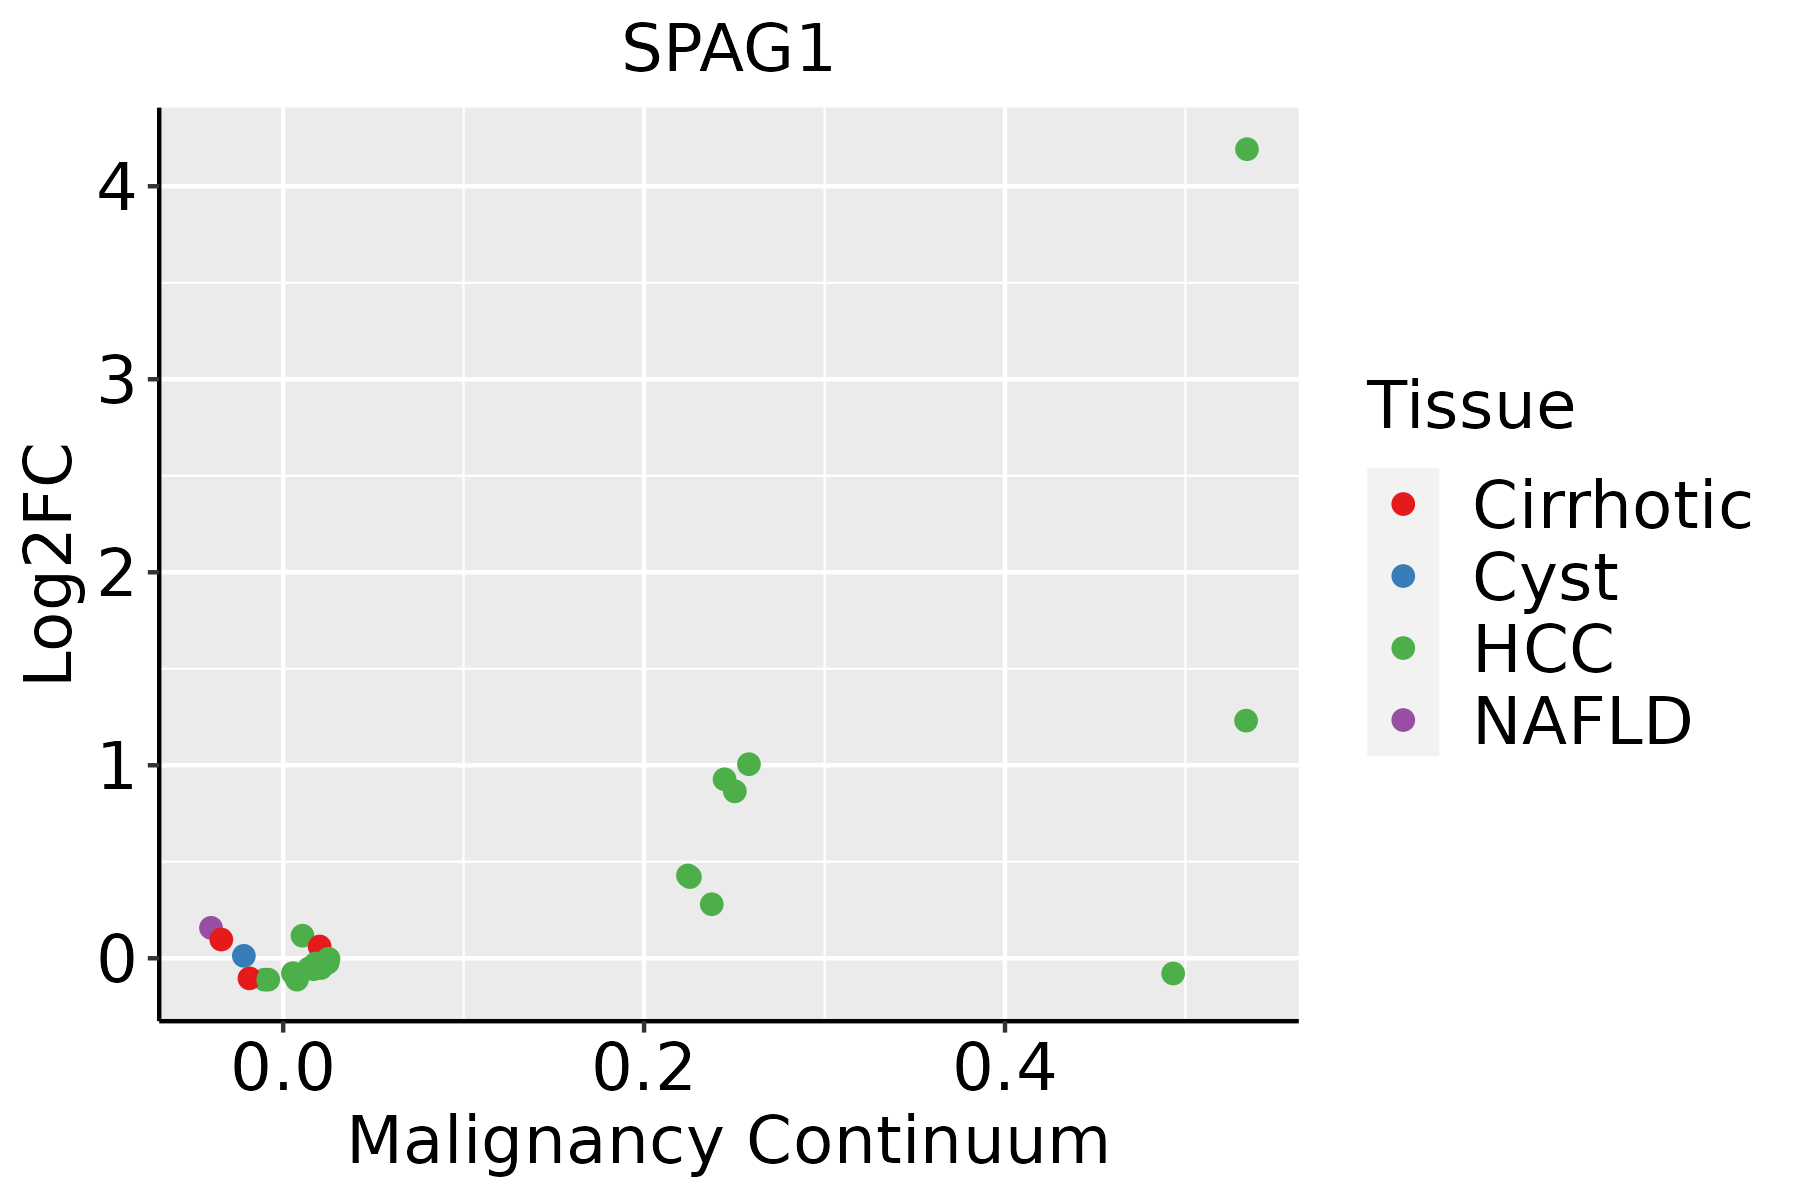 | HCC: Hepatocellular carcinoma |
| NAFLD: Non-alcoholic fatty liver disease | ||
| Lung | 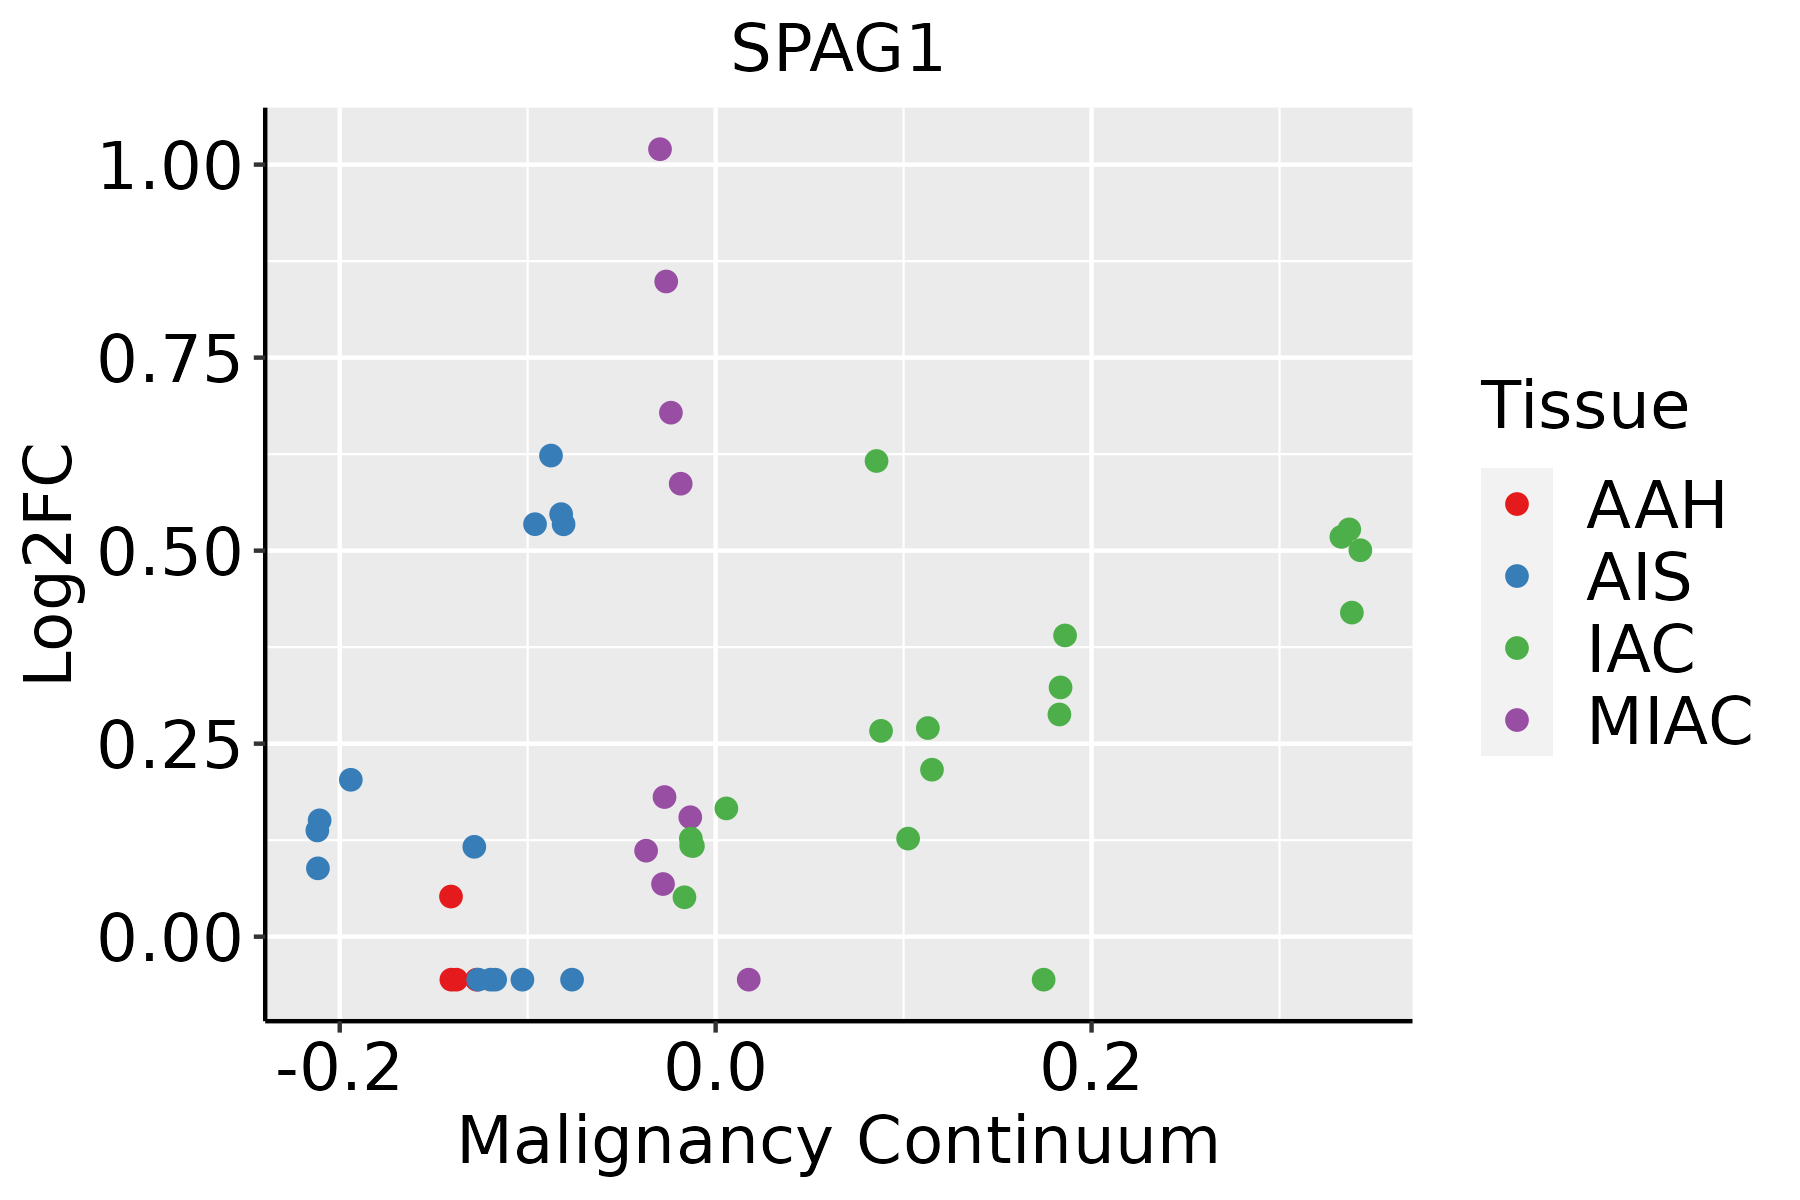 | AAH: Atypical adenomatous hyperplasia |
| AIS: Adenocarcinoma in situ | ||
| IAC: Invasive lung adenocarcinoma | ||
| MIA: Minimally invasive adenocarcinoma | ||
| Oral Cavity | 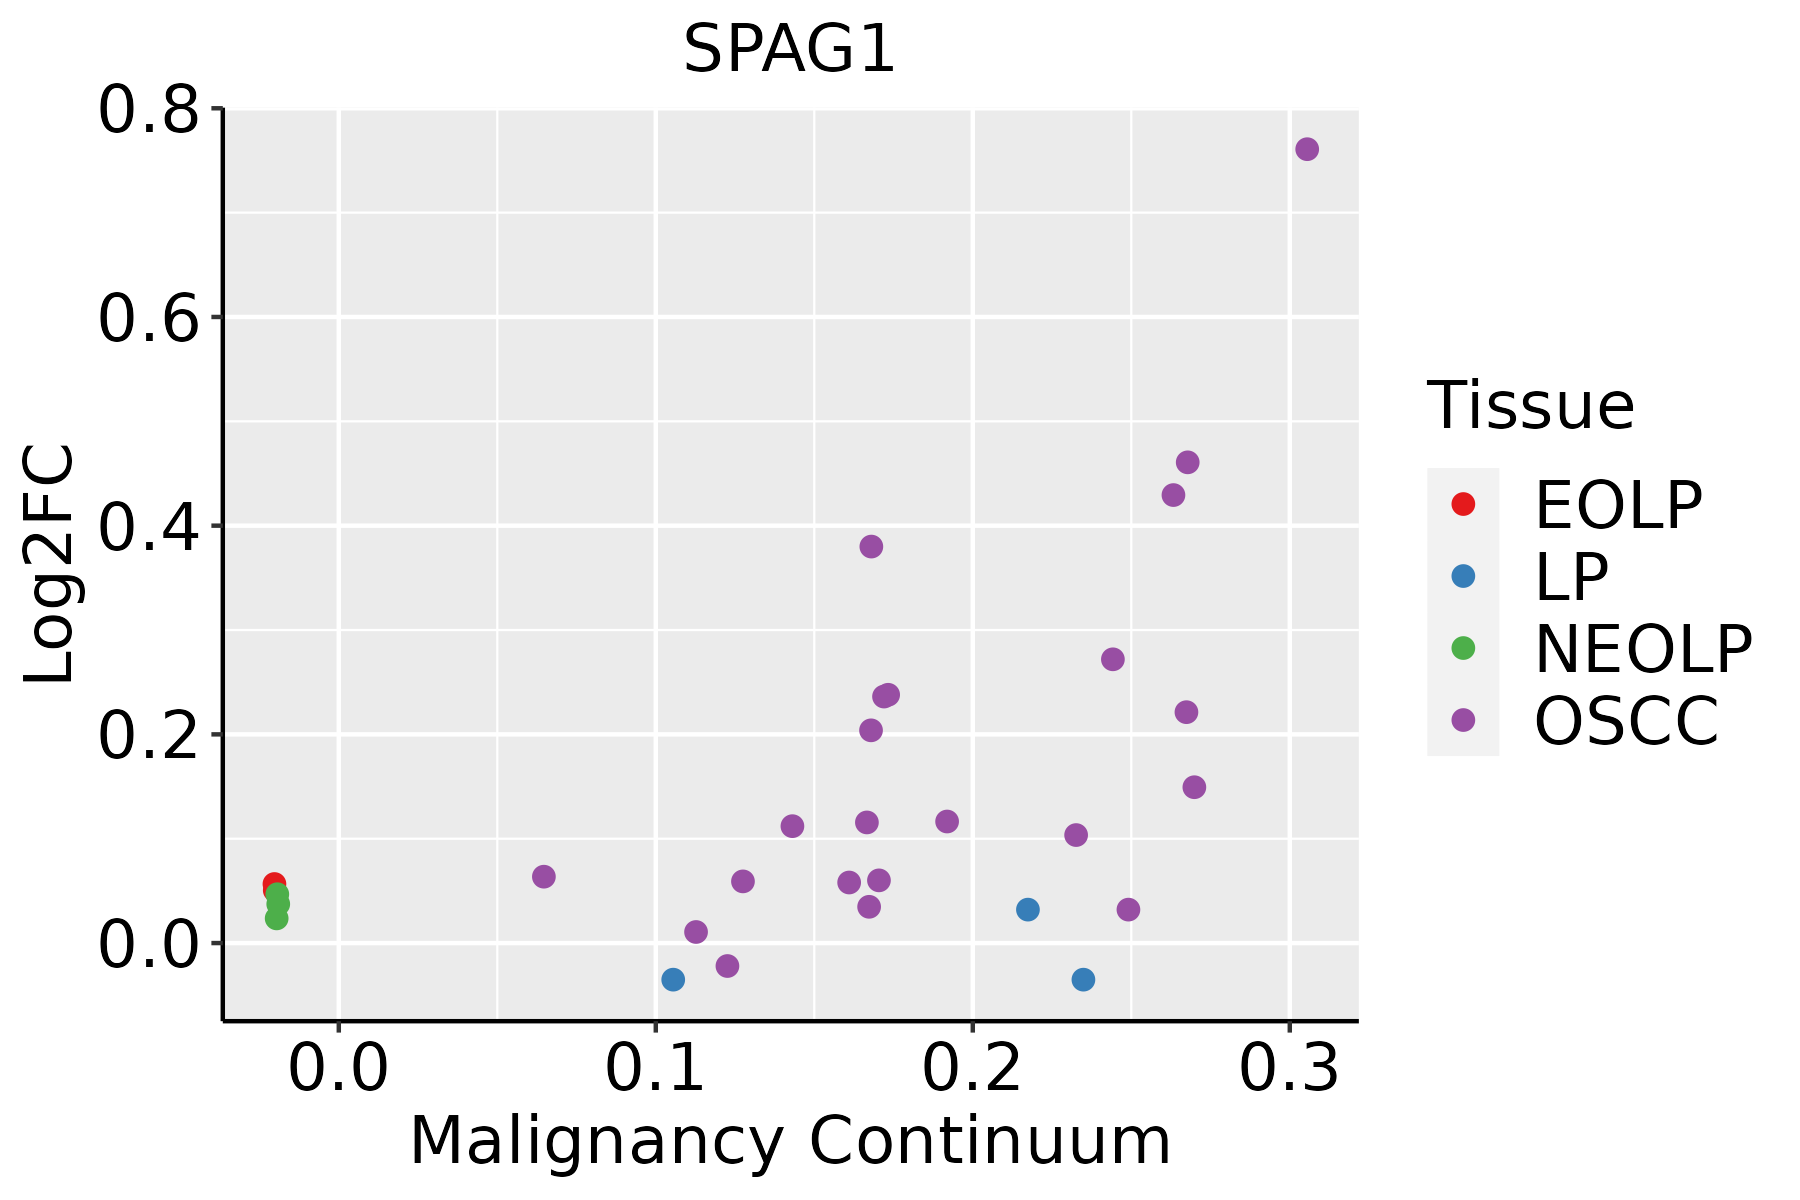 | EOLP: Erosive Oral lichen planus |
| LP: leukoplakia | ||
| NEOLP: Non-erosive oral lichen planus | ||
| OSCC: Oral squamous cell carcinoma |
| ∗log2FC in expression of this searched gene in stem-like cells from each diseased tissue sample relative to stem-like cells in normal samples in each tissue plotted against the malignancy continuum. Samples are colored based on if they are from different disease stage. |
Top |
Malignant transformation related pathway analysis |
| Find out the enriched GO biological processes and KEGG pathways involved in transition from healthy to precancer to cancer |
| Tissue | Disease Stage | Enriched GO biological Processes |
| Colorectum | AD |  |
| Colorectum | SER |  |
| Colorectum | MSS |  |
| Colorectum | MSI-H |  |
| Colorectum | FAP |  |
| ∗Top 15 enriched GO BP terms are showed in the bar plot of each disease state in each tissue. Each row represents a significant GO biological process which is colored according to the -log10(p.adjust). |
| Page: 1 2 3 4 5 6 7 8 9 |
| GO ID | Tissue | Disease Stage | Description | Gene Ratio | Bg Ratio | pvalue | p.adjust | Count |
| GO:00991114 | Esophagus | ESCC | microtubule-based transport | 115/8552 | 190/18723 | 2.54e-05 | 2.15e-04 | 115 |
| GO:0060271 | Lung | IAC | cilium assembly | 55/2061 | 337/18723 | 1.84e-03 | 1.88e-02 | 55 |
| GO:0044782 | Lung | IAC | cilium organization | 58/2061 | 368/18723 | 3.15e-03 | 2.75e-02 | 58 |
| GO:00602711 | Lung | MIAC | cilium assembly | 37/967 | 337/18723 | 1.29e-05 | 9.85e-04 | 37 |
| GO:00447821 | Lung | MIAC | cilium organization | 38/967 | 368/18723 | 3.93e-05 | 2.08e-03 | 38 |
| GO:00991113 | Oral cavity | OSCC | microtubule-based transport | 96/7305 | 190/18723 | 7.92e-04 | 4.27e-03 | 96 |
| GO:00991115 | Thyroid | PTC | microtubule-based transport | 88/5968 | 190/18723 | 2.08e-05 | 2.08e-04 | 88 |
| GO:009911112 | Thyroid | ATC | microtubule-based transport | 91/6293 | 190/18723 | 2.97e-05 | 2.48e-04 | 91 |
| Page: 1 |
| Pathway ID | Tissue | Disease Stage | Description | Gene Ratio | Bg Ratio | pvalue | p.adjust | qvalue | Count |
| Page: 1 |
Top |
Cell-cell communication analysis |
| Identification of potential cell-cell interactions between two cell types and their ligand-receptor pairs for different disease states |
| Ligand | Receptor | LRpair | Pathway | Tissue | Disease Stage |
| Page: 1 |
Top |
Single-cell gene regulatory network inference analysis |
| Find out the significant the regulons (TFs) and the target genes of each regulon across cell types for different disease states |
| TF | Cell Type | Tissue | Disease Stage | Target Gene | RSS | Regulon Activity |
| ∗The dot plots of a searched regulon are shown for all cell subpopulations in each disease state of each tissue based on the regulon specific score inferred using pySCENIC and by calculating the average expression. |
| Page: 1 |
Top |
Somatic mutation of malignant transformation related genes |
| Annotation of somatic variants for genes involved in malignant transformation |
| Hugo Symbol | Variant Class | Variant Classification | dbSNP RS | HGVSc | HGVSp | HGVSp Short | SWISSPROT | BIOTYPE | SIFT | PolyPhen | Tumor Sample Barcode | Tissue | Histology | Sex | Age | Stage | Therapy Types | Drugs | Outcome |
| SPAG1 | SNV | Missense_Mutation | c.574N>C | p.Glu192Gln | p.E192Q | Q07617 | protein_coding | tolerated(0.07) | possibly_damaging(0.895) | TCGA-AC-A23H-01 | Breast | breast invasive carcinoma | Female | >=65 | I/II | Unknown | Unknown | PD | |
| SPAG1 | SNV | Missense_Mutation | c.191N>G | p.His64Arg | p.H64R | Q07617 | protein_coding | tolerated(1) | benign(0) | TCGA-D8-A1XK-01 | Breast | breast invasive carcinoma | Female | <65 | I/II | Chemotherapy | doxorubicine+cyclophosphamide | SD | |
| SPAG1 | SNV | Missense_Mutation | rs753165641 | c.127N>A | p.Leu43Ile | p.L43I | Q07617 | protein_coding | deleterious(0.02) | benign(0.173) | TCGA-C5-A1M9-01 | Cervix | cervical & endocervical cancer | Female | <65 | I/II | Chemotherapy | cisplatin | PD |
| SPAG1 | SNV | Missense_Mutation | novel | c.2374C>A | p.Pro792Thr | p.P792T | Q07617 | protein_coding | tolerated(0.6) | benign(0.038) | TCGA-VS-A9V5-01 | Cervix | cervical & endocervical cancer | Female | <65 | I/II | Chemotherapy | carboplatin | PD |
| SPAG1 | SNV | Missense_Mutation | novel | c.2053N>A | p.Gln685Lys | p.Q685K | Q07617 | protein_coding | tolerated(0.24) | benign(0.134) | TCGA-ZJ-AAX4-01 | Cervix | cervical & endocervical cancer | Female | >=65 | I/II | Unknown | Unknown | SD |
| SPAG1 | SNV | Missense_Mutation | c.1771C>T | p.Pro591Ser | p.P591S | Q07617 | protein_coding | deleterious(0.04) | benign(0.08) | TCGA-AA-3864-01 | Colorectum | colon adenocarcinoma | Male | >=65 | I/II | Unknown | Unknown | SD | |
| SPAG1 | SNV | Missense_Mutation | novel | c.292N>A | p.Asp98Asn | p.D98N | Q07617 | protein_coding | deleterious(0) | probably_damaging(0.965) | TCGA-AA-3930-01 | Colorectum | colon adenocarcinoma | Male | >=65 | III/IV | Chemotherapy | capecitabine | PD |
| SPAG1 | SNV | Missense_Mutation | novel | c.313N>A | p.Glu105Lys | p.E105K | Q07617 | protein_coding | deleterious(0) | probably_damaging(0.941) | TCGA-AA-3984-01 | Colorectum | colon adenocarcinoma | Female | <65 | I/II | Unknown | Unknown | SD |
| SPAG1 | SNV | Missense_Mutation | rs759277423 | c.1063N>A | p.Gly355Arg | p.G355R | Q07617 | protein_coding | tolerated(0.29) | benign(0) | TCGA-AA-3984-01 | Colorectum | colon adenocarcinoma | Female | <65 | I/II | Unknown | Unknown | SD |
| SPAG1 | SNV | Missense_Mutation | c.145N>A | p.Gly49Ser | p.G49S | Q07617 | protein_coding | deleterious(0) | probably_damaging(0.999) | TCGA-AD-6964-01 | Colorectum | colon adenocarcinoma | Male | <65 | III/IV | Chemotherapy | folfox | PD |
| Page: 1 2 3 4 5 6 7 8 9 10 |
Top |
Related drugs of malignant transformation related genes |
| Identification of chemicals and drugs interact with genes involved in malignant transfromation |
| (DGIdb 4.0) |
| Entrez ID | Symbol | Category | Interaction Types | Drug Claim Name | Drug Name | PMIDs |
| Page: 1 |

Copyright 2023-Present -The University of Texas Health Science Center at Houston |