
|
|||||
|
 | |
| |
| |
| |
| |
| |
|
Gene: SPA17 |
Gene summary for SPA17 |
| Gene information | Species | Human | Gene symbol | SPA17 | Gene ID | 53340 |
| Gene name | sperm autoantigenic protein 17 | |
| Gene Alias | CT22 | |
| Cytomap | 11q24.2 | |
| Gene Type | protein-coding | GO ID | GO:0000003 | UniProtAcc | A0A172Q397 |
Top |
Malignant transformation analysis |
| Identification of the aberrant gene expression in precancerous and cancerous lesions by comparing the gene expression of stem-like cells in diseased tissues with normal stem cells |
| Entrez ID | Symbol | Replicates | Species | Organ | Tissue | Adj P-value | Log2FC | Malignancy |
| 53340 | SPA17 | LZE24T | Human | Esophagus | ESCC | 1.32e-02 | 2.58e-01 | 0.0596 |
| 53340 | SPA17 | P2T-E | Human | Esophagus | ESCC | 4.43e-09 | 1.70e-01 | 0.1177 |
| 53340 | SPA17 | P4T-E | Human | Esophagus | ESCC | 2.92e-13 | 3.67e-01 | 0.1323 |
| 53340 | SPA17 | P5T-E | Human | Esophagus | ESCC | 2.38e-11 | 1.95e-01 | 0.1327 |
| 53340 | SPA17 | P8T-E | Human | Esophagus | ESCC | 2.37e-08 | 1.18e-01 | 0.0889 |
| 53340 | SPA17 | P11T-E | Human | Esophagus | ESCC | 2.98e-02 | 1.85e-01 | 0.1426 |
| 53340 | SPA17 | P16T-E | Human | Esophagus | ESCC | 2.35e-08 | 1.92e-01 | 0.1153 |
| 53340 | SPA17 | P21T-E | Human | Esophagus | ESCC | 1.00e-24 | 4.75e-01 | 0.1617 |
| 53340 | SPA17 | P22T-E | Human | Esophagus | ESCC | 1.25e-11 | 1.57e-01 | 0.1236 |
| 53340 | SPA17 | P24T-E | Human | Esophagus | ESCC | 4.61e-09 | 1.35e-01 | 0.1287 |
| 53340 | SPA17 | P26T-E | Human | Esophagus | ESCC | 3.09e-13 | 1.71e-01 | 0.1276 |
| 53340 | SPA17 | P27T-E | Human | Esophagus | ESCC | 4.89e-10 | 1.43e-01 | 0.1055 |
| 53340 | SPA17 | P31T-E | Human | Esophagus | ESCC | 9.25e-18 | 2.17e-01 | 0.1251 |
| 53340 | SPA17 | P32T-E | Human | Esophagus | ESCC | 4.34e-07 | 1.69e-01 | 0.1666 |
| 53340 | SPA17 | P37T-E | Human | Esophagus | ESCC | 9.75e-03 | 1.41e-01 | 0.1371 |
| 53340 | SPA17 | P47T-E | Human | Esophagus | ESCC | 5.39e-03 | 5.61e-02 | 0.1067 |
| 53340 | SPA17 | P52T-E | Human | Esophagus | ESCC | 3.98e-05 | 1.55e-01 | 0.1555 |
| 53340 | SPA17 | P54T-E | Human | Esophagus | ESCC | 9.07e-04 | 1.43e-01 | 0.0975 |
| 53340 | SPA17 | P62T-E | Human | Esophagus | ESCC | 9.45e-23 | 4.63e-01 | 0.1302 |
| 53340 | SPA17 | P74T-E | Human | Esophagus | ESCC | 2.06e-23 | 6.50e-01 | 0.1479 |
| Page: 1 2 |
| Tissue | Expression Dynamics | Abbreviation |
| Esophagus | 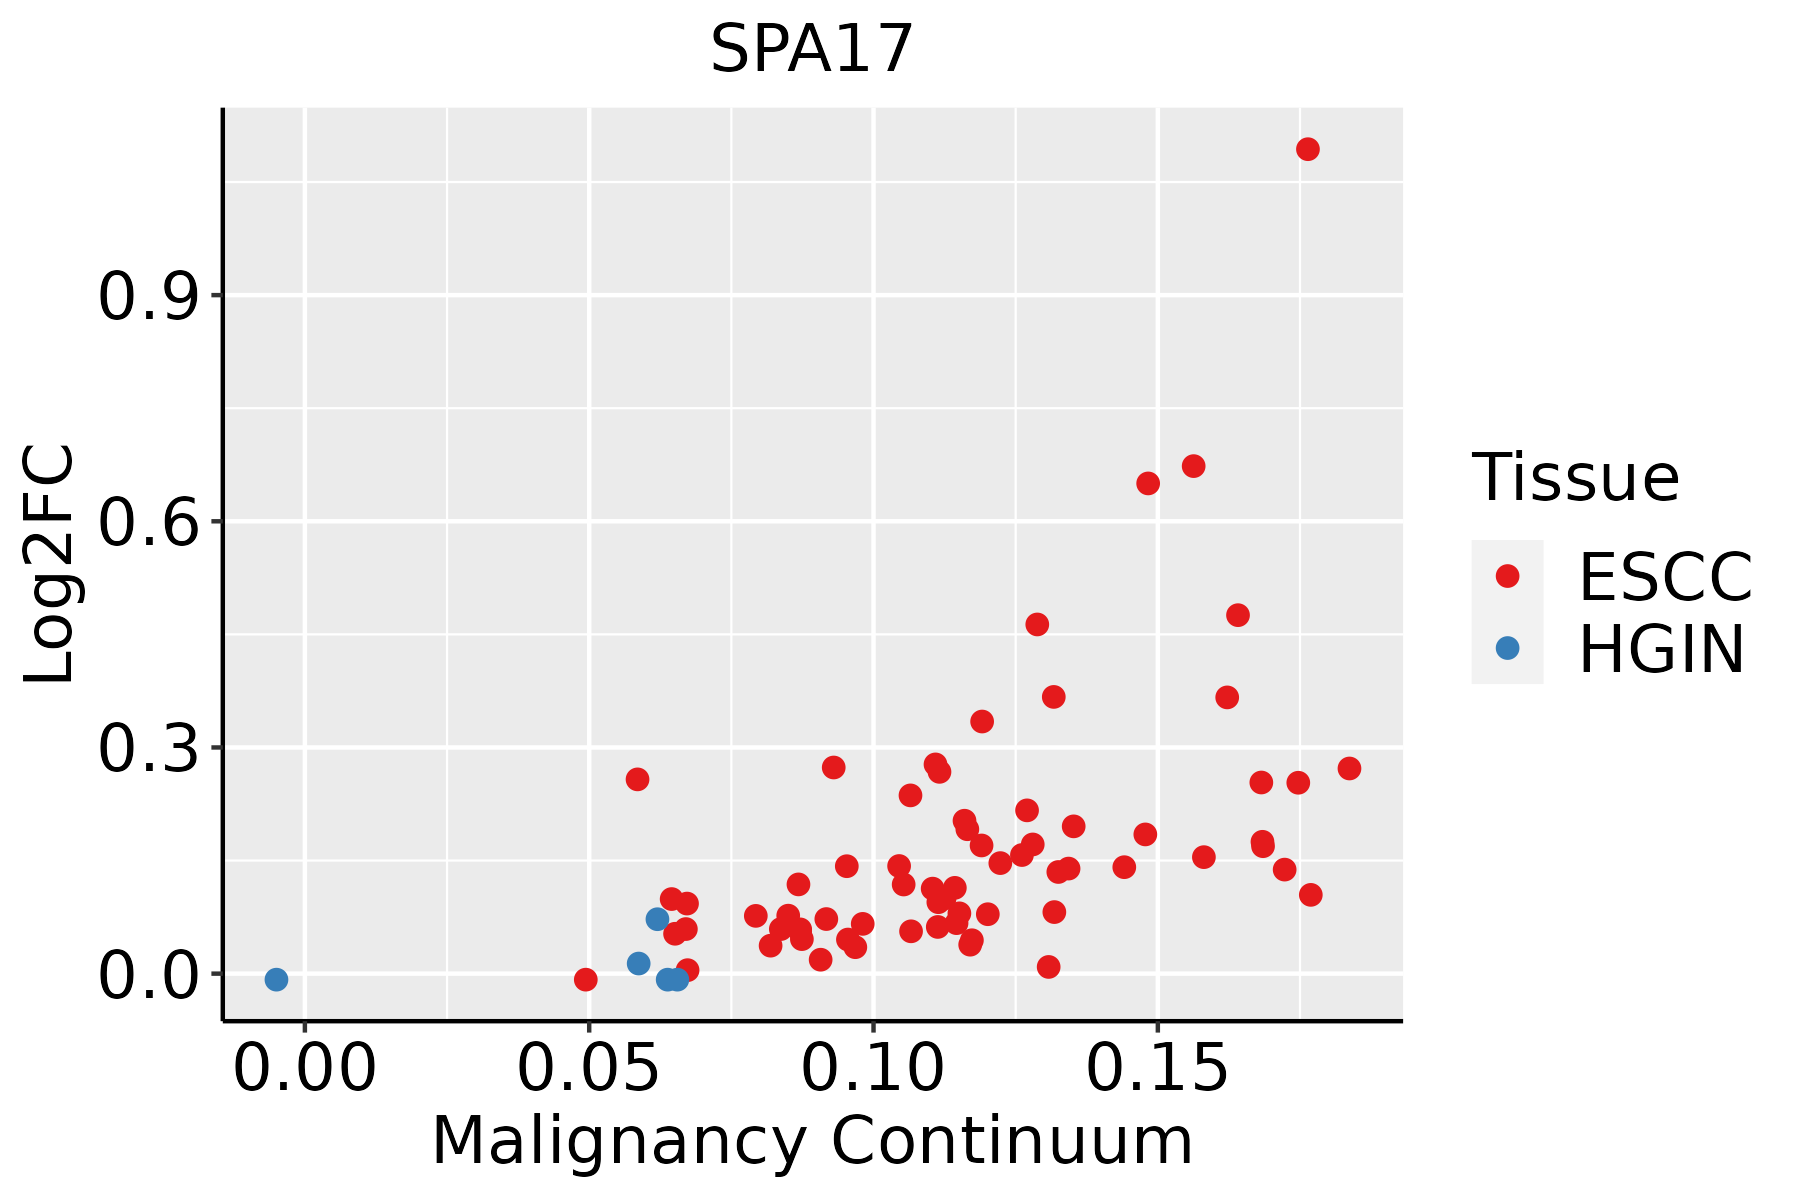 | ESCC: Esophageal squamous cell carcinoma |
| HGIN: High-grade intraepithelial neoplasias | ||
| LGIN: Low-grade intraepithelial neoplasias | ||
| Oral Cavity | 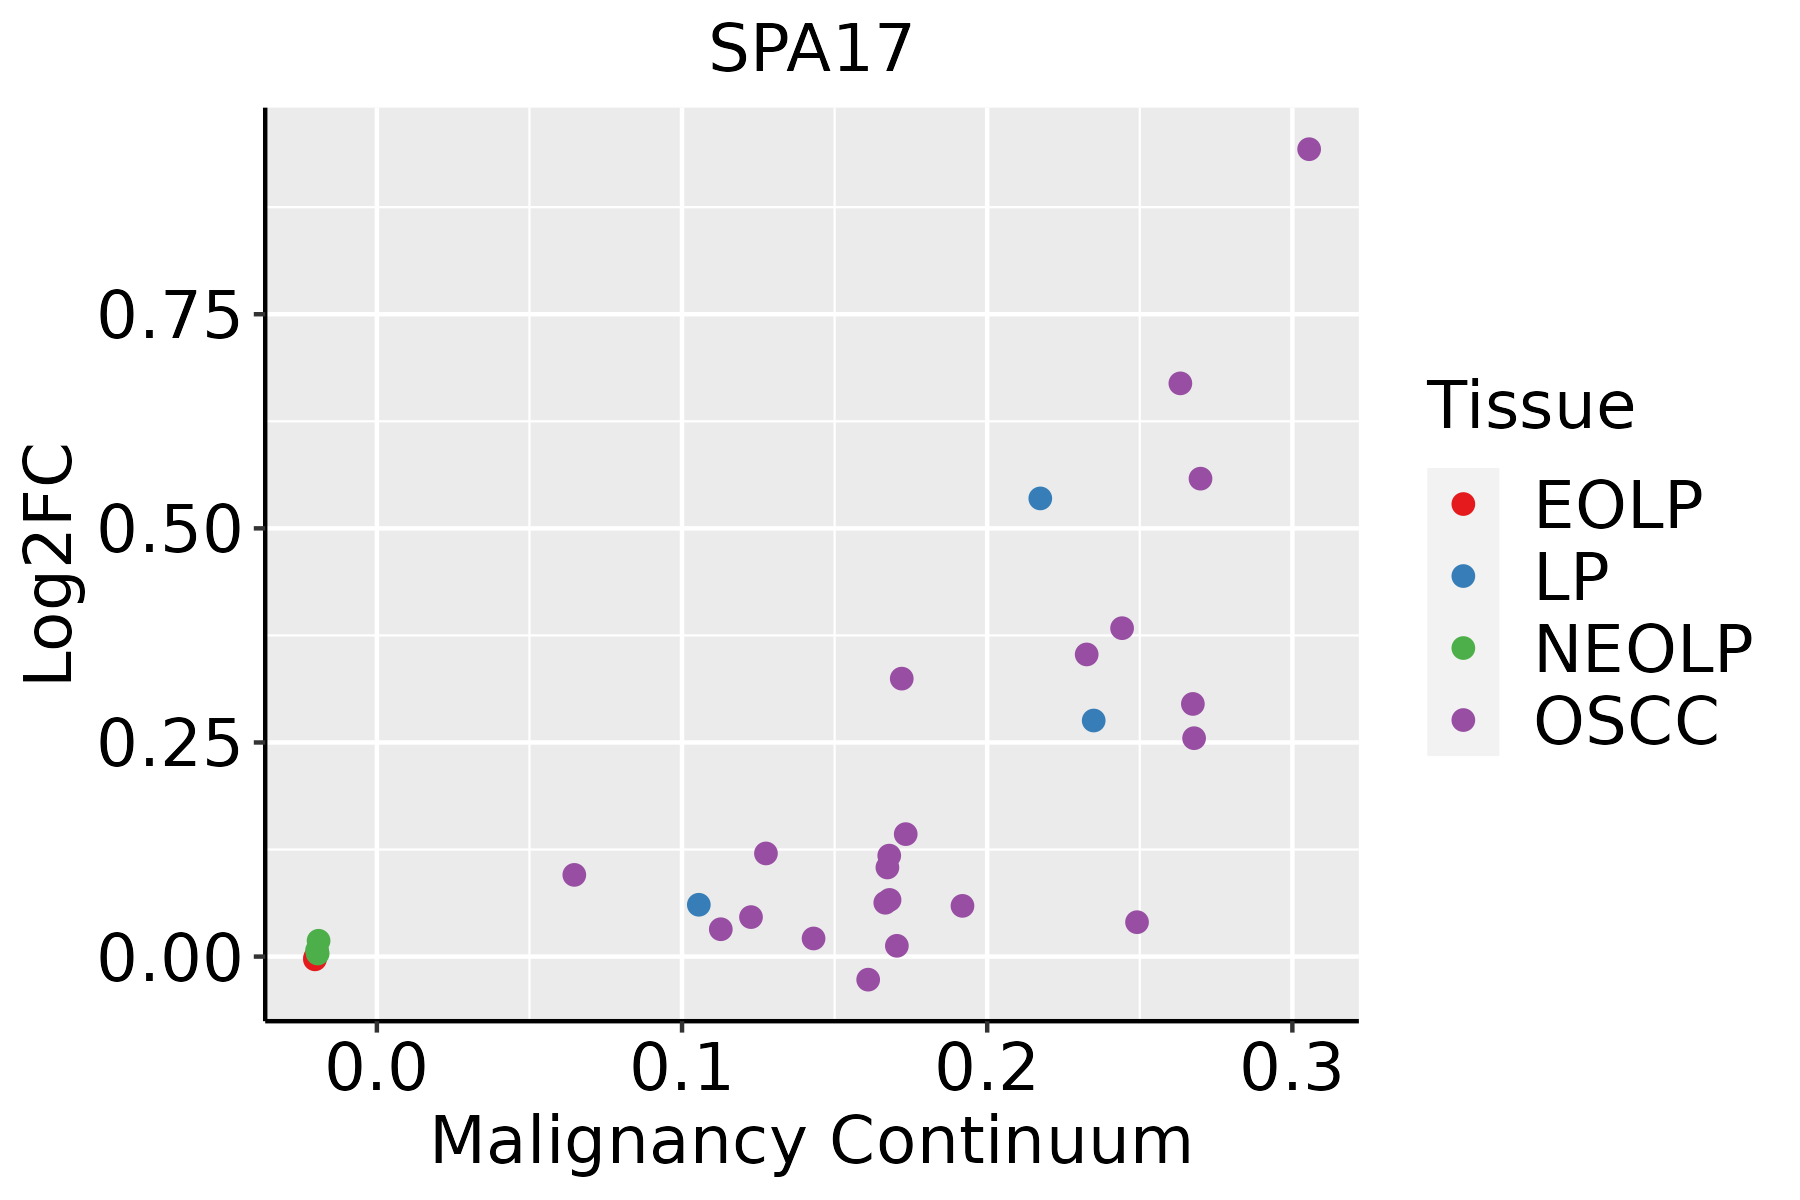 | EOLP: Erosive Oral lichen planus |
| LP: leukoplakia | ||
| NEOLP: Non-erosive oral lichen planus | ||
| OSCC: Oral squamous cell carcinoma |
| ∗log2FC in expression of this searched gene in stem-like cells from each diseased tissue sample relative to stem-like cells in normal samples in each tissue plotted against the malignancy continuum. Samples are colored based on if they are from different disease stage. |
Top |
Malignant transformation related pathway analysis |
| Find out the enriched GO biological processes and KEGG pathways involved in transition from healthy to precancer to cancer |
| Tissue | Disease Stage | Enriched GO biological Processes |
| Colorectum | AD |  |
| Colorectum | SER |  |
| Colorectum | MSS |  |
| Colorectum | MSI-H |  |
| Colorectum | FAP |  |
| ∗Top 15 enriched GO BP terms are showed in the bar plot of each disease state in each tissue. Each row represents a significant GO biological process which is colored according to the -log10(p.adjust). |
| Page: 1 2 3 4 5 6 7 8 9 |
| GO ID | Tissue | Disease Stage | Description | Gene Ratio | Bg Ratio | pvalue | p.adjust | Count |
| GO:00991114 | Esophagus | ESCC | microtubule-based transport | 115/8552 | 190/18723 | 2.54e-05 | 2.15e-04 | 115 |
| GO:00991113 | Oral cavity | OSCC | microtubule-based transport | 96/7305 | 190/18723 | 7.92e-04 | 4.27e-03 | 96 |
| Page: 1 |
| Pathway ID | Tissue | Disease Stage | Description | Gene Ratio | Bg Ratio | pvalue | p.adjust | qvalue | Count |
| Page: 1 |
Top |
Cell-cell communication analysis |
| Identification of potential cell-cell interactions between two cell types and their ligand-receptor pairs for different disease states |
| Ligand | Receptor | LRpair | Pathway | Tissue | Disease Stage |
| Page: 1 |
Top |
Single-cell gene regulatory network inference analysis |
| Find out the significant the regulons (TFs) and the target genes of each regulon across cell types for different disease states |
| TF | Cell Type | Tissue | Disease Stage | Target Gene | RSS | Regulon Activity |
| ∗The dot plots of a searched regulon are shown for all cell subpopulations in each disease state of each tissue based on the regulon specific score inferred using pySCENIC and by calculating the average expression. |
| Page: 1 |
Top |
Somatic mutation of malignant transformation related genes |
| Annotation of somatic variants for genes involved in malignant transformation |
| Hugo Symbol | Variant Class | Variant Classification | dbSNP RS | HGVSc | HGVSp | HGVSp Short | SWISSPROT | BIOTYPE | SIFT | PolyPhen | Tumor Sample Barcode | Tissue | Histology | Sex | Age | Stage | Therapy Types | Drugs | Outcome |
| SPA17 | SNV | Missense_Mutation | c.380N>A | p.Gly127Glu | p.G127E | Q15506 | protein_coding | deleterious(0) | probably_damaging(1) | TCGA-B6-A0RS-01 | Breast | breast invasive carcinoma | Female | <65 | I/II | Unknown | Unknown | PD | |
| SPA17 | SNV | Missense_Mutation | c.199N>T | p.Arg67Cys | p.R67C | Q15506 | protein_coding | deleterious(0) | probably_damaging(0.999) | TCGA-C5-A7CG-01 | Cervix | cervical & endocervical cancer | Female | <65 | I/II | Unknown | Unknown | SD | |
| SPA17 | SNV | Missense_Mutation | rs866901613 | c.5C>T | p.Ser2Leu | p.S2L | Q15506 | protein_coding | deleterious(0) | possibly_damaging(0.588) | TCGA-AZ-4315-01 | Colorectum | colon adenocarcinoma | Male | <65 | I/II | Unknown | Unknown | SD |
| SPA17 | SNV | Missense_Mutation | rs866901613 | c.5N>T | p.Ser2Leu | p.S2L | Q15506 | protein_coding | deleterious(0) | possibly_damaging(0.588) | TCGA-A5-A0GP-01 | Endometrium | uterine corpus endometrioid carcinoma | Female | <65 | I/II | Unknown | Unknown | SD |
| SPA17 | SNV | Missense_Mutation | rs866901613 | c.5N>T | p.Ser2Leu | p.S2L | Q15506 | protein_coding | deleterious(0) | possibly_damaging(0.588) | TCGA-A5-A2K5-01 | Endometrium | uterine corpus endometrioid carcinoma | Female | >=65 | I/II | Unknown | Unknown | SD |
| SPA17 | SNV | Missense_Mutation | rs866901613 | c.5C>T | p.Ser2Leu | p.S2L | Q15506 | protein_coding | deleterious(0) | possibly_damaging(0.588) | TCGA-AJ-A3EL-01 | Endometrium | uterine corpus endometrioid carcinoma | Female | <65 | I/II | Unknown | Unknown | SD |
| SPA17 | SNV | Missense_Mutation | novel | c.250N>T | p.Asp84Tyr | p.D84Y | Q15506 | protein_coding | deleterious(0.02) | benign(0.135) | TCGA-AP-A1E0-01 | Endometrium | uterine corpus endometrioid carcinoma | Female | <65 | III/IV | Chemotherapy | paclitaxel | SD |
| SPA17 | SNV | Missense_Mutation | c.223N>C | p.Glu75Gln | p.E75Q | Q15506 | protein_coding | tolerated(0.45) | benign(0.003) | TCGA-05-5428-01 | Lung | lung adenocarcinoma | Male | <65 | I/II | Chemotherapy | cisplatin | CR | |
| SPA17 | SNV | Missense_Mutation | c.224N>C | p.Glu75Ala | p.E75A | Q15506 | protein_coding | deleterious(0.03) | benign(0.024) | TCGA-05-5428-01 | Lung | lung adenocarcinoma | Male | <65 | I/II | Chemotherapy | cisplatin | CR | |
| SPA17 | SNV | Missense_Mutation | novel | c.422N>A | p.Ser141Asn | p.S141N | Q15506 | protein_coding | tolerated(0.42) | benign(0.039) | TCGA-CV-A6JE-01 | Oral cavity | head & neck squamous cell carcinoma | Male | >=65 | I/II | Unknown | Unknown | SD |
| Page: 1 2 |
Top |
Related drugs of malignant transformation related genes |
| Identification of chemicals and drugs interact with genes involved in malignant transfromation |
| (DGIdb 4.0) |
| Entrez ID | Symbol | Category | Interaction Types | Drug Claim Name | Drug Name | PMIDs |
| Page: 1 |

Copyright 2023-Present -The University of Texas Health Science Center at Houston |