
|
|||||
|
 | |
| |
| |
| |
| |
| |
|
Gene: SP140L |
Gene summary for SP140L |
| Gene information | Species | Human | Gene symbol | SP140L | Gene ID | 93349 |
| Gene name | SP140 nuclear body protein like | |
| Gene Alias | SP140L | |
| Cytomap | 2q37.1 | |
| Gene Type | protein-coding | GO ID | GO:0006139 | UniProtAcc | U5Y3L1 |
Top |
Malignant transformation analysis |
| Identification of the aberrant gene expression in precancerous and cancerous lesions by comparing the gene expression of stem-like cells in diseased tissues with normal stem cells |
| Entrez ID | Symbol | Replicates | Species | Organ | Tissue | Adj P-value | Log2FC | Malignancy |
| 93349 | SP140L | LZE4T | Human | Esophagus | ESCC | 6.72e-17 | 3.40e-01 | 0.0811 |
| 93349 | SP140L | LZE5T | Human | Esophagus | ESCC | 9.01e-08 | 3.40e-01 | 0.0514 |
| 93349 | SP140L | LZE8T | Human | Esophagus | ESCC | 9.14e-14 | 3.18e-01 | 0.067 |
| 93349 | SP140L | LZE20T | Human | Esophagus | ESCC | 9.42e-13 | 3.41e-01 | 0.0662 |
| 93349 | SP140L | LZE22D1 | Human | Esophagus | HGIN | 1.80e-02 | 9.44e-02 | 0.0595 |
| 93349 | SP140L | LZE22T | Human | Esophagus | ESCC | 6.42e-06 | 3.40e-01 | 0.068 |
| 93349 | SP140L | LZE24T | Human | Esophagus | ESCC | 7.25e-29 | 6.05e-01 | 0.0596 |
| 93349 | SP140L | LZE21T | Human | Esophagus | ESCC | 1.78e-04 | 2.51e-01 | 0.0655 |
| 93349 | SP140L | LZE6T | Human | Esophagus | ESCC | 6.96e-10 | 3.61e-01 | 0.0845 |
| 93349 | SP140L | P1T-E | Human | Esophagus | ESCC | 5.28e-26 | 7.65e-01 | 0.0875 |
| 93349 | SP140L | P2T-E | Human | Esophagus | ESCC | 5.20e-14 | 2.57e-01 | 0.1177 |
| 93349 | SP140L | P4T-E | Human | Esophagus | ESCC | 7.22e-13 | 2.55e-01 | 0.1323 |
| 93349 | SP140L | P5T-E | Human | Esophagus | ESCC | 3.76e-02 | 9.73e-02 | 0.1327 |
| 93349 | SP140L | P8T-E | Human | Esophagus | ESCC | 6.48e-34 | 5.79e-01 | 0.0889 |
| 93349 | SP140L | P9T-E | Human | Esophagus | ESCC | 1.67e-07 | 5.21e-02 | 0.1131 |
| 93349 | SP140L | P11T-E | Human | Esophagus | ESCC | 5.77e-17 | 6.25e-01 | 0.1426 |
| 93349 | SP140L | P12T-E | Human | Esophagus | ESCC | 1.80e-14 | 3.05e-01 | 0.1122 |
| 93349 | SP140L | P15T-E | Human | Esophagus | ESCC | 5.69e-24 | 4.32e-01 | 0.1149 |
| 93349 | SP140L | P17T-E | Human | Esophagus | ESCC | 1.30e-11 | 3.66e-01 | 0.1278 |
| 93349 | SP140L | P19T-E | Human | Esophagus | ESCC | 3.40e-13 | 3.85e-01 | 0.1662 |
| Page: 1 2 3 4 5 6 |
| Tissue | Expression Dynamics | Abbreviation |
| Esophagus | 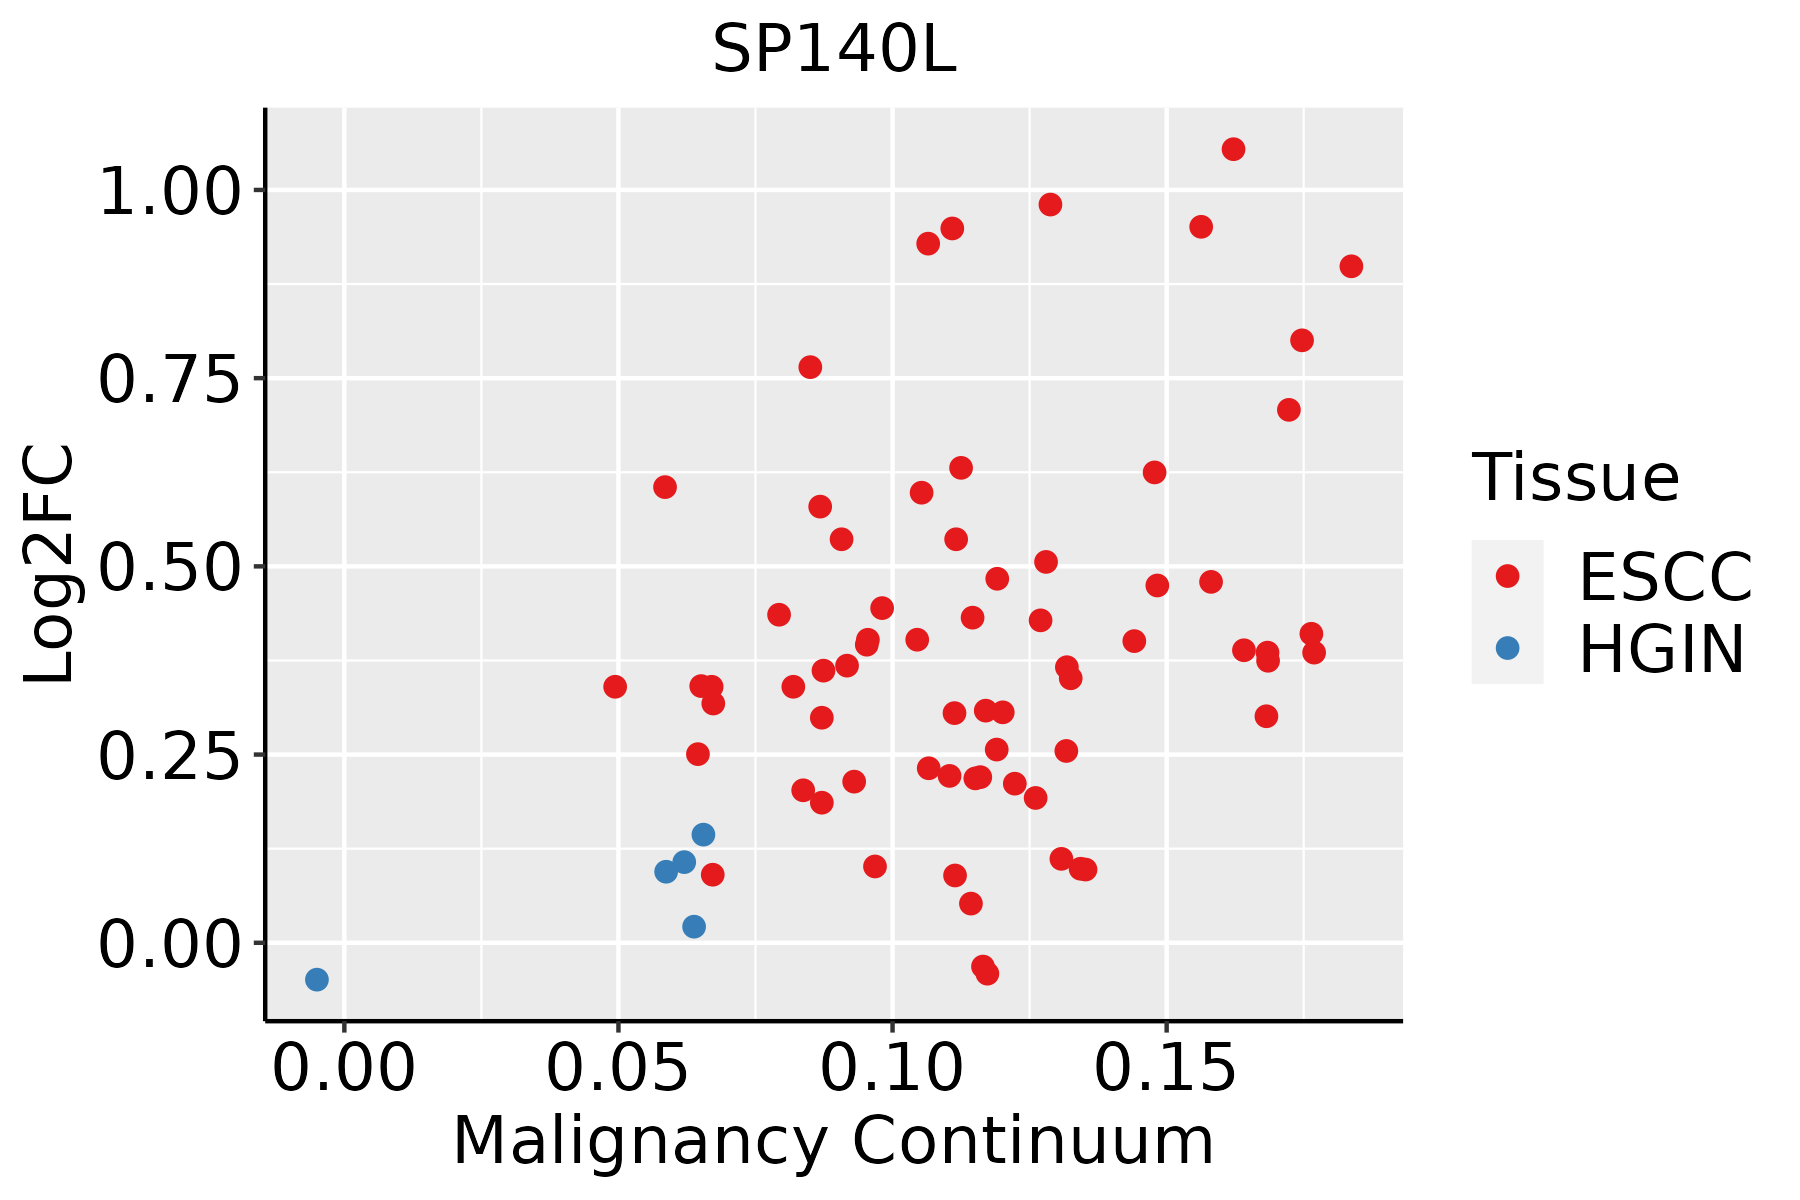 | ESCC: Esophageal squamous cell carcinoma |
| HGIN: High-grade intraepithelial neoplasias | ||
| LGIN: Low-grade intraepithelial neoplasias | ||
| Liver | 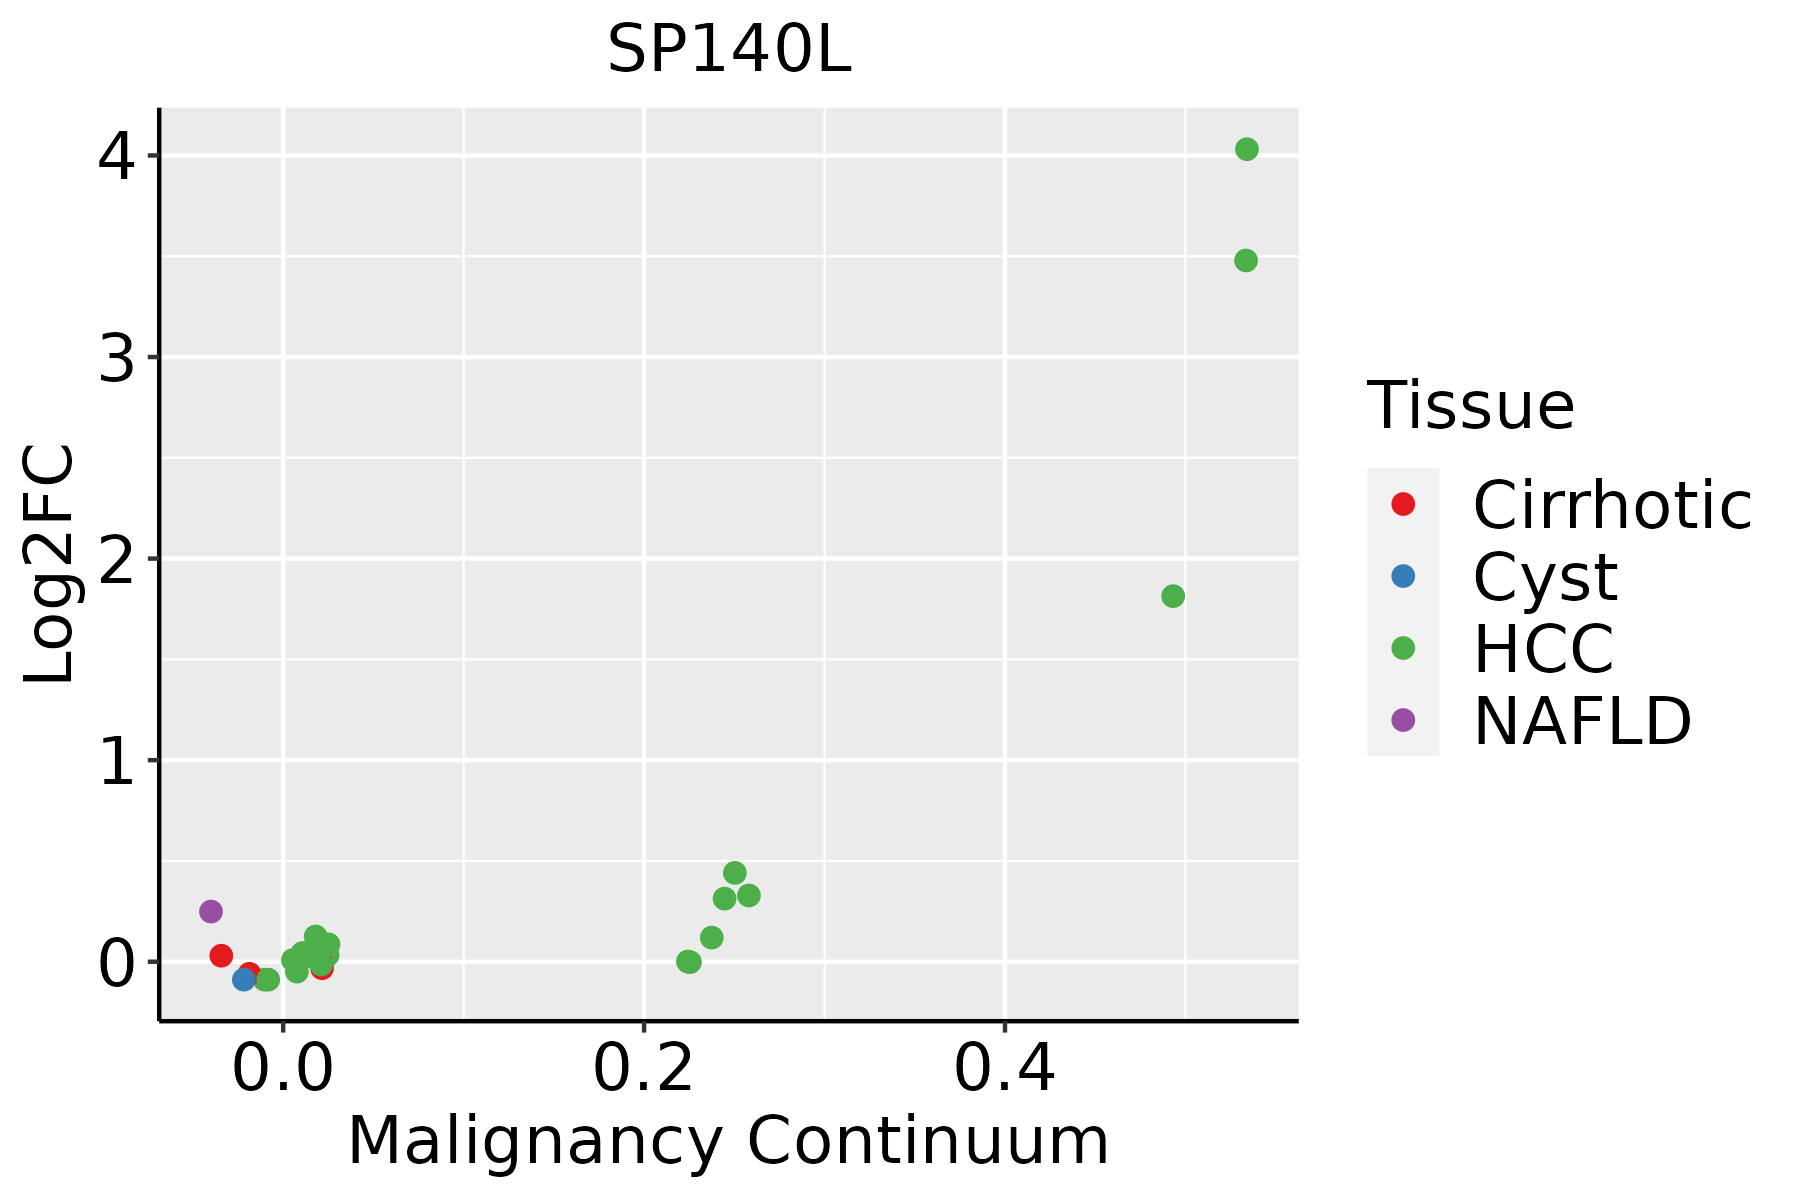 | HCC: Hepatocellular carcinoma |
| NAFLD: Non-alcoholic fatty liver disease | ||
| Oral Cavity | 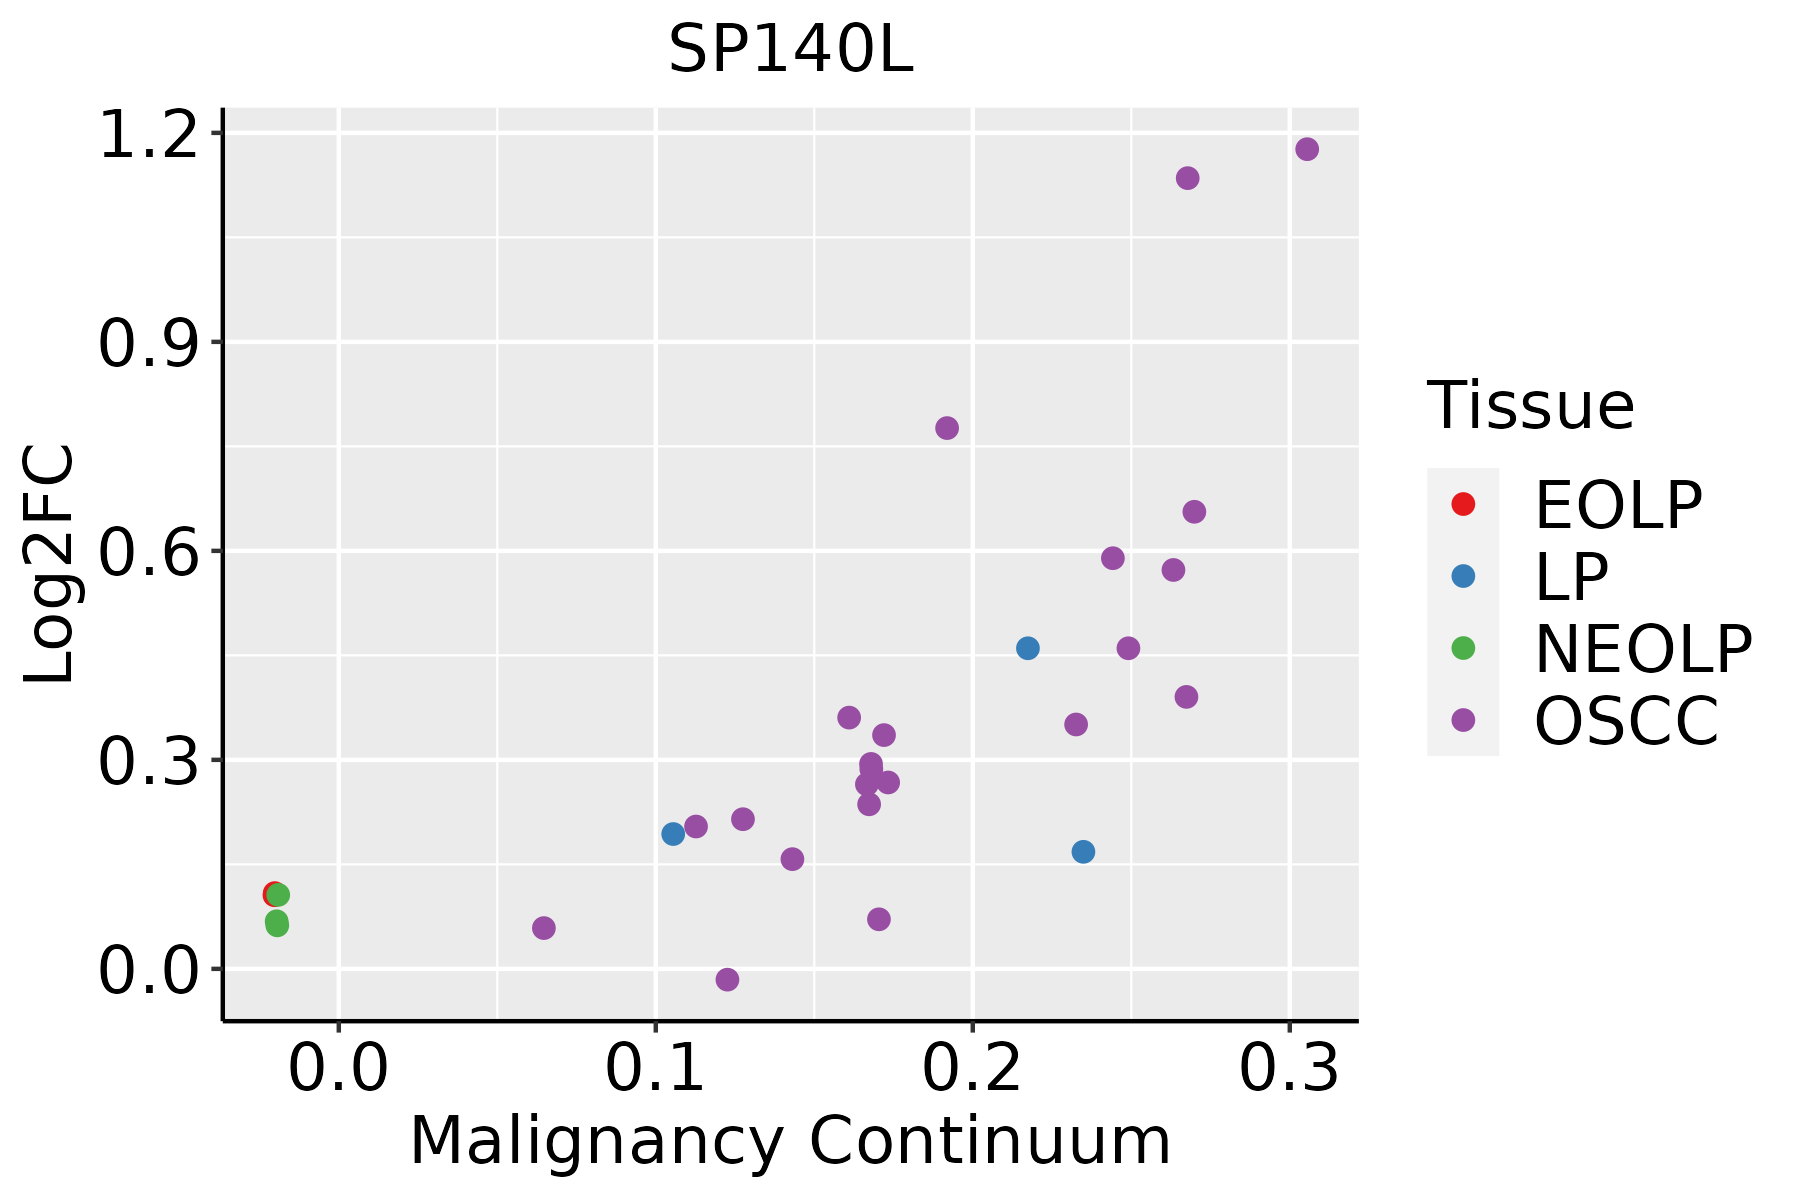 | EOLP: Erosive Oral lichen planus |
| LP: leukoplakia | ||
| NEOLP: Non-erosive oral lichen planus | ||
| OSCC: Oral squamous cell carcinoma | ||
| Thyroid | 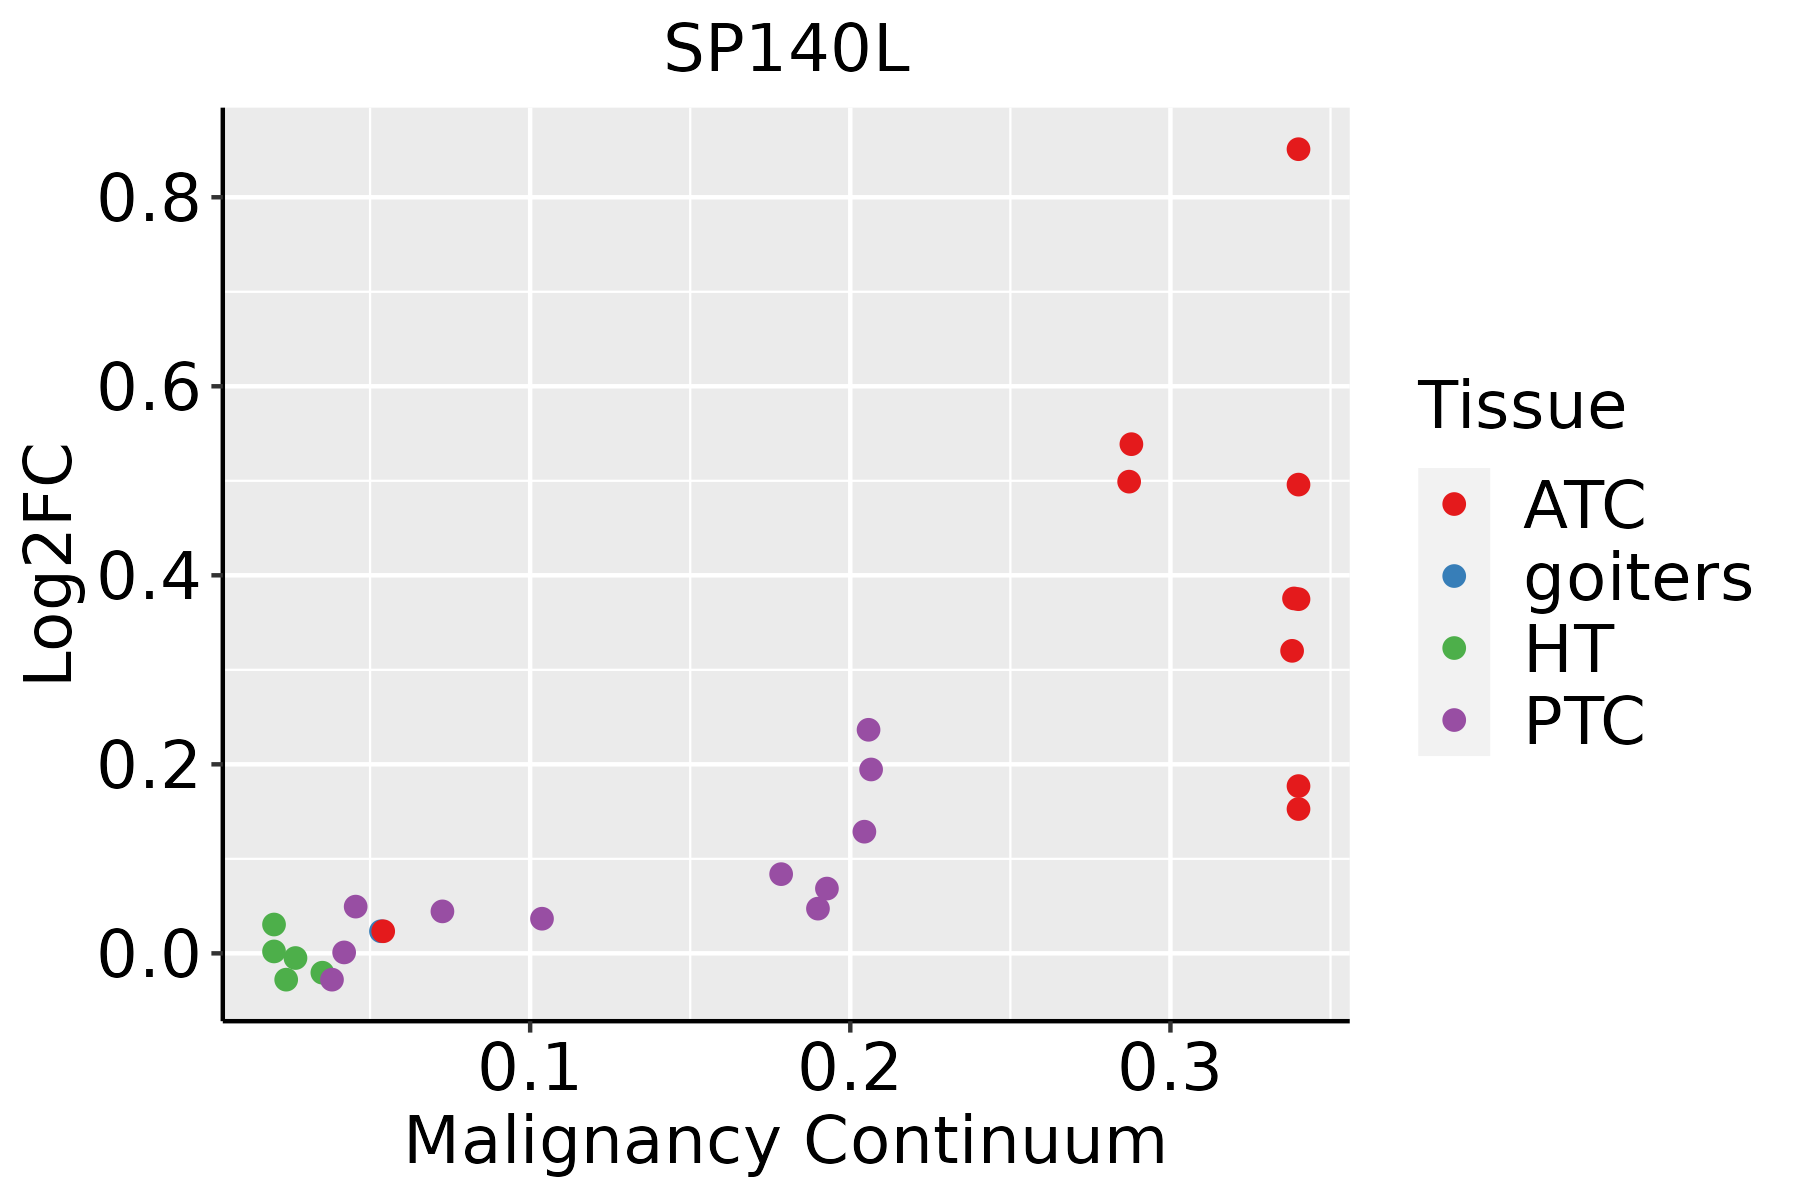 | ATC: Anaplastic thyroid cancer |
| HT: Hashimoto's thyroiditis | ||
| PTC: Papillary thyroid cancer |
| ∗log2FC in expression of this searched gene in stem-like cells from each diseased tissue sample relative to stem-like cells in normal samples in each tissue plotted against the malignancy continuum. Samples are colored based on if they are from different disease stage. |
Top |
Malignant transformation related pathway analysis |
| Find out the enriched GO biological processes and KEGG pathways involved in transition from healthy to precancer to cancer |
| Tissue | Disease Stage | Enriched GO biological Processes |
| Colorectum | AD |  |
| Colorectum | SER |  |
| Colorectum | MSS |  |
| Colorectum | MSI-H |  |
| Colorectum | FAP |  |
| ∗Top 15 enriched GO BP terms are showed in the bar plot of each disease state in each tissue. Each row represents a significant GO biological process which is colored according to the -log10(p.adjust). |
| Page: 1 2 3 4 5 6 7 8 9 |
| GO ID | Tissue | Disease Stage | Description | Gene Ratio | Bg Ratio | pvalue | p.adjust | Count |
| Page: 1 |
| Pathway ID | Tissue | Disease Stage | Description | Gene Ratio | Bg Ratio | pvalue | p.adjust | qvalue | Count |
| Page: 1 |
Top |
Cell-cell communication analysis |
| Identification of potential cell-cell interactions between two cell types and their ligand-receptor pairs for different disease states |
| Ligand | Receptor | LRpair | Pathway | Tissue | Disease Stage |
| Page: 1 |
Top |
Single-cell gene regulatory network inference analysis |
| Find out the significant the regulons (TFs) and the target genes of each regulon across cell types for different disease states |
| TF | Cell Type | Tissue | Disease Stage | Target Gene | RSS | Regulon Activity |
| ∗The dot plots of a searched regulon are shown for all cell subpopulations in each disease state of each tissue based on the regulon specific score inferred using pySCENIC and by calculating the average expression. |
| Page: 1 |
Top |
Somatic mutation of malignant transformation related genes |
| Annotation of somatic variants for genes involved in malignant transformation |
| Hugo Symbol | Variant Class | Variant Classification | dbSNP RS | HGVSc | HGVSp | HGVSp Short | SWISSPROT | BIOTYPE | SIFT | PolyPhen | Tumor Sample Barcode | Tissue | Histology | Sex | Age | Stage | Therapy Types | Drugs | Outcome |
| SP140L | SNV | Missense_Mutation | novel | c.1408N>T | p.Pro470Ser | p.P470S | Q9H930 | protein_coding | deleterious(0.03) | possibly_damaging(0.661) | TCGA-BH-A0H3-01 | Breast | breast invasive carcinoma | Female | <65 | I/II | Unknown | Unknown | SD |
| SP140L | insertion | Frame_Shift_Ins | novel | c.515_516insCACTCTGTTGCCCAGGTTAGATGGCAGGCTAGTGAGCTATCTC | p.Lys173ThrfsTer15 | p.K173Tfs*15 | Q9H930 | protein_coding | TCGA-A8-A07R-01 | Breast | breast invasive carcinoma | Female | >=65 | III/IV | Ancillary | zoledronic | SD | ||
| SP140L | insertion | Frame_Shift_Ins | novel | c.812_813insATAT | p.His271GlnfsTer7 | p.H271Qfs*7 | Q9H930 | protein_coding | TCGA-A8-A0A4-01 | Breast | breast invasive carcinoma | Female | >=65 | I/II | Hormone Therapy | tamoxiphen | CR | ||
| SP140L | insertion | Frame_Shift_Ins | novel | c.814_815insCCCAATTTCCAGTACAGAATATTATCCA | p.Phe272SerfsTer14 | p.F272Sfs*14 | Q9H930 | protein_coding | TCGA-A8-A0A4-01 | Breast | breast invasive carcinoma | Female | >=65 | I/II | Hormone Therapy | tamoxiphen | CR | ||
| SP140L | insertion | Nonsense_Mutation | novel | c.1486_1487insTCTAA | p.Pro496LeufsTer2 | p.P496Lfs*2 | Q9H930 | protein_coding | TCGA-AC-A3QQ-01 | Breast | breast invasive carcinoma | Female | <65 | I/II | Unknown | Unknown | SD | ||
| SP140L | SNV | Missense_Mutation | rs561322588 | c.165G>T | p.Lys55Asn | p.K55N | Q9H930 | protein_coding | tolerated(0.12) | benign(0.095) | TCGA-2W-A8YY-01 | Cervix | cervical & endocervical cancer | Female | <65 | I/II | Chemotherapy | cisplatin | CR |
| SP140L | SNV | Missense_Mutation | novel | c.176N>A | p.Arg59Lys | p.R59K | Q9H930 | protein_coding | tolerated(0.56) | benign(0.007) | TCGA-C5-A1BQ-01 | Cervix | cervical & endocervical cancer | Female | >=65 | III/IV | Chemotherapy | cisplatin | CR |
| SP140L | SNV | Missense_Mutation | rs756373352 | c.43N>A | p.Gly15Arg | p.G15R | Q9H930 | protein_coding | tolerated_low_confidence(0.17) | benign(0.248) | TCGA-A6-2672-01 | Colorectum | colon adenocarcinoma | Female | >=65 | III/IV | Unknown | Unknown | SD |
| SP140L | SNV | Missense_Mutation | rs766920483 | c.281N>T | p.Asp94Val | p.D94V | Q9H930 | protein_coding | deleterious(0) | possibly_damaging(0.907) | TCGA-AA-3715-01 | Colorectum | colon adenocarcinoma | Male | >=65 | I/II | Unknown | Unknown | PD |
| SP140L | SNV | Missense_Mutation | novel | c.754N>G | p.Met252Val | p.M252V | Q9H930 | protein_coding | tolerated(0.87) | benign(0) | TCGA-AA-3870-01 | Colorectum | colon adenocarcinoma | Female | >=65 | III/IV | Chemotherapy | folinic | CR |
| Page: 1 2 3 4 5 6 7 8 |
Top |
Related drugs of malignant transformation related genes |
| Identification of chemicals and drugs interact with genes involved in malignant transfromation |
| (DGIdb 4.0) |
| Entrez ID | Symbol | Category | Interaction Types | Drug Claim Name | Drug Name | PMIDs |
| Page: 1 |

Copyright 2023-Present -The University of Texas Health Science Center at Houston |