
|
|||||
|
 | |
| |
| |
| |
| |
| |
|
Gene: SP140 |
Gene summary for SP140 |
| Gene information | Species | Human | Gene symbol | SP140 | Gene ID | 11262 |
| Gene name | SP140 nuclear body protein | |
| Gene Alias | LYSP100 | |
| Cytomap | 2q37.1 | |
| Gene Type | protein-coding | GO ID | GO:0006139 | UniProtAcc | B4DVW8 |
Top |
Malignant transformation analysis |
| Identification of the aberrant gene expression in precancerous and cancerous lesions by comparing the gene expression of stem-like cells in diseased tissues with normal stem cells |
| Entrez ID | Symbol | Replicates | Species | Organ | Tissue | Adj P-value | Log2FC | Malignancy |
| 11262 | SP140 | LZE4T | Human | Esophagus | ESCC | 2.92e-03 | 3.21e-01 | 0.0811 |
| 11262 | SP140 | LZE6T | Human | Esophagus | ESCC | 3.33e-05 | 3.20e-01 | 0.0845 |
| 11262 | SP140 | P22T-E | Human | Esophagus | ESCC | 1.62e-13 | 2.36e-01 | 0.1236 |
| 11262 | SP140 | P47T-E | Human | Esophagus | ESCC | 5.79e-16 | 2.75e-01 | 0.1067 |
| 11262 | SP140 | P52T-E | Human | Esophagus | ESCC | 1.35e-23 | 6.78e-01 | 0.1555 |
| 11262 | SP140 | P80T-E | Human | Esophagus | ESCC | 1.83e-19 | 6.20e-01 | 0.155 |
| 11262 | SP140 | HCC1_Meng | Human | Liver | HCC | 3.46e-02 | 1.92e-02 | 0.0246 |
| 11262 | SP140 | HCC5 | Human | Liver | HCC | 4.83e-09 | 1.61e+00 | 0.4932 |
| 11262 | SP140 | S028 | Human | Liver | HCC | 1.88e-11 | 4.79e-01 | 0.2503 |
| 11262 | SP140 | S029 | Human | Liver | HCC | 1.85e-14 | 6.00e-01 | 0.2581 |
| Page: 1 |
| Tissue | Expression Dynamics | Abbreviation |
| Esophagus |  | ESCC: Esophageal squamous cell carcinoma |
| HGIN: High-grade intraepithelial neoplasias | ||
| LGIN: Low-grade intraepithelial neoplasias | ||
| Liver | 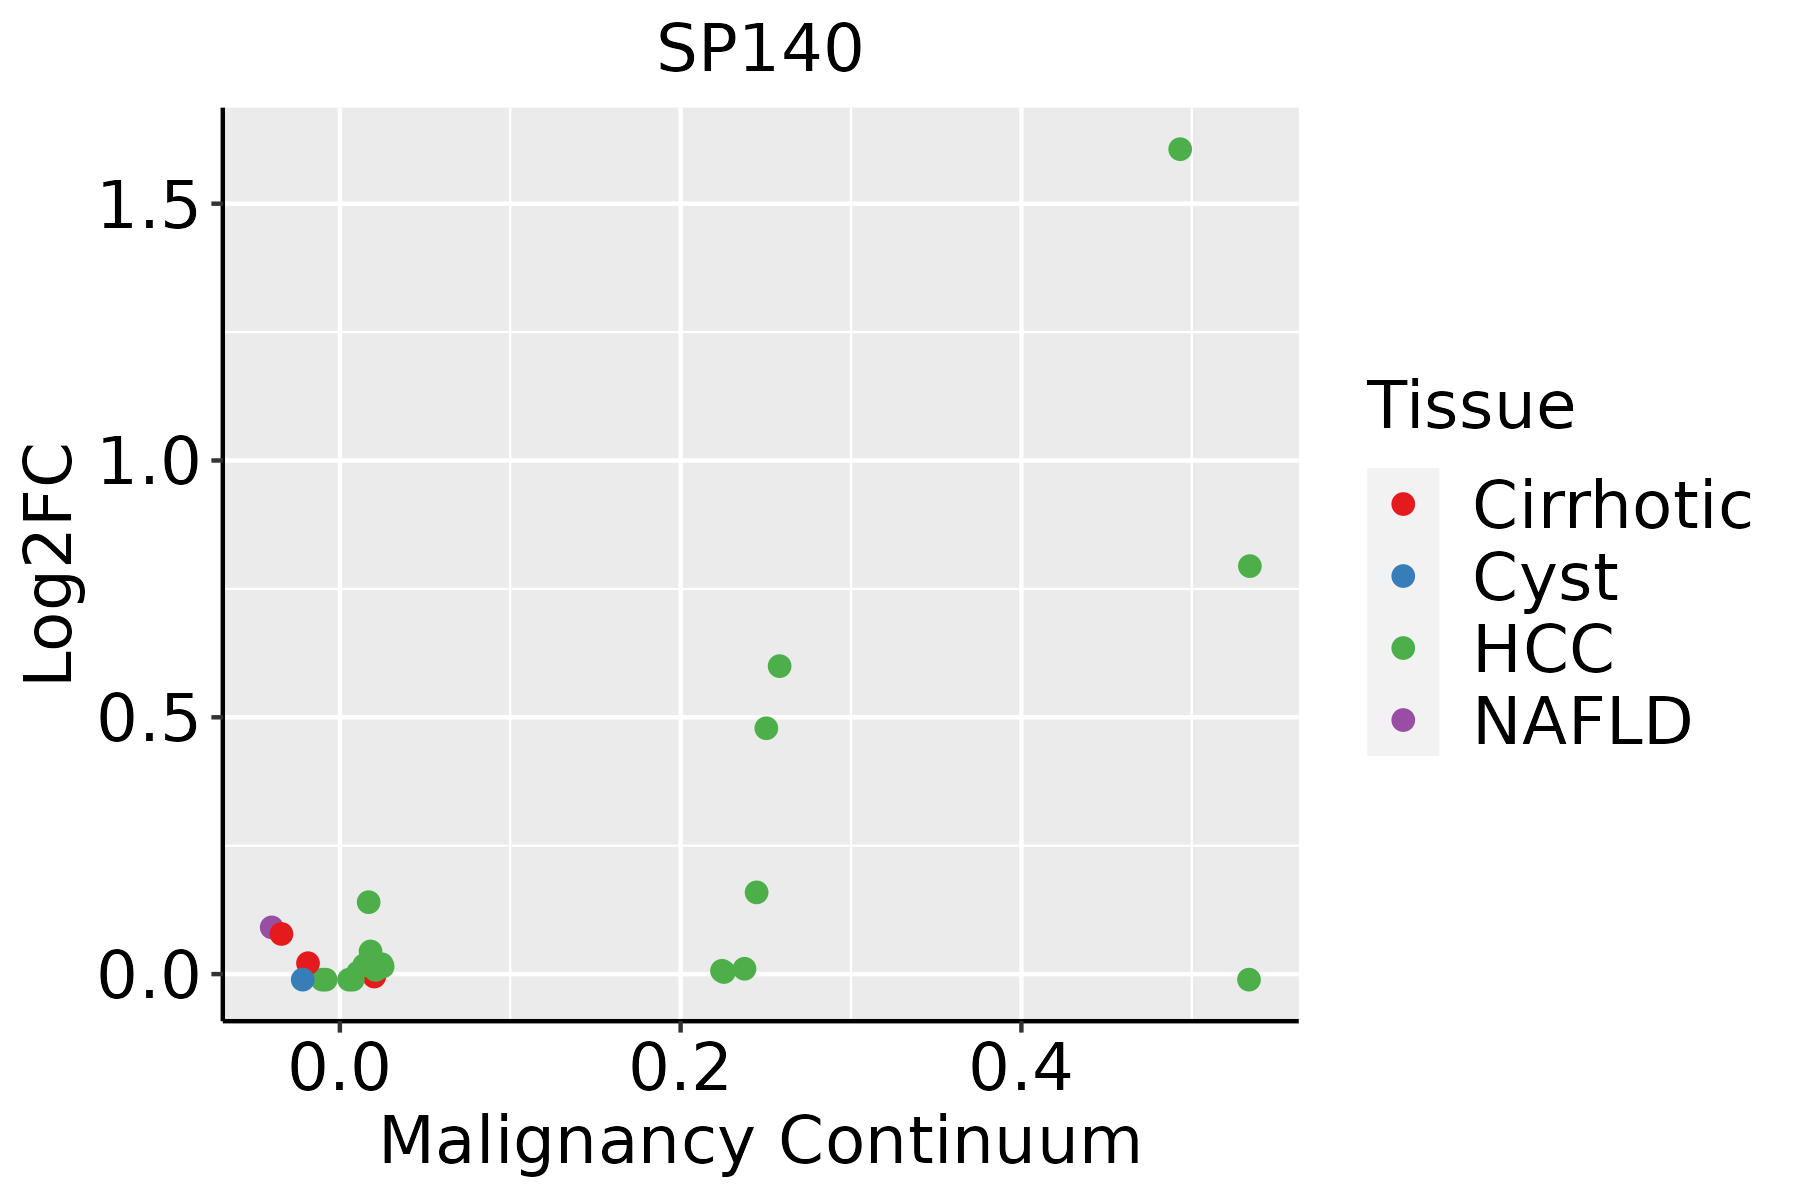 | HCC: Hepatocellular carcinoma |
| NAFLD: Non-alcoholic fatty liver disease |
| ∗log2FC in expression of this searched gene in stem-like cells from each diseased tissue sample relative to stem-like cells in normal samples in each tissue plotted against the malignancy continuum. Samples are colored based on if they are from different disease stage. |
Top |
Malignant transformation related pathway analysis |
| Find out the enriched GO biological processes and KEGG pathways involved in transition from healthy to precancer to cancer |
| Tissue | Disease Stage | Enriched GO biological Processes |
| Colorectum | AD |  |
| Colorectum | SER |  |
| Colorectum | MSS |  |
| Colorectum | MSI-H |  |
| Colorectum | FAP |  |
| ∗Top 15 enriched GO BP terms are showed in the bar plot of each disease state in each tissue. Each row represents a significant GO biological process which is colored according to the -log10(p.adjust). |
| Page: 1 2 3 4 5 6 7 8 9 |
| GO ID | Tissue | Disease Stage | Description | Gene Ratio | Bg Ratio | pvalue | p.adjust | Count |
| Page: 1 |
| Pathway ID | Tissue | Disease Stage | Description | Gene Ratio | Bg Ratio | pvalue | p.adjust | qvalue | Count |
| Page: 1 |
Top |
Cell-cell communication analysis |
| Identification of potential cell-cell interactions between two cell types and their ligand-receptor pairs for different disease states |
| Ligand | Receptor | LRpair | Pathway | Tissue | Disease Stage |
| Page: 1 |
Top |
Single-cell gene regulatory network inference analysis |
| Find out the significant the regulons (TFs) and the target genes of each regulon across cell types for different disease states |
| TF | Cell Type | Tissue | Disease Stage | Target Gene | RSS | Regulon Activity |
| ∗The dot plots of a searched regulon are shown for all cell subpopulations in each disease state of each tissue based on the regulon specific score inferred using pySCENIC and by calculating the average expression. |
| Page: 1 |
Top |
Somatic mutation of malignant transformation related genes |
| Annotation of somatic variants for genes involved in malignant transformation |
| Hugo Symbol | Variant Class | Variant Classification | dbSNP RS | HGVSc | HGVSp | HGVSp Short | SWISSPROT | BIOTYPE | SIFT | PolyPhen | Tumor Sample Barcode | Tissue | Histology | Sex | Age | Stage | Therapy Types | Drugs | Outcome |
| SP140 | SNV | Missense_Mutation | novel | c.546G>C | p.Leu182Phe | p.L182F | Q13342 | protein_coding | tolerated(0.05) | benign(0.082) | TCGA-5L-AAT1-01 | Breast | breast invasive carcinoma | Female | <65 | III/IV | Hormone Therapy | letrozol | SD |
| SP140 | SNV | Missense_Mutation | novel | c.1727N>T | p.Arg576Ile | p.R576I | Q13342 | protein_coding | deleterious(0) | benign(0.425) | TCGA-AN-A046-01 | Breast | breast invasive carcinoma | Female | >=65 | I/II | Unknown | Unknown | SD |
| SP140 | SNV | Missense_Mutation | c.998A>G | p.Glu333Gly | p.E333G | Q13342 | protein_coding | deleterious(0.04) | benign(0.001) | TCGA-AR-A1AT-01 | Breast | breast invasive carcinoma | Female | <65 | I/II | Hormone Therapy | anastrozole | SD | |
| SP140 | SNV | Missense_Mutation | rs763608665 | c.2471N>A | p.Arg824His | p.R824H | Q13342 | protein_coding | deleterious(0) | probably_damaging(0.976) | TCGA-BH-A0E2-01 | Breast | breast invasive carcinoma | Female | <65 | III/IV | Chemotherapy | doxorubicin | SD |
| SP140 | SNV | Missense_Mutation | c.22N>C | p.Gly8Arg | p.G8R | Q13342 | protein_coding | tolerated_low_confidence(0.36) | benign(0.001) | TCGA-E2-A2P5-01 | Breast | breast invasive carcinoma | Female | >=65 | III/IV | Hormone Therapy | arimidex | PD | |
| SP140 | insertion | Frame_Shift_Ins | novel | c.2373_2374insGCTGCCATGACAT | p.Cys792AlafsTer16 | p.C792Afs*16 | Q13342 | protein_coding | TCGA-A8-A08G-01 | Breast | breast invasive carcinoma | Female | <65 | I/II | Chemotherapy | 5-fluorouracil | CR | ||
| SP140 | insertion | Nonsense_Mutation | novel | c.852_853insTAGAAAATTTGTAT | p.Lys285Ter | p.K285* | Q13342 | protein_coding | TCGA-AR-A0U2-01 | Breast | breast invasive carcinoma | Female | <65 | III/IV | Hormone Therapy | tamoxiphen | PD | ||
| SP140 | SNV | Missense_Mutation | novel | c.548G>A | p.Ser183Asn | p.S183N | Q13342 | protein_coding | tolerated(0.16) | benign(0.379) | TCGA-2W-A8YY-01 | Cervix | cervical & endocervical cancer | Female | <65 | I/II | Chemotherapy | cisplatin | CR |
| SP140 | SNV | Missense_Mutation | novel | c.1760N>G | p.Ala587Gly | p.A587G | Q13342 | protein_coding | tolerated(0.09) | possibly_damaging(0.51) | TCGA-C5-A8ZZ-01 | Cervix | cervical & endocervical cancer | Female | <65 | I/II | Unspecific | Cisplatin | SD |
| SP140 | SNV | Missense_Mutation | c.772N>T | p.Ala258Ser | p.A258S | Q13342 | protein_coding | tolerated(0.76) | benign(0.009) | TCGA-A6-2677-01 | Colorectum | colon adenocarcinoma | Female | >=65 | III/IV | Ancillary | leucovorin | SD |
| Page: 1 2 3 4 5 6 7 8 9 10 11 12 13 14 15 16 |
Top |
Related drugs of malignant transformation related genes |
| Identification of chemicals and drugs interact with genes involved in malignant transfromation |
| (DGIdb 4.0) |
| Entrez ID | Symbol | Category | Interaction Types | Drug Claim Name | Drug Name | PMIDs |
| Page: 1 |

Copyright 2023-Present -The University of Texas Health Science Center at Houston |