
|
|||||
|
 | |
| |
| |
| |
| |
| |
|
Gene: SP100 |
Gene summary for SP100 |
| Gene information | Species | Human | Gene symbol | SP100 | Gene ID | 6672 |
| Gene name | SP100 nuclear antigen | |
| Gene Alias | lysp100b | |
| Cytomap | 2q37.1 | |
| Gene Type | protein-coding | GO ID | GO:0000122 | UniProtAcc | P23497 |
Top |
Malignant transformation analysis |
| Identification of the aberrant gene expression in precancerous and cancerous lesions by comparing the gene expression of stem-like cells in diseased tissues with normal stem cells |
| Entrez ID | Symbol | Replicates | Species | Organ | Tissue | Adj P-value | Log2FC | Malignancy |
| 6672 | SP100 | LZE4T | Human | Esophagus | ESCC | 1.96e-19 | 6.64e-01 | 0.0811 |
| 6672 | SP100 | LZE5T | Human | Esophagus | ESCC | 3.51e-08 | 6.57e-01 | 0.0514 |
| 6672 | SP100 | LZE8T | Human | Esophagus | ESCC | 5.55e-07 | 3.82e-01 | 0.067 |
| 6672 | SP100 | LZE20T | Human | Esophagus | ESCC | 7.49e-14 | 6.33e-01 | 0.0662 |
| 6672 | SP100 | LZE22T | Human | Esophagus | ESCC | 7.92e-03 | 2.29e-01 | 0.068 |
| 6672 | SP100 | LZE24T | Human | Esophagus | ESCC | 1.66e-42 | 1.42e+00 | 0.0596 |
| 6672 | SP100 | LZE21T | Human | Esophagus | ESCC | 1.64e-05 | 6.15e-01 | 0.0655 |
| 6672 | SP100 | LZE6T | Human | Esophagus | ESCC | 1.63e-10 | 6.02e-01 | 0.0845 |
| 6672 | SP100 | P1T-E | Human | Esophagus | ESCC | 1.44e-11 | 8.62e-01 | 0.0875 |
| 6672 | SP100 | P2T-E | Human | Esophagus | ESCC | 3.36e-44 | 7.82e-01 | 0.1177 |
| 6672 | SP100 | P4T-E | Human | Esophagus | ESCC | 1.58e-13 | 3.74e-01 | 0.1323 |
| 6672 | SP100 | P5T-E | Human | Esophagus | ESCC | 2.74e-27 | 5.41e-01 | 0.1327 |
| 6672 | SP100 | P8T-E | Human | Esophagus | ESCC | 5.37e-53 | 9.65e-01 | 0.0889 |
| 6672 | SP100 | P9T-E | Human | Esophagus | ESCC | 1.10e-30 | 8.88e-01 | 0.1131 |
| 6672 | SP100 | P10T-E | Human | Esophagus | ESCC | 2.25e-12 | 1.63e-01 | 0.116 |
| 6672 | SP100 | P11T-E | Human | Esophagus | ESCC | 1.78e-33 | 1.75e+00 | 0.1426 |
| 6672 | SP100 | P12T-E | Human | Esophagus | ESCC | 4.23e-25 | 5.12e-01 | 0.1122 |
| 6672 | SP100 | P15T-E | Human | Esophagus | ESCC | 3.00e-37 | 9.81e-01 | 0.1149 |
| 6672 | SP100 | P17T-E | Human | Esophagus | ESCC | 1.45e-17 | 1.11e+00 | 0.1278 |
| 6672 | SP100 | P19T-E | Human | Esophagus | ESCC | 7.44e-11 | 9.53e-01 | 0.1662 |
| Page: 1 2 3 4 5 6 7 8 |
| Tissue | Expression Dynamics | Abbreviation |
| Esophagus | 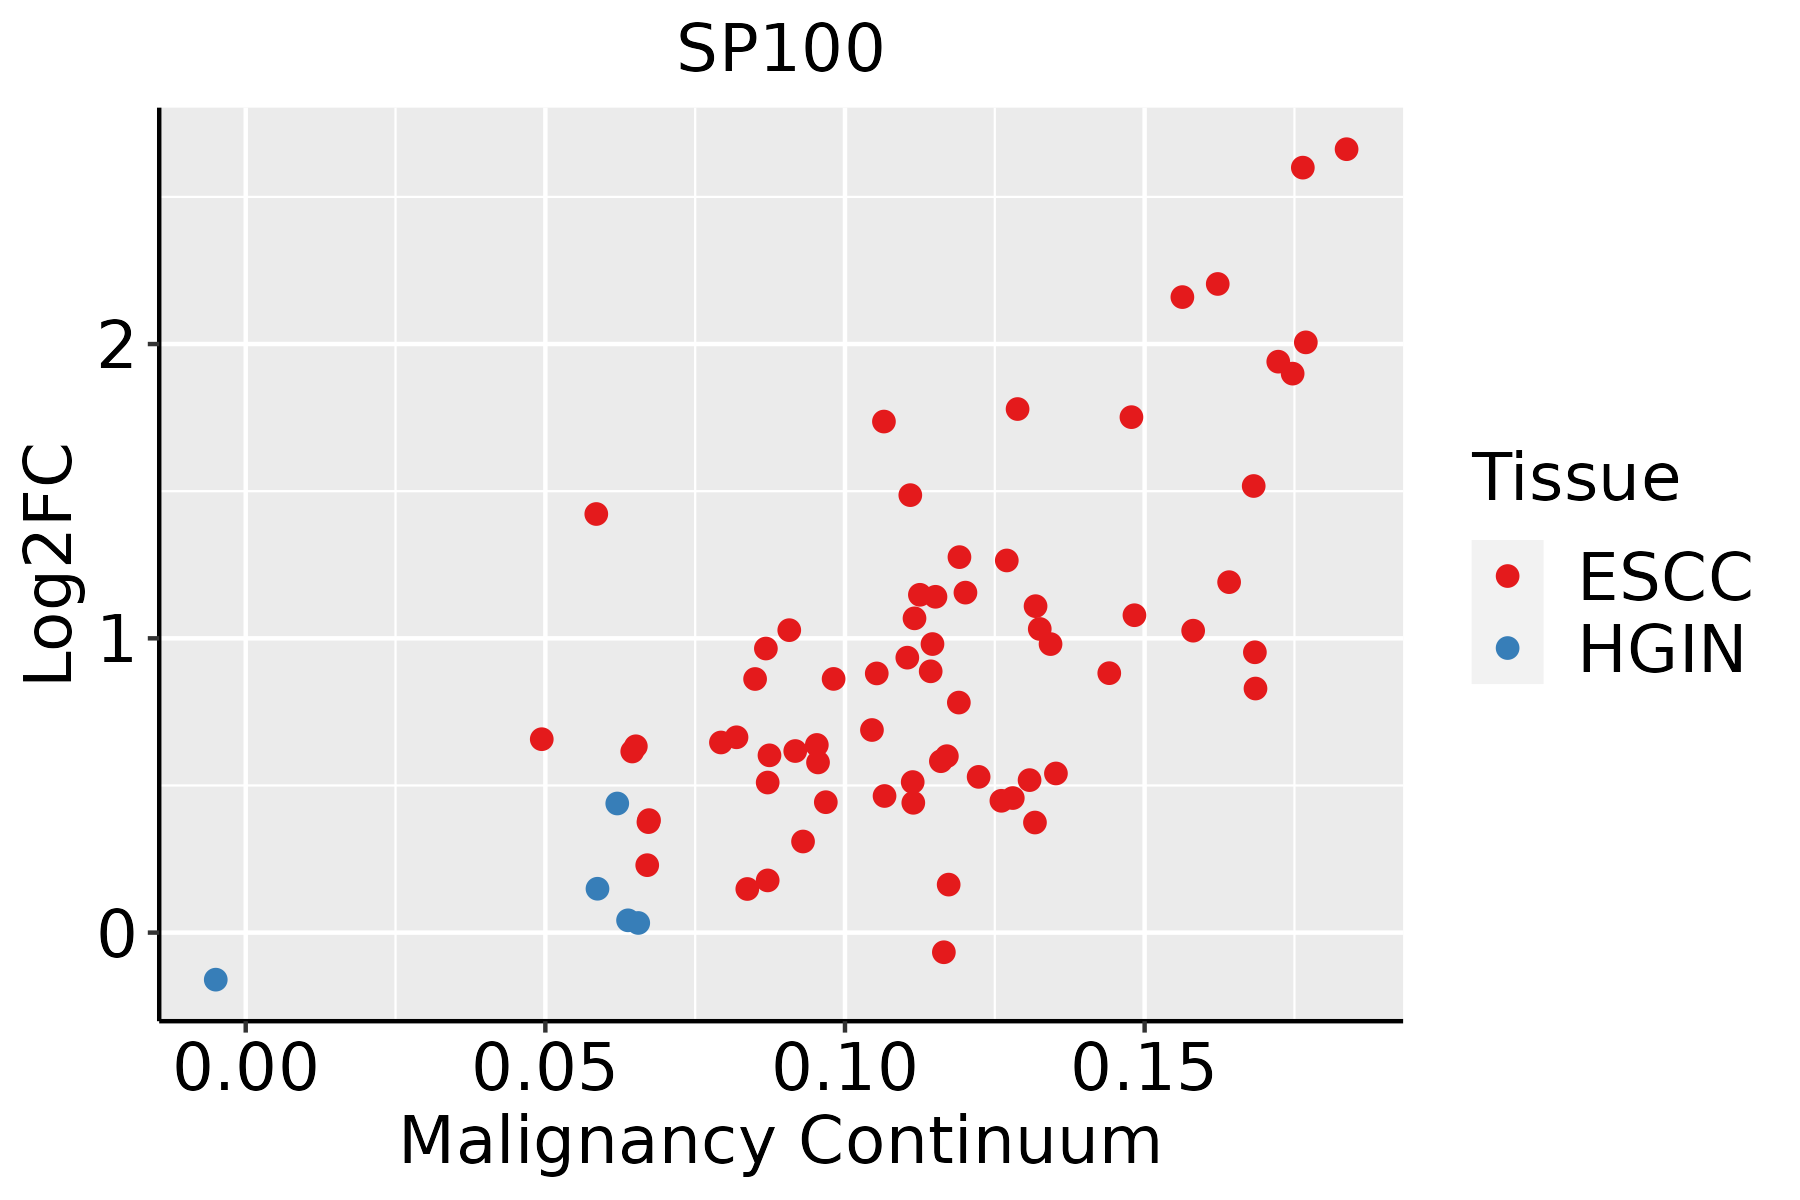 | ESCC: Esophageal squamous cell carcinoma |
| HGIN: High-grade intraepithelial neoplasias | ||
| LGIN: Low-grade intraepithelial neoplasias | ||
| Liver | 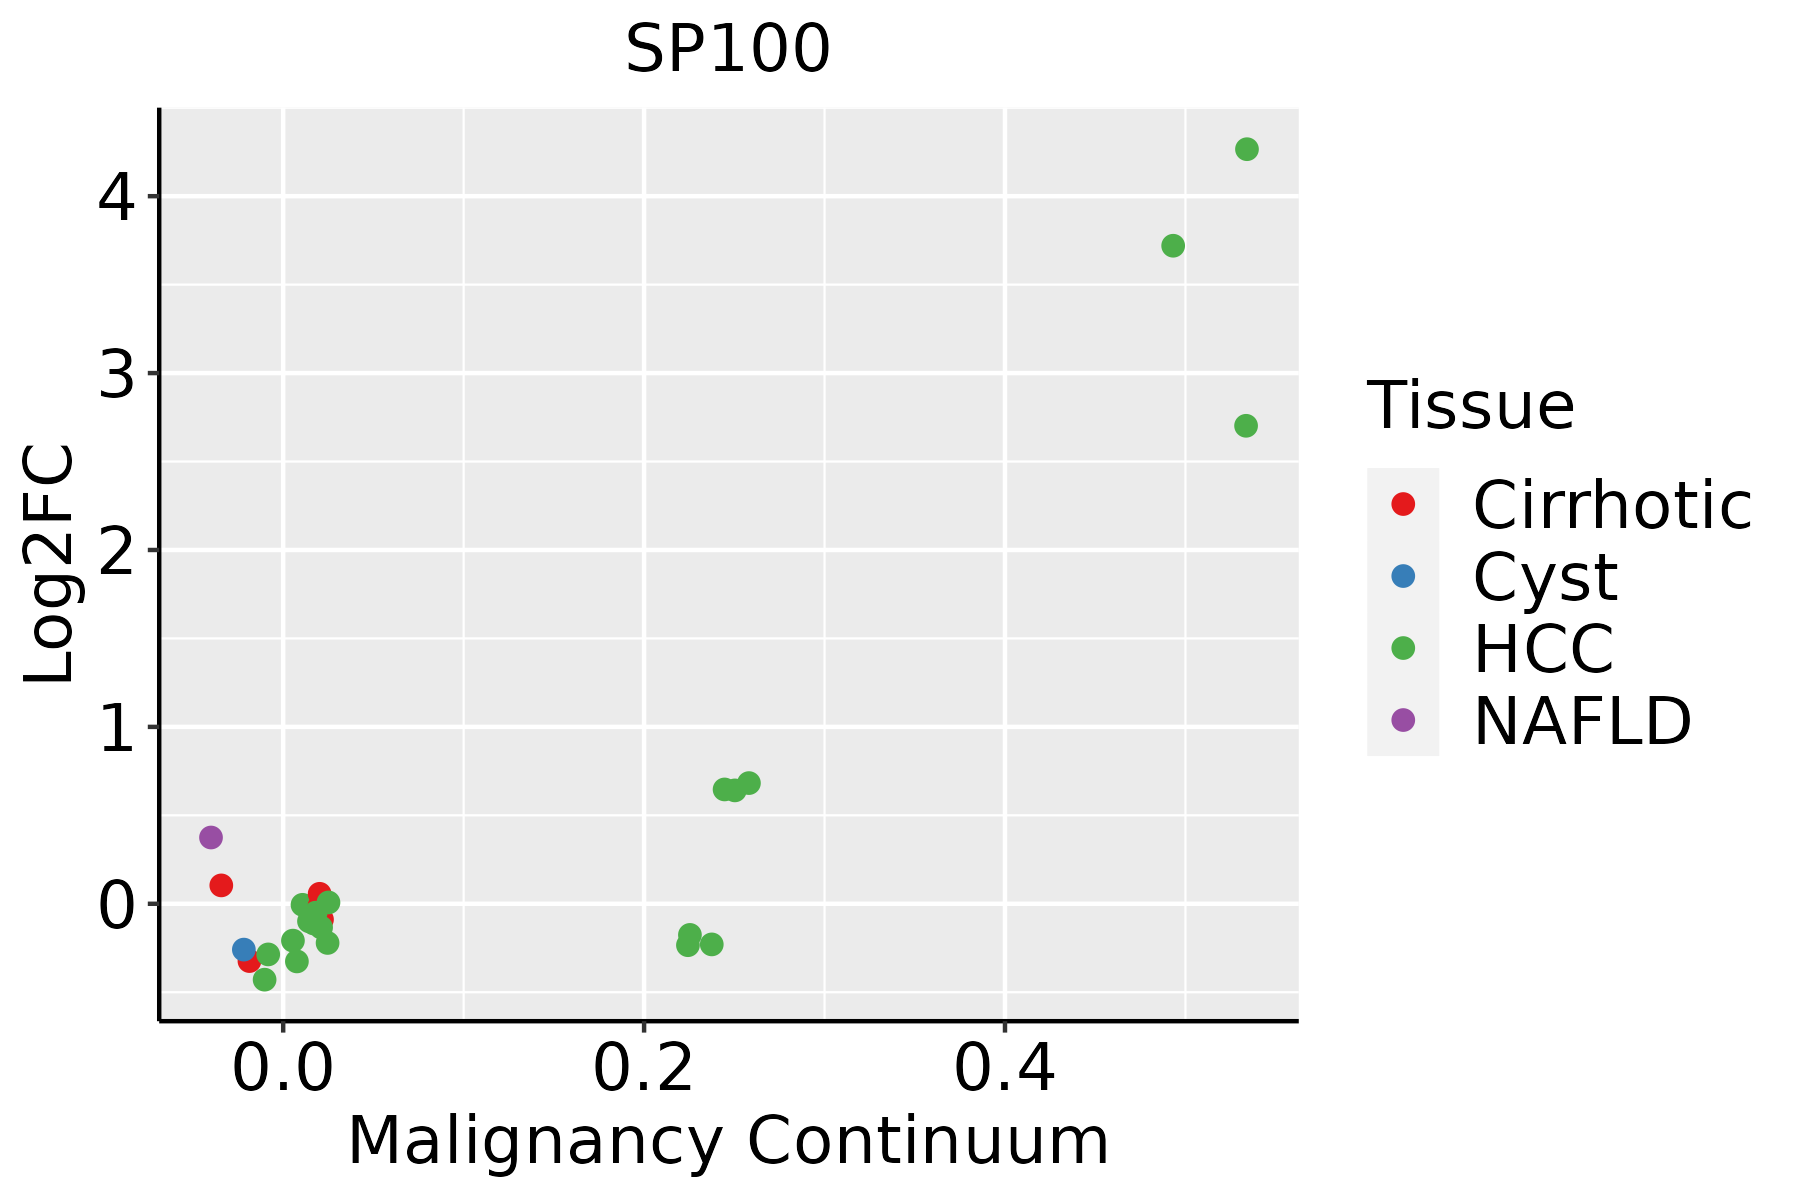 | HCC: Hepatocellular carcinoma |
| NAFLD: Non-alcoholic fatty liver disease | ||
| Lung | 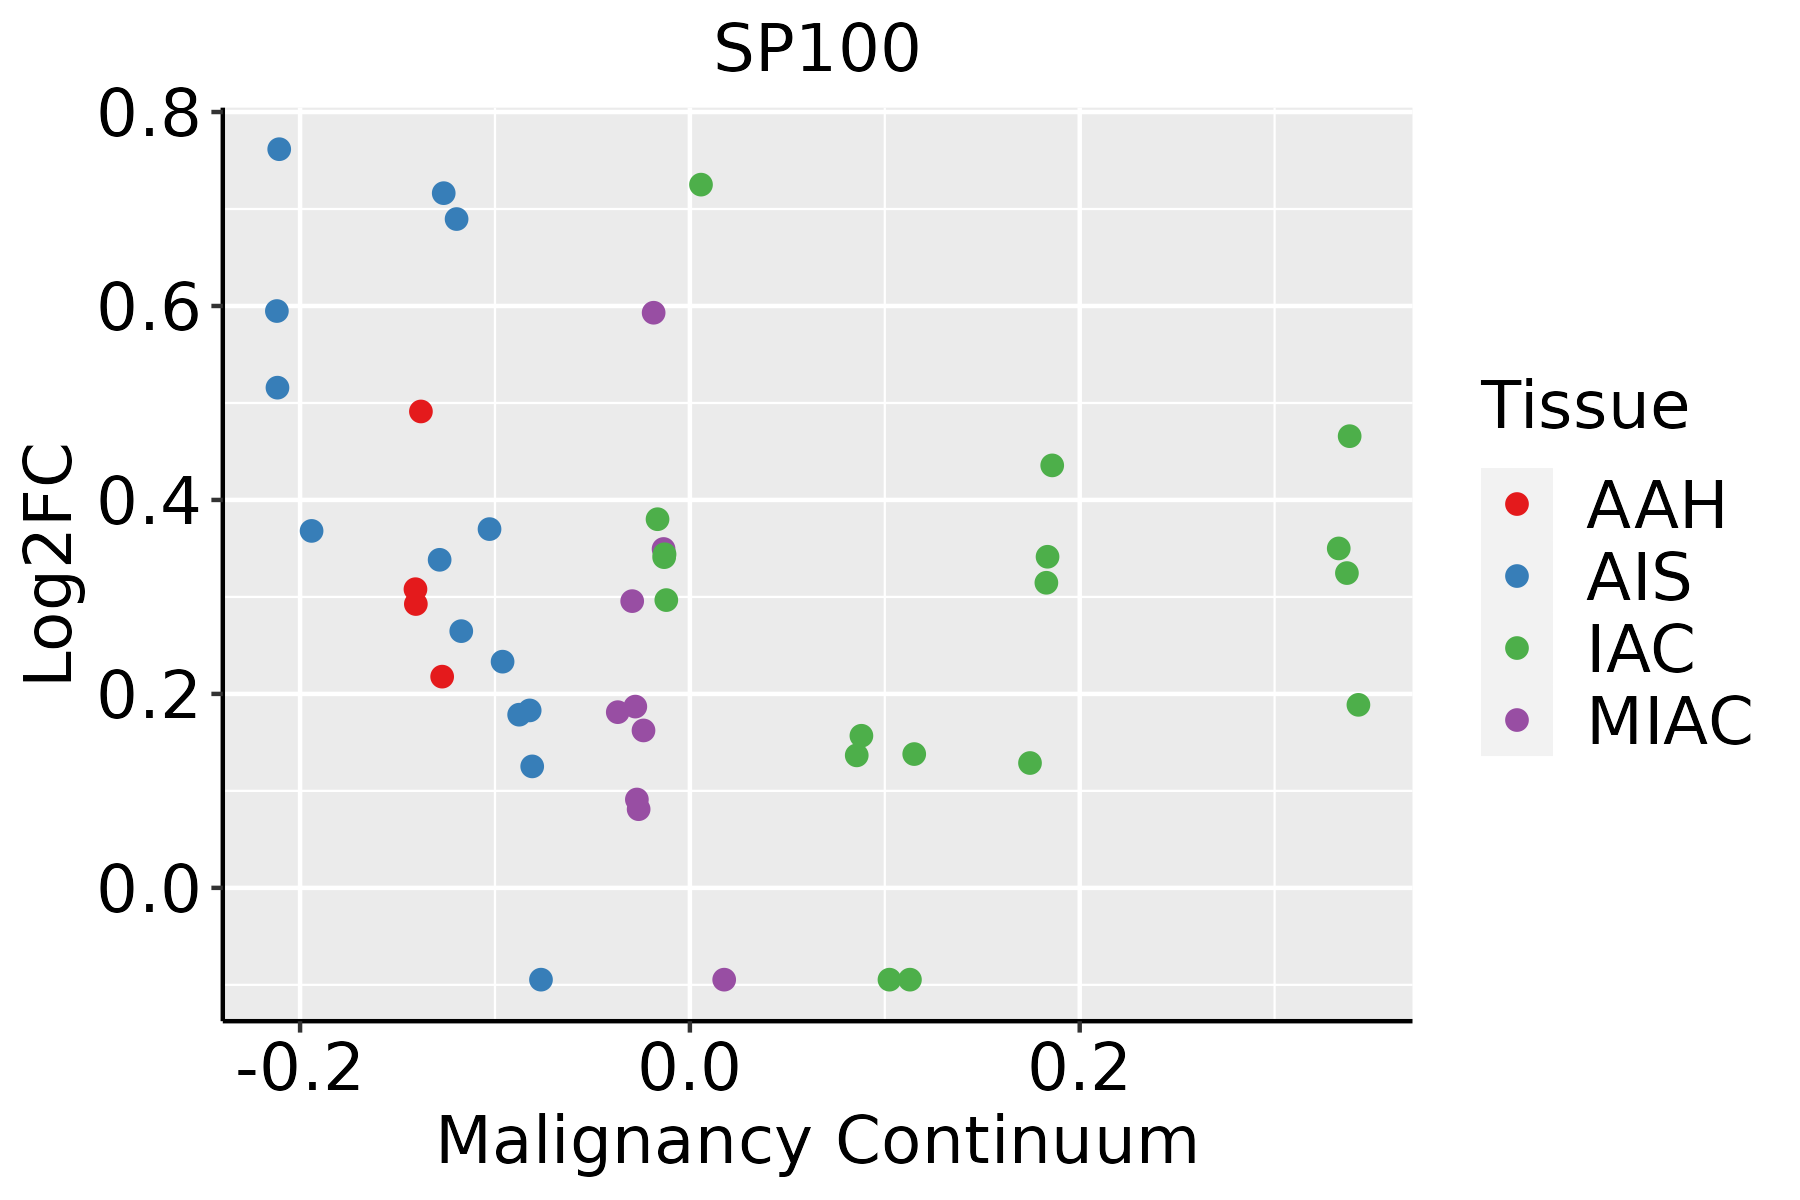 | AAH: Atypical adenomatous hyperplasia |
| AIS: Adenocarcinoma in situ | ||
| IAC: Invasive lung adenocarcinoma | ||
| MIA: Minimally invasive adenocarcinoma | ||
| Oral Cavity |  | EOLP: Erosive Oral lichen planus |
| LP: leukoplakia | ||
| NEOLP: Non-erosive oral lichen planus | ||
| OSCC: Oral squamous cell carcinoma | ||
| Prostate |  | BPH: Benign Prostatic Hyperplasia |
| Skin | 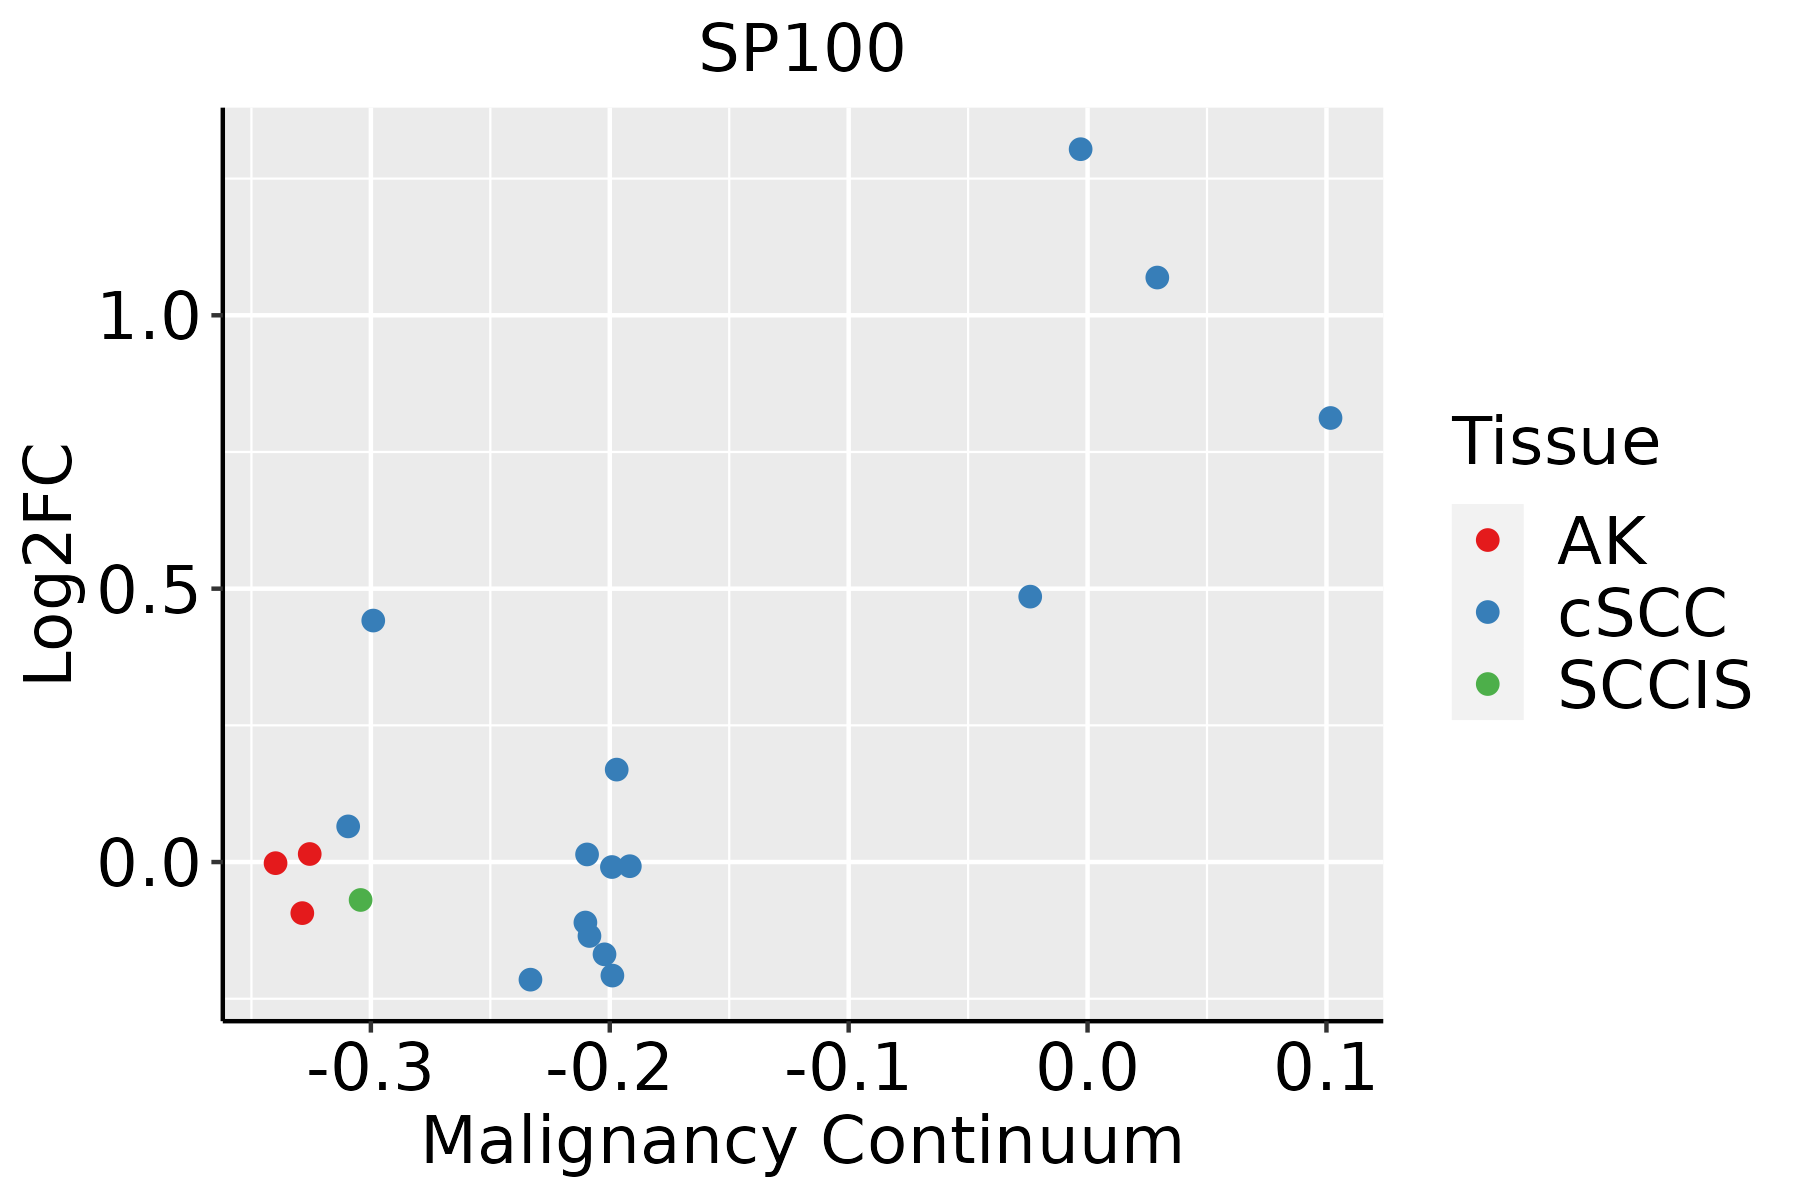 | AK: Actinic keratosis |
| cSCC: Cutaneous squamous cell carcinoma | ||
| SCCIS:squamous cell carcinoma in situ | ||
| Thyroid | 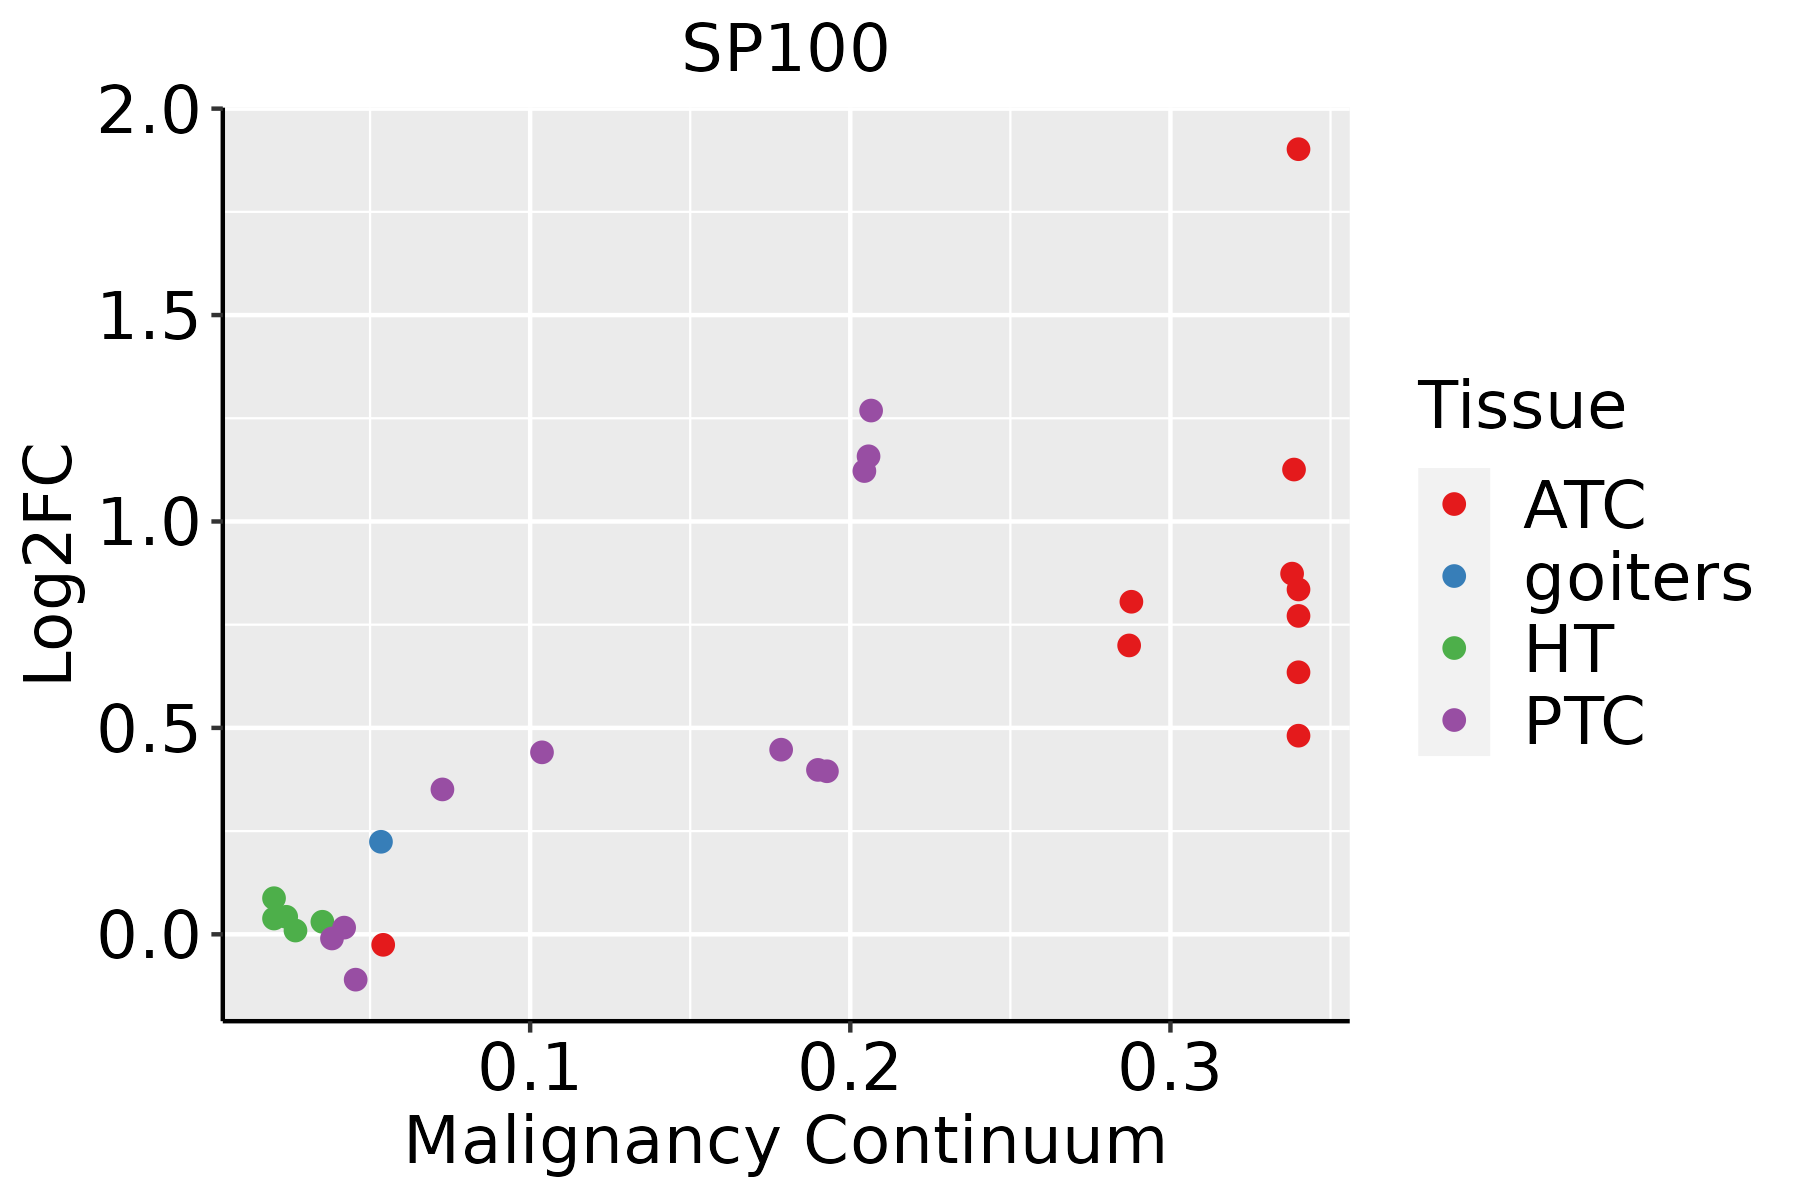 | ATC: Anaplastic thyroid cancer |
| HT: Hashimoto's thyroiditis | ||
| PTC: Papillary thyroid cancer |
| ∗log2FC in expression of this searched gene in stem-like cells from each diseased tissue sample relative to stem-like cells in normal samples in each tissue plotted against the malignancy continuum. Samples are colored based on if they are from different disease stage. |
Top |
Malignant transformation related pathway analysis |
| Find out the enriched GO biological processes and KEGG pathways involved in transition from healthy to precancer to cancer |
| Tissue | Disease Stage | Enriched GO biological Processes |
| Colorectum | AD |  |
| Colorectum | SER |  |
| Colorectum | MSS |  |
| Colorectum | MSI-H |  |
| Colorectum | FAP |  |
| ∗Top 15 enriched GO BP terms are showed in the bar plot of each disease state in each tissue. Each row represents a significant GO biological process which is colored according to the -log10(p.adjust). |
| Page: 1 2 3 4 5 6 7 8 9 |
| GO ID | Tissue | Disease Stage | Description | Gene Ratio | Bg Ratio | pvalue | p.adjust | Count |
| GO:0006913110 | Esophagus | ESCC | nucleocytoplasmic transport | 230/8552 | 301/18723 | 6.04e-28 | 2.02e-25 | 230 |
| GO:0051169110 | Esophagus | ESCC | nuclear transport | 230/8552 | 301/18723 | 6.04e-28 | 2.02e-25 | 230 |
| GO:2001233111 | Esophagus | ESCC | regulation of apoptotic signaling pathway | 256/8552 | 356/18723 | 4.11e-24 | 1.04e-21 | 256 |
| GO:003238618 | Esophagus | ESCC | regulation of intracellular transport | 243/8552 | 337/18723 | 3.20e-23 | 7.25e-21 | 243 |
| GO:003450418 | Esophagus | ESCC | protein localization to nucleus | 211/8552 | 290/18723 | 4.06e-21 | 6.60e-19 | 211 |
| GO:0051168110 | Esophagus | ESCC | nuclear export | 126/8552 | 154/18723 | 1.88e-20 | 2.65e-18 | 126 |
| GO:0051098111 | Esophagus | ESCC | regulation of binding | 251/8552 | 363/18723 | 6.73e-20 | 8.46e-18 | 251 |
| GO:0033157110 | Esophagus | ESCC | regulation of intracellular protein transport | 169/8552 | 229/18723 | 3.31e-18 | 3.23e-16 | 169 |
| GO:0097191111 | Esophagus | ESCC | extrinsic apoptotic signaling pathway | 159/8552 | 219/18723 | 4.12e-16 | 2.94e-14 | 159 |
| GO:0046822110 | Esophagus | ESCC | regulation of nucleocytoplasmic transport | 88/8552 | 106/18723 | 1.88e-15 | 1.19e-13 | 88 |
| GO:0072331111 | Esophagus | ESCC | signal transduction by p53 class mediator | 121/8552 | 163/18723 | 9.61e-14 | 4.69e-12 | 121 |
| GO:000072319 | Esophagus | ESCC | telomere maintenance | 99/8552 | 131/18723 | 2.68e-12 | 1.08e-10 | 99 |
| GO:2001236111 | Esophagus | ESCC | regulation of extrinsic apoptotic signaling pathway | 111/8552 | 151/18723 | 2.97e-12 | 1.18e-10 | 111 |
| GO:000661117 | Esophagus | ESCC | protein export from nucleus | 48/8552 | 57/18723 | 1.92e-09 | 4.39e-08 | 48 |
| GO:004277014 | Esophagus | ESCC | signal transduction in response to DNA damage | 117/8552 | 172/18723 | 2.38e-09 | 5.32e-08 | 117 |
| GO:0045185111 | Esophagus | ESCC | maintenance of protein location | 71/8552 | 94/18723 | 3.41e-09 | 7.24e-08 | 71 |
| GO:003434013 | Esophagus | ESCC | response to type I interferon | 48/8552 | 58/18723 | 6.18e-09 | 1.26e-07 | 48 |
| GO:0051235110 | Esophagus | ESCC | maintenance of location | 200/8552 | 327/18723 | 1.01e-08 | 2.02e-07 | 200 |
| GO:0032507110 | Esophagus | ESCC | maintenance of protein location in cell | 52/8552 | 65/18723 | 1.41e-08 | 2.77e-07 | 52 |
| GO:0051101111 | Esophagus | ESCC | regulation of DNA binding | 84/8552 | 118/18723 | 1.64e-08 | 3.21e-07 | 84 |
| Page: 1 2 3 4 5 6 7 8 9 10 11 12 13 14 15 16 17 18 19 20 21 22 23 24 25 26 27 28 29 30 31 32 33 34 |
| Pathway ID | Tissue | Disease Stage | Description | Gene Ratio | Bg Ratio | pvalue | p.adjust | qvalue | Count |
| hsa0520325 | Esophagus | ESCC | Viral carcinogenesis | 137/4205 | 204/8465 | 2.47e-07 | 1.88e-06 | 9.62e-07 | 137 |
| hsa0520335 | Esophagus | ESCC | Viral carcinogenesis | 137/4205 | 204/8465 | 2.47e-07 | 1.88e-06 | 9.62e-07 | 137 |
| hsa05203 | Liver | Cirrhotic | Viral carcinogenesis | 76/2530 | 204/8465 | 1.34e-02 | 4.20e-02 | 2.59e-02 | 76 |
| hsa052031 | Liver | Cirrhotic | Viral carcinogenesis | 76/2530 | 204/8465 | 1.34e-02 | 4.20e-02 | 2.59e-02 | 76 |
| hsa052032 | Liver | HCC | Viral carcinogenesis | 117/4020 | 204/8465 | 2.68e-03 | 8.98e-03 | 5.00e-03 | 117 |
| hsa052033 | Liver | HCC | Viral carcinogenesis | 117/4020 | 204/8465 | 2.68e-03 | 8.98e-03 | 5.00e-03 | 117 |
| hsa052034 | Lung | IAC | Viral carcinogenesis | 43/1053 | 204/8465 | 3.02e-04 | 3.07e-03 | 2.04e-03 | 43 |
| hsa0520311 | Lung | IAC | Viral carcinogenesis | 43/1053 | 204/8465 | 3.02e-04 | 3.07e-03 | 2.04e-03 | 43 |
| hsa0520321 | Lung | AIS | Viral carcinogenesis | 37/961 | 204/8465 | 2.49e-03 | 1.49e-02 | 9.55e-03 | 37 |
| hsa0520331 | Lung | AIS | Viral carcinogenesis | 37/961 | 204/8465 | 2.49e-03 | 1.49e-02 | 9.55e-03 | 37 |
| hsa052038 | Oral cavity | OSCC | Viral carcinogenesis | 124/3704 | 204/8465 | 5.57e-07 | 3.28e-06 | 1.67e-06 | 124 |
| hsa0520314 | Oral cavity | OSCC | Viral carcinogenesis | 124/3704 | 204/8465 | 5.57e-07 | 3.28e-06 | 1.67e-06 | 124 |
| hsa0520324 | Oral cavity | LP | Viral carcinogenesis | 90/2418 | 204/8465 | 1.20e-06 | 1.38e-05 | 8.89e-06 | 90 |
| hsa0520334 | Oral cavity | LP | Viral carcinogenesis | 90/2418 | 204/8465 | 1.20e-06 | 1.38e-05 | 8.89e-06 | 90 |
| hsa0520342 | Oral cavity | EOLP | Viral carcinogenesis | 55/1218 | 204/8465 | 1.54e-06 | 1.34e-05 | 7.92e-06 | 55 |
| hsa0520351 | Oral cavity | EOLP | Viral carcinogenesis | 55/1218 | 204/8465 | 1.54e-06 | 1.34e-05 | 7.92e-06 | 55 |
| hsa0520361 | Oral cavity | NEOLP | Viral carcinogenesis | 56/1112 | 204/8465 | 2.90e-08 | 5.34e-07 | 3.36e-07 | 56 |
| hsa0520371 | Oral cavity | NEOLP | Viral carcinogenesis | 56/1112 | 204/8465 | 2.90e-08 | 5.34e-07 | 3.36e-07 | 56 |
| hsa052037 | Prostate | BPH | Viral carcinogenesis | 69/1718 | 204/8465 | 3.40e-06 | 2.87e-05 | 1.78e-05 | 69 |
| hsa0520313 | Prostate | BPH | Viral carcinogenesis | 69/1718 | 204/8465 | 3.40e-06 | 2.87e-05 | 1.78e-05 | 69 |
| Page: 1 2 |
Top |
Cell-cell communication analysis |
| Identification of potential cell-cell interactions between two cell types and their ligand-receptor pairs for different disease states |
| Ligand | Receptor | LRpair | Pathway | Tissue | Disease Stage |
| Page: 1 |
Top |
Single-cell gene regulatory network inference analysis |
| Find out the significant the regulons (TFs) and the target genes of each regulon across cell types for different disease states |
| TF | Cell Type | Tissue | Disease Stage | Target Gene | RSS | Regulon Activity |
| ∗The dot plots of a searched regulon are shown for all cell subpopulations in each disease state of each tissue based on the regulon specific score inferred using pySCENIC and by calculating the average expression. |
| Page: 1 |
Top |
Somatic mutation of malignant transformation related genes |
| Annotation of somatic variants for genes involved in malignant transformation |
| Hugo Symbol | Variant Class | Variant Classification | dbSNP RS | HGVSc | HGVSp | HGVSp Short | SWISSPROT | BIOTYPE | SIFT | PolyPhen | Tumor Sample Barcode | Tissue | Histology | Sex | Age | Stage | Therapy Types | Drugs | Outcome |
| SP100 | SNV | Missense_Mutation | c.1561N>A | p.Glu521Lys | p.E521K | P23497 | protein_coding | tolerated(0.06) | benign(0.098) | TCGA-A2-A0CX-01 | Breast | breast invasive carcinoma | Female | <65 | I/II | Chemotherapy | adriamycin | SD | |
| SP100 | SNV | Missense_Mutation | novel | c.1863N>A | p.Phe621Leu | p.F621L | P23497 | protein_coding | tolerated(1) | benign(0.003) | TCGA-AN-A046-01 | Breast | breast invasive carcinoma | Female | >=65 | I/II | Unknown | Unknown | SD |
| SP100 | SNV | Missense_Mutation | c.802N>A | p.Leu268Met | p.L268M | P23497 | protein_coding | deleterious(0.01) | probably_damaging(0.948) | TCGA-AN-A0AK-01 | Breast | breast invasive carcinoma | Female | >=65 | I/II | Unknown | Unknown | SD | |
| SP100 | SNV | Missense_Mutation | c.401N>G | p.Tyr134Cys | p.Y134C | P23497 | protein_coding | deleterious(0) | probably_damaging(0.999) | TCGA-AO-A128-01 | Breast | breast invasive carcinoma | Female | <65 | I/II | Chemotherapy | doxorubicin | SD | |
| SP100 | SNV | Missense_Mutation | c.1157N>A | p.Arg386Lys | p.R386K | P23497 | protein_coding | tolerated(0.45) | benign(0.237) | TCGA-BH-A0BZ-01 | Breast | breast invasive carcinoma | Female | <65 | III/IV | Chemotherapy | doxorubicin | CR | |
| SP100 | SNV | Missense_Mutation | rs373614701 | c.116N>T | p.Thr39Met | p.T39M | P23497 | protein_coding | deleterious(0.02) | possibly_damaging(0.821) | TCGA-BH-A0GZ-01 | Breast | breast invasive carcinoma | Female | <65 | I/II | Hormone Therapy | arimidex | SD |
| SP100 | SNV | Missense_Mutation | novel | c.1126C>T | p.Pro376Ser | p.P376S | P23497 | protein_coding | tolerated(0.59) | benign(0) | TCGA-2W-A8YY-01 | Cervix | cervical & endocervical cancer | Female | <65 | I/II | Chemotherapy | cisplatin | CR |
| SP100 | SNV | Missense_Mutation | novel | c.2119G>A | p.Val707Met | p.V707M | P23497 | protein_coding | deleterious(0.04) | possibly_damaging(0.874) | TCGA-2W-A8YY-01 | Cervix | cervical & endocervical cancer | Female | <65 | I/II | Chemotherapy | cisplatin | CR |
| SP100 | SNV | Missense_Mutation | novel | c.926N>T | p.Cys309Phe | p.C309F | P23497 | protein_coding | tolerated(0.7) | benign(0.048) | TCGA-C5-A8YR-01 | Cervix | cervical & endocervical cancer | Female | <65 | I/II | Unknown | Unknown | PD |
| SP100 | SNV | Missense_Mutation | novel | c.125A>G | p.Gln42Arg | p.Q42R | P23497 | protein_coding | deleterious(0.01) | benign(0.069) | TCGA-EA-A97N-01 | Cervix | cervical & endocervical cancer | Female | <65 | I/II | Unknown | Unknown | SD |
| Page: 1 2 3 4 5 6 7 8 9 10 11 |
Top |
Related drugs of malignant transformation related genes |
| Identification of chemicals and drugs interact with genes involved in malignant transfromation |
| (DGIdb 4.0) |
| Entrez ID | Symbol | Category | Interaction Types | Drug Claim Name | Drug Name | PMIDs |
| Page: 1 |

Copyright 2023-Present -The University of Texas Health Science Center at Houston |