| Tissue | Expression Dynamics | Abbreviation |
| Esophagus |  | ESCC: Esophageal squamous cell carcinoma |
| HGIN: High-grade intraepithelial neoplasias |
| LGIN: Low-grade intraepithelial neoplasias |
| Liver |  | HCC: Hepatocellular carcinoma |
| NAFLD: Non-alcoholic fatty liver disease |
| Oral Cavity | 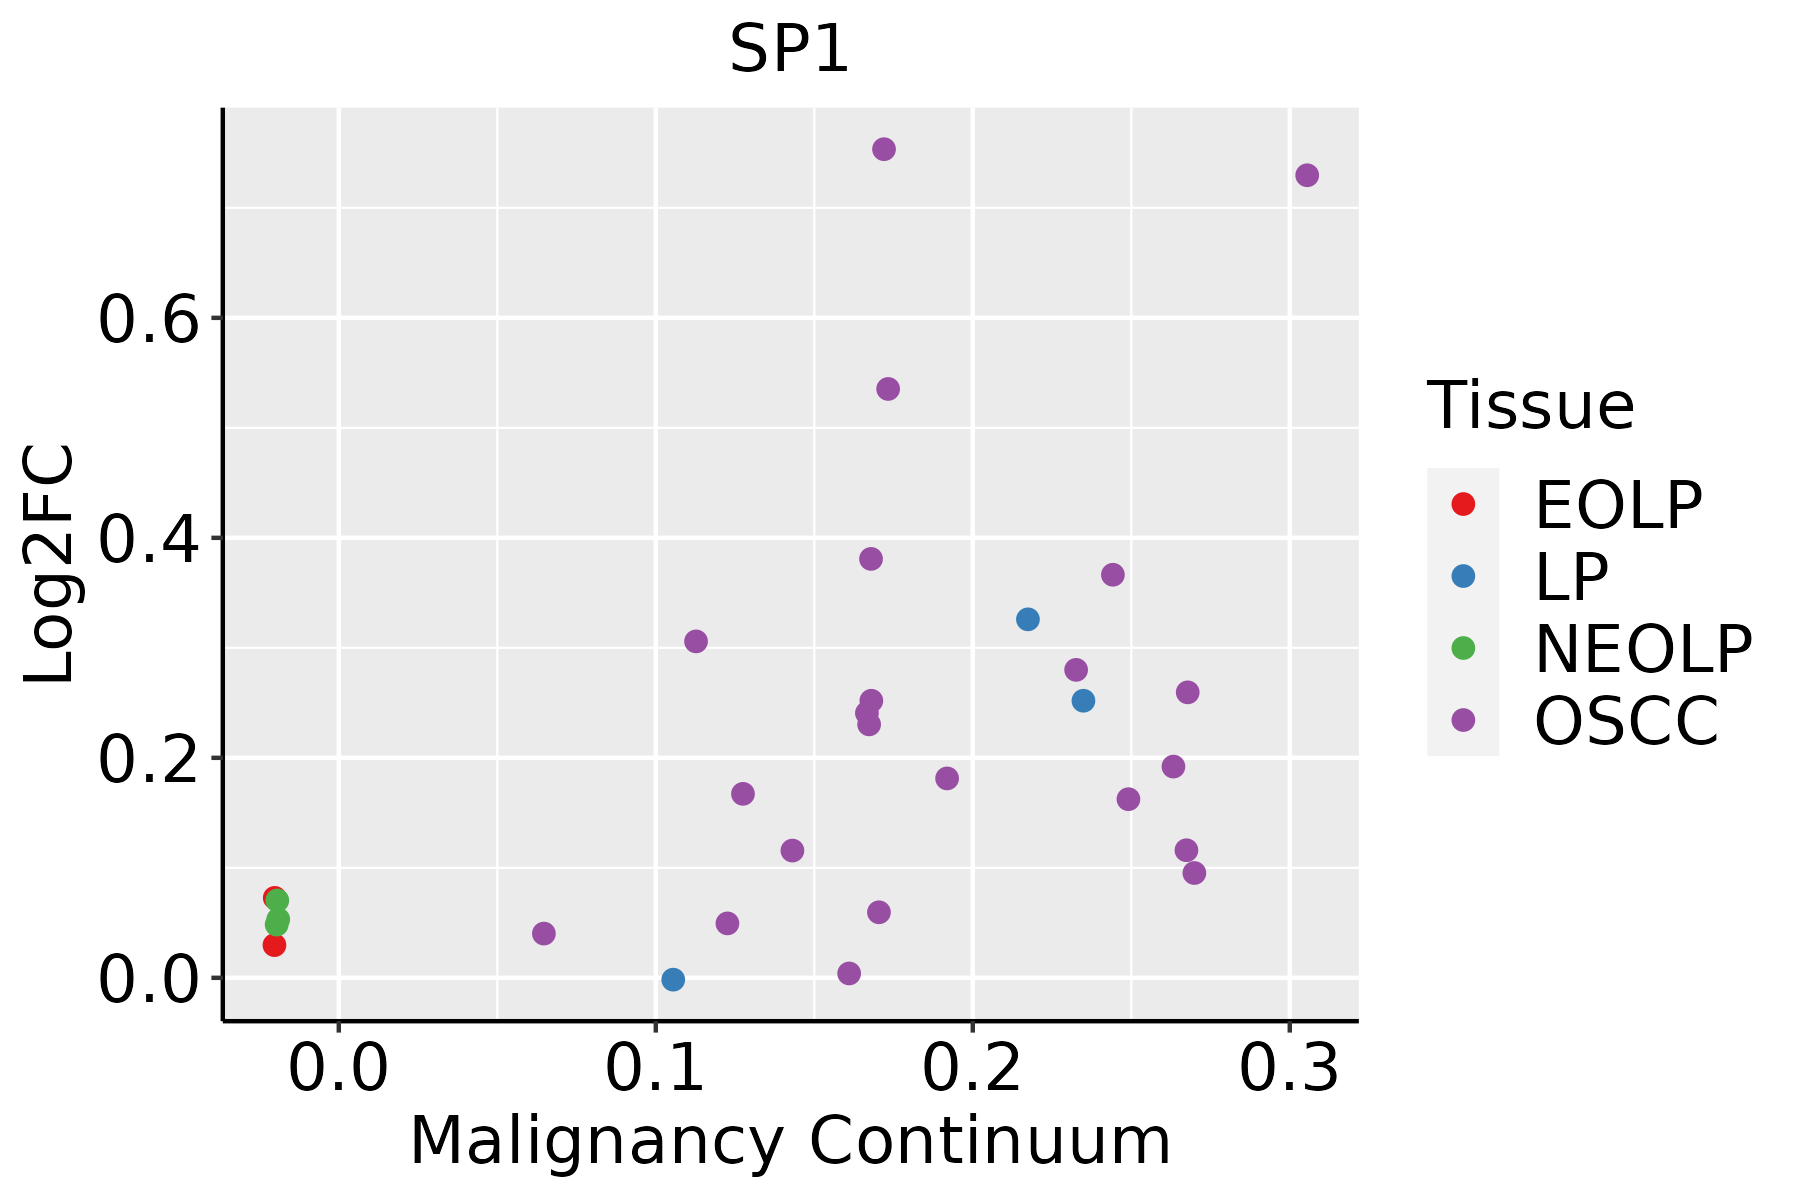 | EOLP: Erosive Oral lichen planus |
| LP: leukoplakia |
| NEOLP: Non-erosive oral lichen planus |
| OSCC: Oral squamous cell carcinoma |
| Prostate | 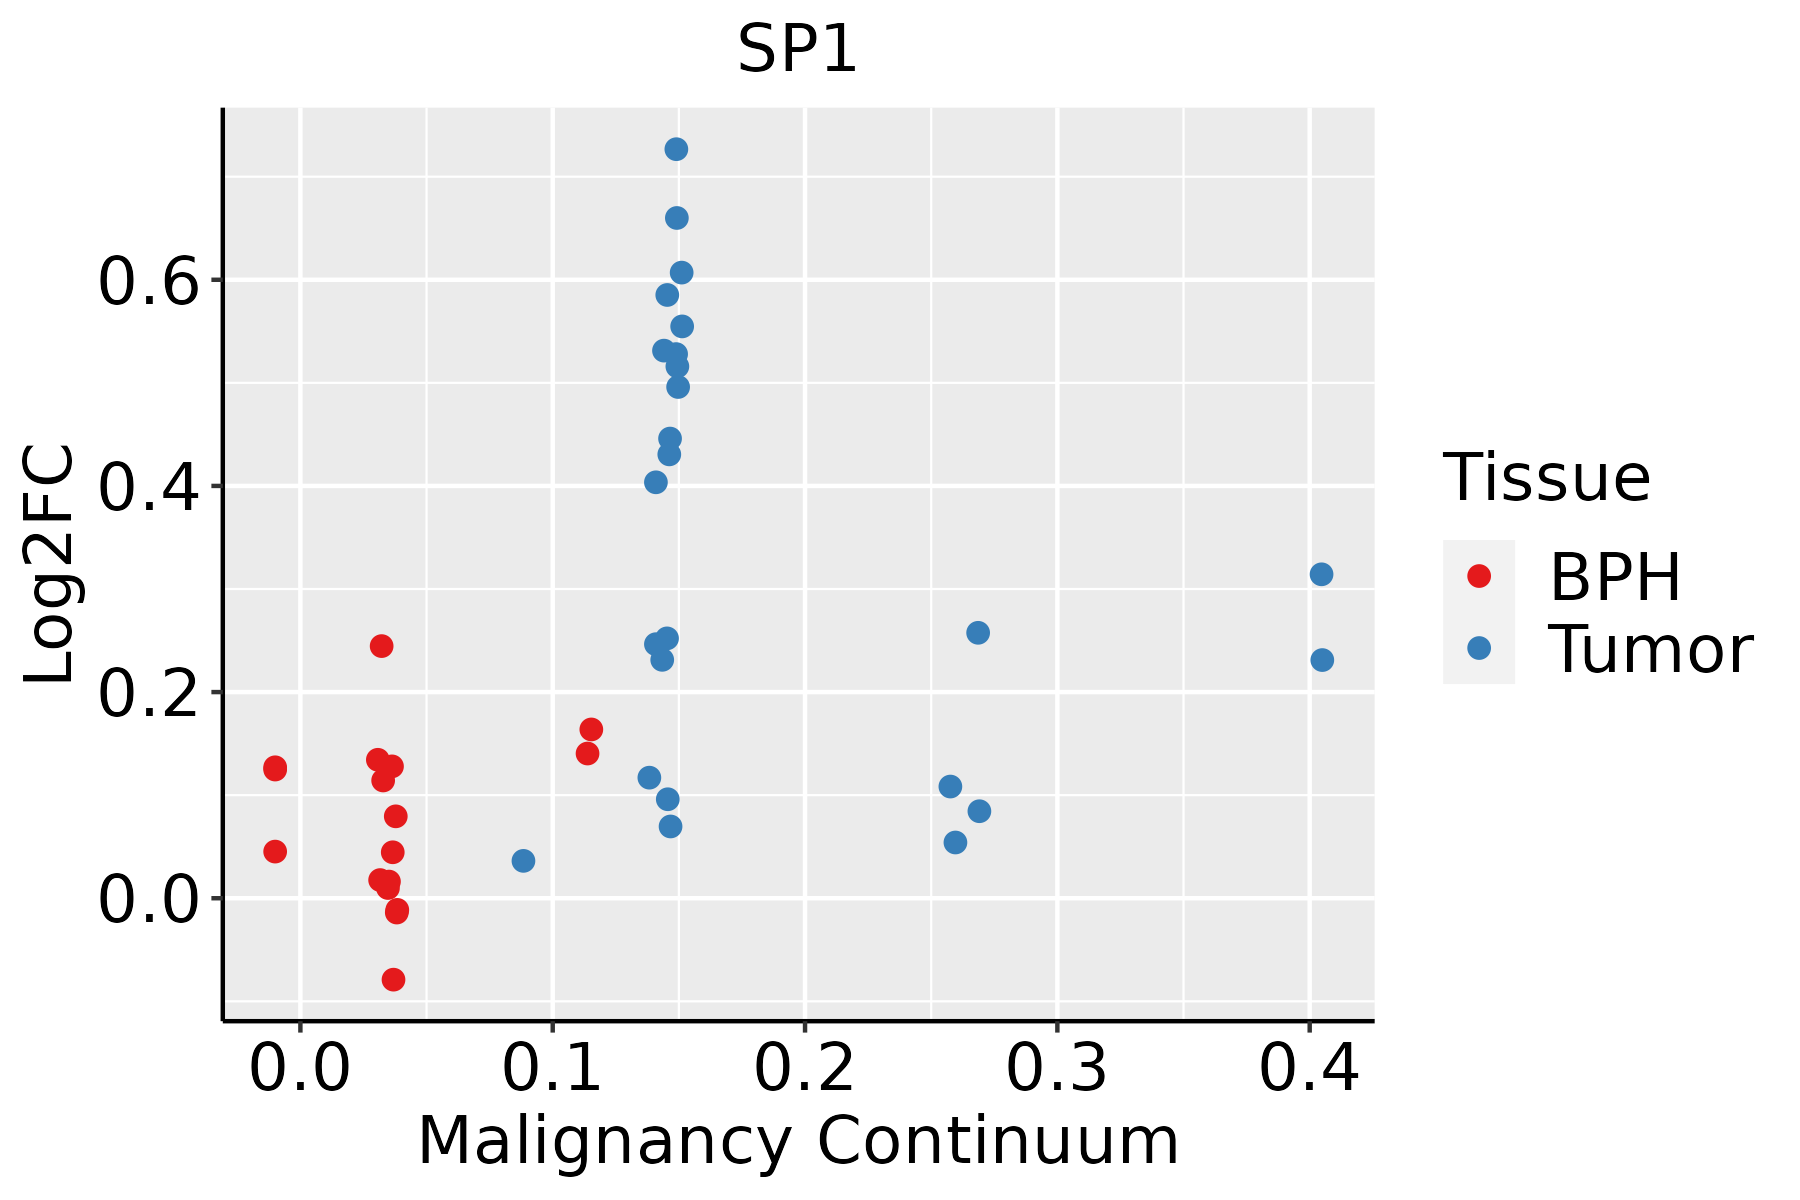 | BPH: Benign Prostatic Hyperplasia |
| Thyroid | 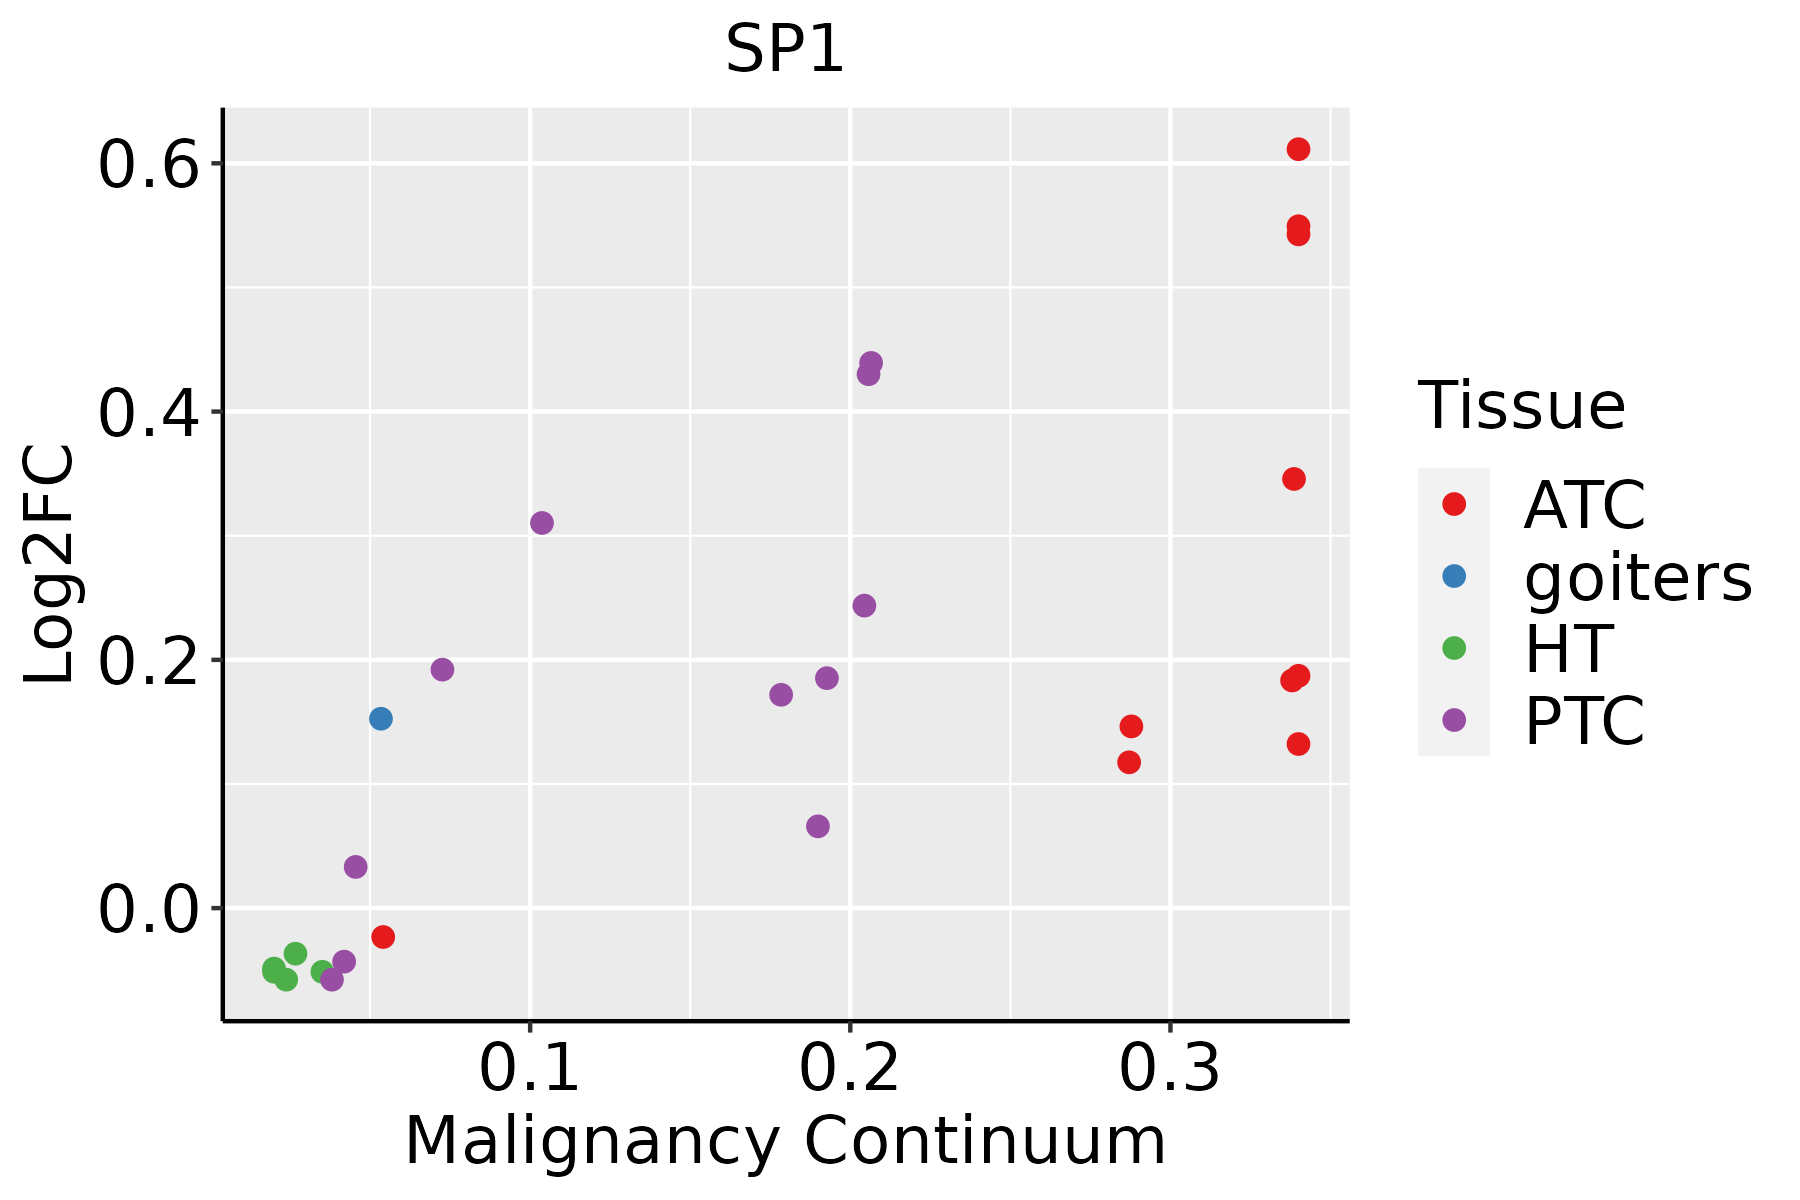 | ATC: Anaplastic thyroid cancer |
| HT: Hashimoto's thyroiditis |
| PTC: Papillary thyroid cancer |
| GO ID | Tissue | Disease Stage | Description | Gene Ratio | Bg Ratio | pvalue | p.adjust | Count |
| GO:00525479 | Breast | Precancer | regulation of peptidase activity | 71/1080 | 461/18723 | 2.72e-14 | 6.94e-12 | 71 |
| GO:00525489 | Breast | Precancer | regulation of endopeptidase activity | 67/1080 | 432/18723 | 1.06e-13 | 2.36e-11 | 67 |
| GO:00458619 | Breast | Precancer | negative regulation of proteolysis | 50/1080 | 351/18723 | 2.99e-09 | 2.39e-07 | 50 |
| GO:00513468 | Breast | Precancer | negative regulation of hydrolase activity | 50/1080 | 379/18723 | 3.85e-08 | 2.34e-06 | 50 |
| GO:00349769 | Breast | Precancer | response to endoplasmic reticulum stress | 38/1080 | 256/18723 | 7.89e-08 | 4.60e-06 | 38 |
| GO:00104668 | Breast | Precancer | negative regulation of peptidase activity | 38/1080 | 262/18723 | 1.46e-07 | 7.82e-06 | 38 |
| GO:00104989 | Breast | Precancer | proteasomal protein catabolic process | 58/1080 | 490/18723 | 1.54e-07 | 8.05e-06 | 58 |
| GO:00109519 | Breast | Precancer | negative regulation of endopeptidase activity | 37/1080 | 252/18723 | 1.55e-07 | 8.05e-06 | 37 |
| GO:19033629 | Breast | Precancer | regulation of cellular protein catabolic process | 36/1080 | 255/18723 | 6.03e-07 | 2.55e-05 | 36 |
| GO:00421769 | Breast | Precancer | regulation of protein catabolic process | 47/1080 | 391/18723 | 1.50e-06 | 5.58e-05 | 47 |
| GO:19033118 | Breast | Precancer | regulation of mRNA metabolic process | 38/1080 | 288/18723 | 1.63e-06 | 5.97e-05 | 38 |
| GO:19030509 | Breast | Precancer | regulation of proteolysis involved in cellular protein catabolic process | 31/1080 | 221/18723 | 4.10e-06 | 1.27e-04 | 31 |
| GO:00313309 | Breast | Precancer | negative regulation of cellular catabolic process | 34/1080 | 262/18723 | 8.16e-06 | 2.20e-04 | 34 |
| GO:00064028 | Breast | Precancer | mRNA catabolic process | 31/1080 | 232/18723 | 1.12e-05 | 2.93e-04 | 31 |
| GO:19058979 | Breast | Precancer | regulation of response to endoplasmic reticulum stress | 16/1080 | 82/18723 | 1.53e-05 | 3.75e-04 | 16 |
| GO:00064018 | Breast | Precancer | RNA catabolic process | 34/1080 | 278/18723 | 2.88e-05 | 6.39e-04 | 34 |
| GO:19033638 | Breast | Precancer | negative regulation of cellular protein catabolic process | 14/1080 | 75/18723 | 8.54e-05 | 1.63e-03 | 14 |
| GO:00098959 | Breast | Precancer | negative regulation of catabolic process | 36/1080 | 320/18723 | 9.92e-05 | 1.83e-03 | 36 |
| GO:19035739 | Breast | Precancer | negative regulation of response to endoplasmic reticulum stress | 10/1080 | 44/18723 | 1.61e-04 | 2.69e-03 | 10 |
| GO:00346558 | Breast | Precancer | nucleobase-containing compound catabolic process | 42/1080 | 407/18723 | 1.91e-04 | 3.06e-03 | 42 |
| Pathway ID | Tissue | Disease Stage | Description | Gene Ratio | Bg Ratio | pvalue | p.adjust | qvalue | Count |
| hsa05016210 | Esophagus | ESCC | Huntington disease | 226/4205 | 306/8465 | 1.38e-18 | 8.72e-17 | 4.46e-17 | 226 |
| hsa05415211 | Esophagus | ESCC | Diabetic cardiomyopathy | 146/4205 | 203/8465 | 5.81e-11 | 7.78e-10 | 3.99e-10 | 146 |
| hsa05163210 | Esophagus | ESCC | Human cytomegalovirus infection | 148/4205 | 225/8465 | 5.73e-07 | 4.00e-06 | 2.05e-06 | 148 |
| hsa04137210 | Esophagus | ESCC | Mitophagy - animal | 54/4205 | 72/8465 | 9.33e-06 | 4.96e-05 | 2.54e-05 | 54 |
| hsa0501728 | Esophagus | ESCC | Spinocerebellar ataxia | 94/4205 | 143/8465 | 6.77e-05 | 2.90e-04 | 1.48e-04 | 94 |
| hsa043507 | Esophagus | ESCC | TGF-beta signaling pathway | 69/4205 | 108/8465 | 1.92e-03 | 5.54e-03 | 2.84e-03 | 69 |
| hsa052028 | Esophagus | ESCC | Transcriptional misregulation in cancer | 116/4205 | 193/8465 | 2.08e-03 | 5.95e-03 | 3.05e-03 | 116 |
| hsa015227 | Esophagus | ESCC | Endocrine resistance | 63/4205 | 98/8465 | 2.38e-03 | 6.58e-03 | 3.37e-03 | 63 |
| hsa0492816 | Esophagus | ESCC | Parathyroid hormone synthesis, secretion and action | 66/4205 | 106/8465 | 5.86e-03 | 1.47e-02 | 7.51e-03 | 66 |
| hsa052319 | Esophagus | ESCC | Choline metabolism in cancer | 61/4205 | 98/8465 | 7.97e-03 | 1.92e-02 | 9.84e-03 | 61 |
| hsa0501638 | Esophagus | ESCC | Huntington disease | 226/4205 | 306/8465 | 1.38e-18 | 8.72e-17 | 4.46e-17 | 226 |
| hsa0541538 | Esophagus | ESCC | Diabetic cardiomyopathy | 146/4205 | 203/8465 | 5.81e-11 | 7.78e-10 | 3.99e-10 | 146 |
| hsa0516338 | Esophagus | ESCC | Human cytomegalovirus infection | 148/4205 | 225/8465 | 5.73e-07 | 4.00e-06 | 2.05e-06 | 148 |
| hsa0413738 | Esophagus | ESCC | Mitophagy - animal | 54/4205 | 72/8465 | 9.33e-06 | 4.96e-05 | 2.54e-05 | 54 |
| hsa0501736 | Esophagus | ESCC | Spinocerebellar ataxia | 94/4205 | 143/8465 | 6.77e-05 | 2.90e-04 | 1.48e-04 | 94 |
| hsa0435014 | Esophagus | ESCC | TGF-beta signaling pathway | 69/4205 | 108/8465 | 1.92e-03 | 5.54e-03 | 2.84e-03 | 69 |
| hsa0520213 | Esophagus | ESCC | Transcriptional misregulation in cancer | 116/4205 | 193/8465 | 2.08e-03 | 5.95e-03 | 3.05e-03 | 116 |
| hsa0152215 | Esophagus | ESCC | Endocrine resistance | 63/4205 | 98/8465 | 2.38e-03 | 6.58e-03 | 3.37e-03 | 63 |
| hsa0492817 | Esophagus | ESCC | Parathyroid hormone synthesis, secretion and action | 66/4205 | 106/8465 | 5.86e-03 | 1.47e-02 | 7.51e-03 | 66 |
| hsa0523114 | Esophagus | ESCC | Choline metabolism in cancer | 61/4205 | 98/8465 | 7.97e-03 | 1.92e-02 | 9.84e-03 | 61 |
| Hugo Symbol | Variant Class | Variant Classification | dbSNP RS | HGVSc | HGVSp | HGVSp Short | SWISSPROT | BIOTYPE | SIFT | PolyPhen | Tumor Sample Barcode | Tissue | Histology | Sex | Age | Stage | Therapy Types | Drugs | Outcome |
| SP1 | SNV | Missense_Mutation | rs775622089 | c.314A>G | p.Asn105Ser | p.N105S | P08047 | protein_coding | deleterious(0.01) | probably_damaging(0.968) | TCGA-AN-A0AR-01 | Breast | breast invasive carcinoma | Female | <65 | I/II | Unknown | Unknown | SD |
| SP1 | SNV | Missense_Mutation | | c.49N>T | p.Ile17Phe | p.I17F | P08047 | protein_coding | tolerated_low_confidence(0.08) | benign(0.227) | TCGA-AN-A0FJ-01 | Breast | breast invasive carcinoma | Female | <65 | III/IV | Unknown | Unknown | SD |
| SP1 | SNV | Missense_Mutation | | c.1262N>T | p.Ser421Leu | p.S421L | P08047 | protein_coding | deleterious(0.01) | possibly_damaging(0.587) | TCGA-BH-A0HF-01 | Breast | breast invasive carcinoma | Female | >=65 | I/II | Hormone Therapy | arimidex | SD |
| SP1 | SNV | Missense_Mutation | | c.1997N>A | p.Arg666His | p.R666H | P08047 | protein_coding | deleterious(0) | probably_damaging(0.991) | TCGA-BH-A18G-01 | Breast | breast invasive carcinoma | Female | >=65 | I/II | Unknown | Unknown | SD |
| SP1 | SNV | Missense_Mutation | | c.202T>C | p.Cys68Arg | p.C68R | P08047 | protein_coding | deleterious(0) | probably_damaging(0.99) | TCGA-EW-A1IZ-01 | Breast | breast invasive carcinoma | Female | <65 | III/IV | Chemotherapy | taxotere | SD |
| SP1 | SNV | Missense_Mutation | novel | c.407N>G | p.Ser136Cys | p.S136C | P08047 | protein_coding | deleterious(0.01) | possibly_damaging(0.648) | TCGA-GM-A3XL-01 | Breast | breast invasive carcinoma | Female | <65 | I/II | Chemotherapy | fluorouracil | CR |
| SP1 | insertion | Nonsense_Mutation | novel | c.1611_1612insCCAGTTTTATTTTGATTGTTTTCTTTGGAA | p.Leu537_Gly538insProValLeuPheTerLeuPheSerLeuGlu | p.L537_G538insPVLF*LFSLE | P08047 | protein_coding | | | TCGA-A7-A0DA-01 | Breast | breast invasive carcinoma | Female | <65 | I/II | Chemotherapy | adriamycin | SD |
| SP1 | SNV | Missense_Mutation | | c.2022N>C | p.Gln674His | p.Q674H | P08047 | protein_coding | deleterious(0) | probably_damaging(0.996) | TCGA-C5-A1BQ-01 | Cervix | cervical & endocervical cancer | Female | >=65 | III/IV | Chemotherapy | cisplatin | CR |
| SP1 | SNV | Missense_Mutation | | c.2022N>C | p.Gln674His | p.Q674H | P08047 | protein_coding | deleterious(0) | probably_damaging(0.996) | TCGA-C5-A3HL-01 | Cervix | cervical & endocervical cancer | Female | >=65 | I/II | Unknown | Unknown | SD |
| SP1 | SNV | Missense_Mutation | novel | c.2009N>T | p.Ser670Leu | p.S670L | P08047 | protein_coding | deleterious(0) | probably_damaging(0.982) | TCGA-DS-A1OB-01 | Cervix | cervical & endocervical cancer | Female | <65 | I/II | Chemotherapy | carboplatin | PD |


