
|
|||||
|
 | |
| |
| |
| |
| |
| |
|
Gene: SOX9 |
Gene summary for SOX9 |
| Gene information | Species | Human | Gene symbol | SOX9 | Gene ID | 6662 |
| Gene name | SRY-box transcription factor 9 | |
| Gene Alias | CMD1 | |
| Cytomap | 17q24.3 | |
| Gene Type | protein-coding | GO ID | GO:0000003 | UniProtAcc | P48436 |
Top |
Malignant transformation analysis |
| Identification of the aberrant gene expression in precancerous and cancerous lesions by comparing the gene expression of stem-like cells in diseased tissues with normal stem cells |
| Entrez ID | Symbol | Replicates | Species | Organ | Tissue | Adj P-value | Log2FC | Malignancy |
| 6662 | SOX9 | GSM4909280 | Human | Breast | Precancer | 8.81e-06 | 5.75e-01 | 0.0305 |
| 6662 | SOX9 | GSM4909282 | Human | Breast | IDC | 4.00e-24 | 6.87e-01 | -0.0288 |
| 6662 | SOX9 | GSM4909285 | Human | Breast | IDC | 2.14e-04 | 2.36e-01 | 0.21 |
| 6662 | SOX9 | GSM4909286 | Human | Breast | IDC | 2.55e-04 | 1.64e-01 | 0.1081 |
| 6662 | SOX9 | GSM4909287 | Human | Breast | IDC | 9.55e-05 | 3.29e-01 | 0.2057 |
| 6662 | SOX9 | GSM4909295 | Human | Breast | IDC | 7.27e-10 | 5.86e-01 | 0.0898 |
| 6662 | SOX9 | GSM4909296 | Human | Breast | IDC | 1.79e-05 | -2.39e-01 | 0.1524 |
| 6662 | SOX9 | GSM4909297 | Human | Breast | IDC | 1.59e-07 | -3.16e-01 | 0.1517 |
| 6662 | SOX9 | GSM4909298 | Human | Breast | IDC | 1.34e-24 | 6.51e-01 | 0.1551 |
| 6662 | SOX9 | GSM4909299 | Human | Breast | IDC | 6.81e-06 | 4.30e-01 | 0.035 |
| 6662 | SOX9 | GSM4909300 | Human | Breast | IDC | 1.22e-02 | 4.14e-01 | 0.0334 |
| 6662 | SOX9 | GSM4909301 | Human | Breast | IDC | 1.64e-02 | -2.69e-01 | 0.1577 |
| 6662 | SOX9 | GSM4909311 | Human | Breast | IDC | 4.78e-16 | -2.44e-01 | 0.1534 |
| 6662 | SOX9 | GSM4909312 | Human | Breast | IDC | 1.84e-04 | -1.48e-01 | 0.1552 |
| 6662 | SOX9 | GSM4909313 | Human | Breast | IDC | 1.41e-02 | 2.76e-01 | 0.0391 |
| 6662 | SOX9 | GSM4909319 | Human | Breast | IDC | 3.49e-23 | -3.80e-01 | 0.1563 |
| 6662 | SOX9 | GSM4909320 | Human | Breast | IDC | 9.99e-07 | -4.23e-01 | 0.1575 |
| 6662 | SOX9 | GSM4909321 | Human | Breast | IDC | 1.51e-16 | -3.69e-01 | 0.1559 |
| 6662 | SOX9 | NCCBC14 | Human | Breast | DCIS | 9.01e-07 | 1.76e-01 | 0.2021 |
| 6662 | SOX9 | NCCBC5 | Human | Breast | DCIS | 2.85e-10 | -3.52e-01 | 0.2046 |
| Page: 1 2 3 4 5 6 7 8 |
| Tissue | Expression Dynamics | Abbreviation |
| Breast | 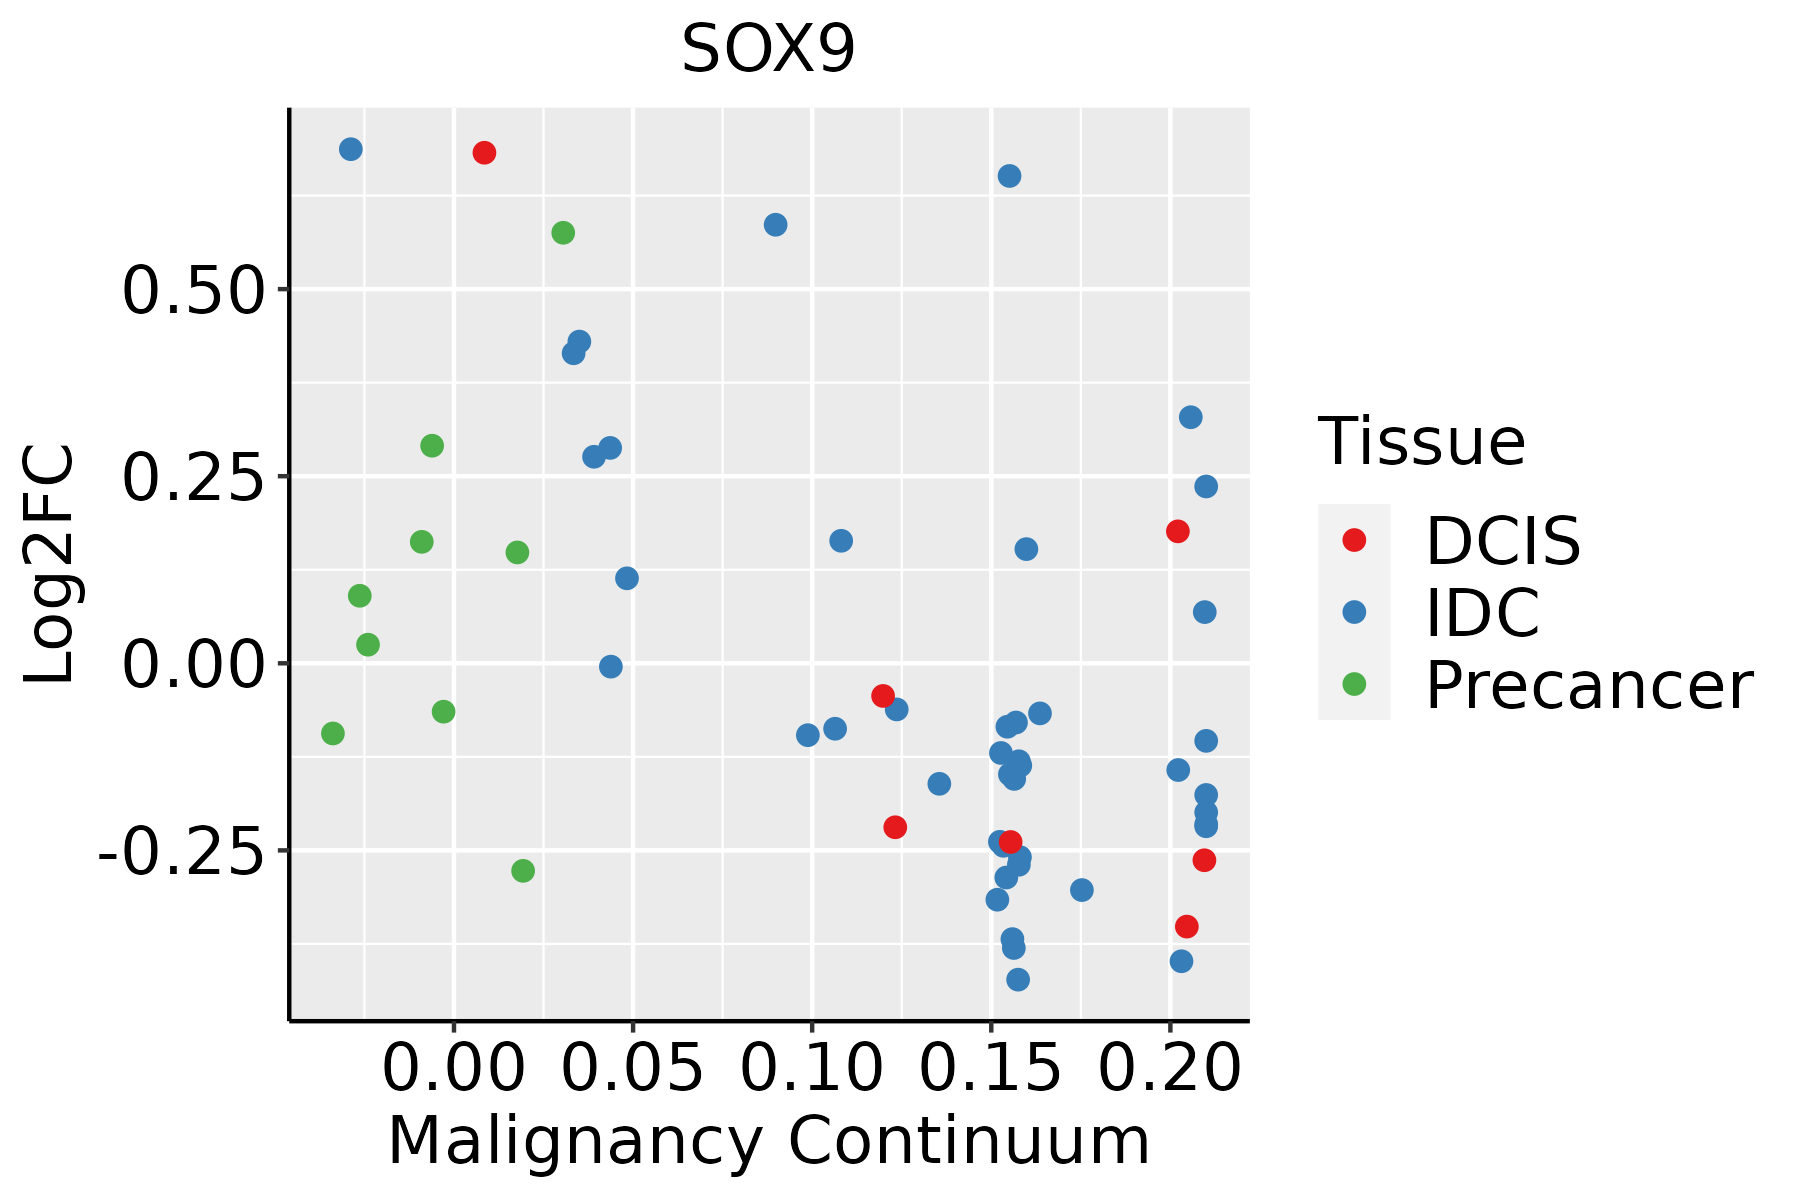 | IDC: Invasive ductal carcinoma |
| DCIS: Ductal carcinoma in situ | ||
| Precancer(BRCA1-mut): Precancerous lesion from BRCA1 mutation carriers | ||
| Cervix | 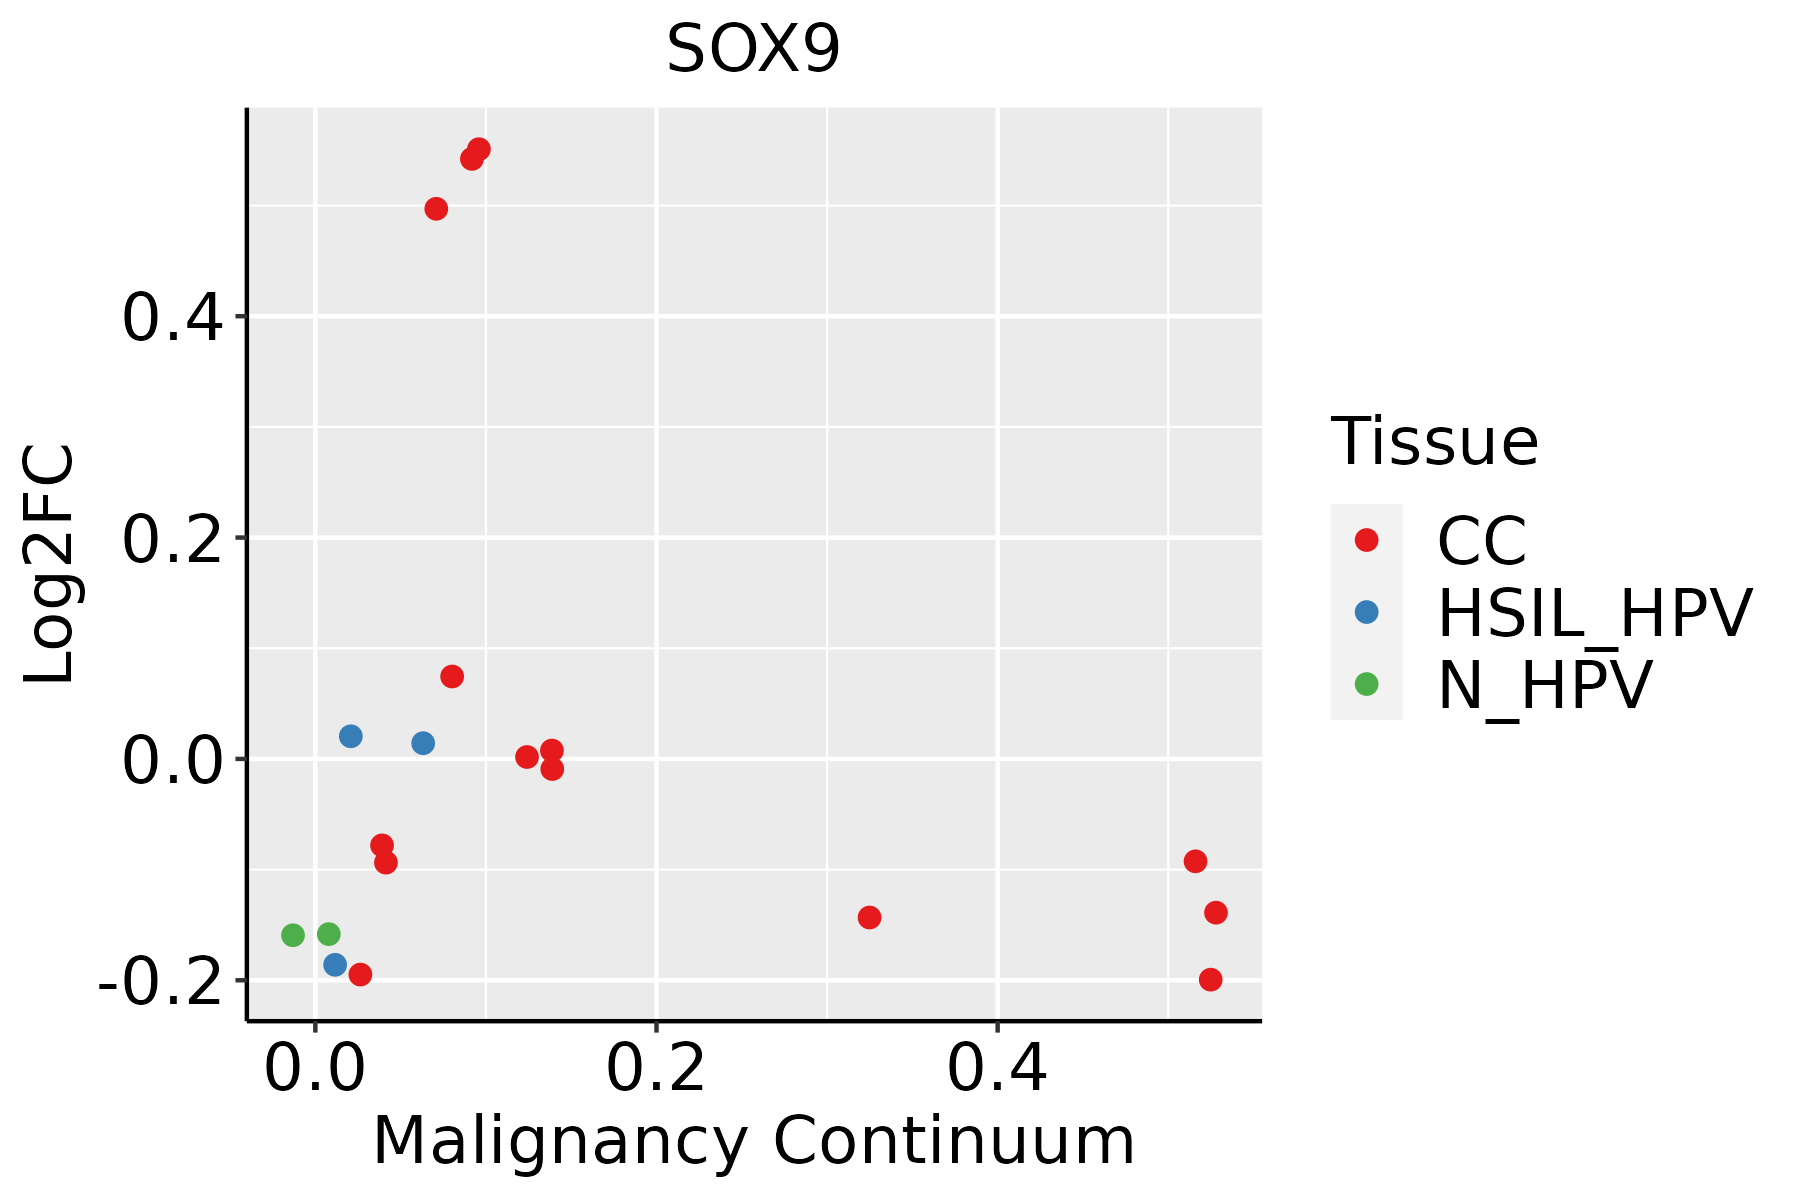 | CC: Cervix cancer |
| HSIL_HPV: HPV-infected high-grade squamous intraepithelial lesions | ||
| N_HPV: HPV-infected normal cervix | ||
| Colorectum (GSE201348) |  | FAP: Familial adenomatous polyposis |
| CRC: Colorectal cancer | ||
| Colorectum (HTA11) |  | AD: Adenomas |
| SER: Sessile serrated lesions | ||
| MSI-H: Microsatellite-high colorectal cancer | ||
| MSS: Microsatellite stable colorectal cancer | ||
| Esophagus | 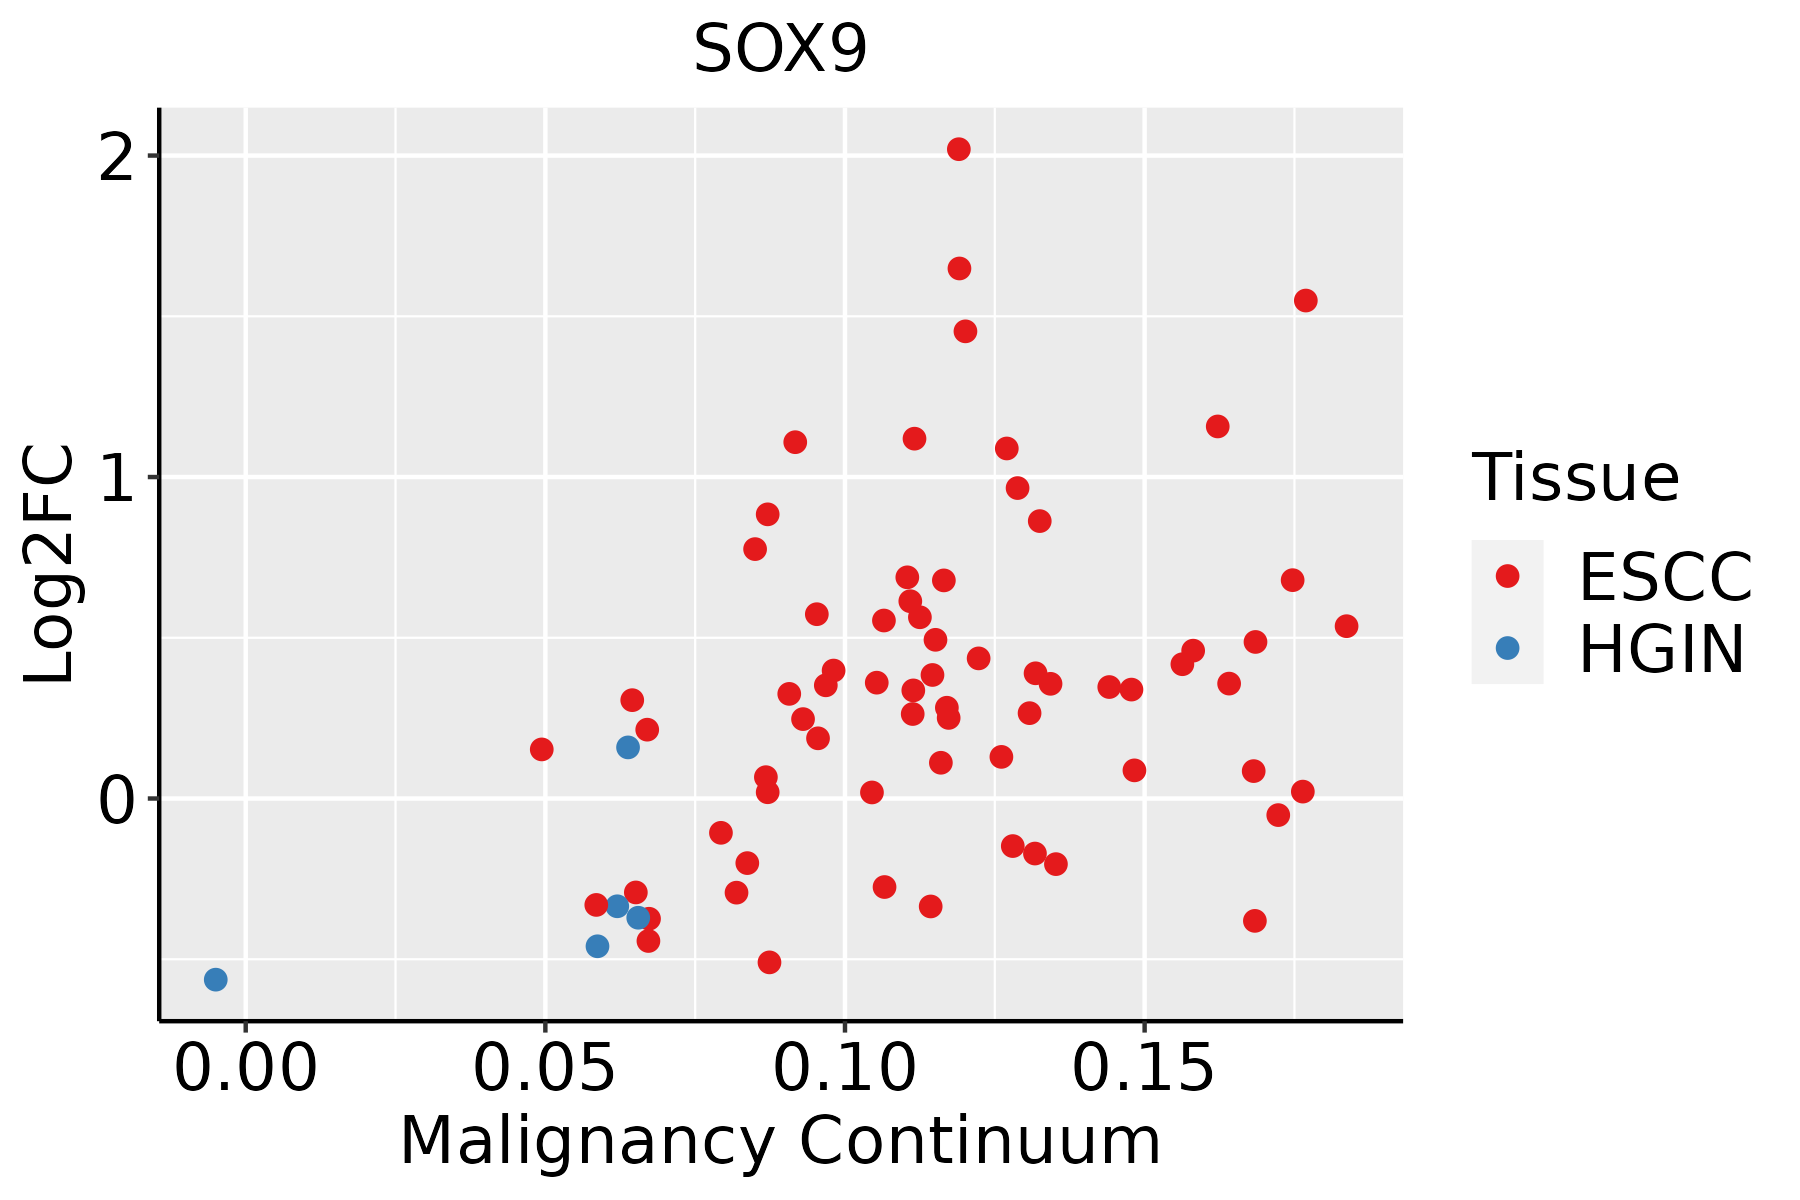 | ESCC: Esophageal squamous cell carcinoma |
| HGIN: High-grade intraepithelial neoplasias | ||
| LGIN: Low-grade intraepithelial neoplasias | ||
| Liver | 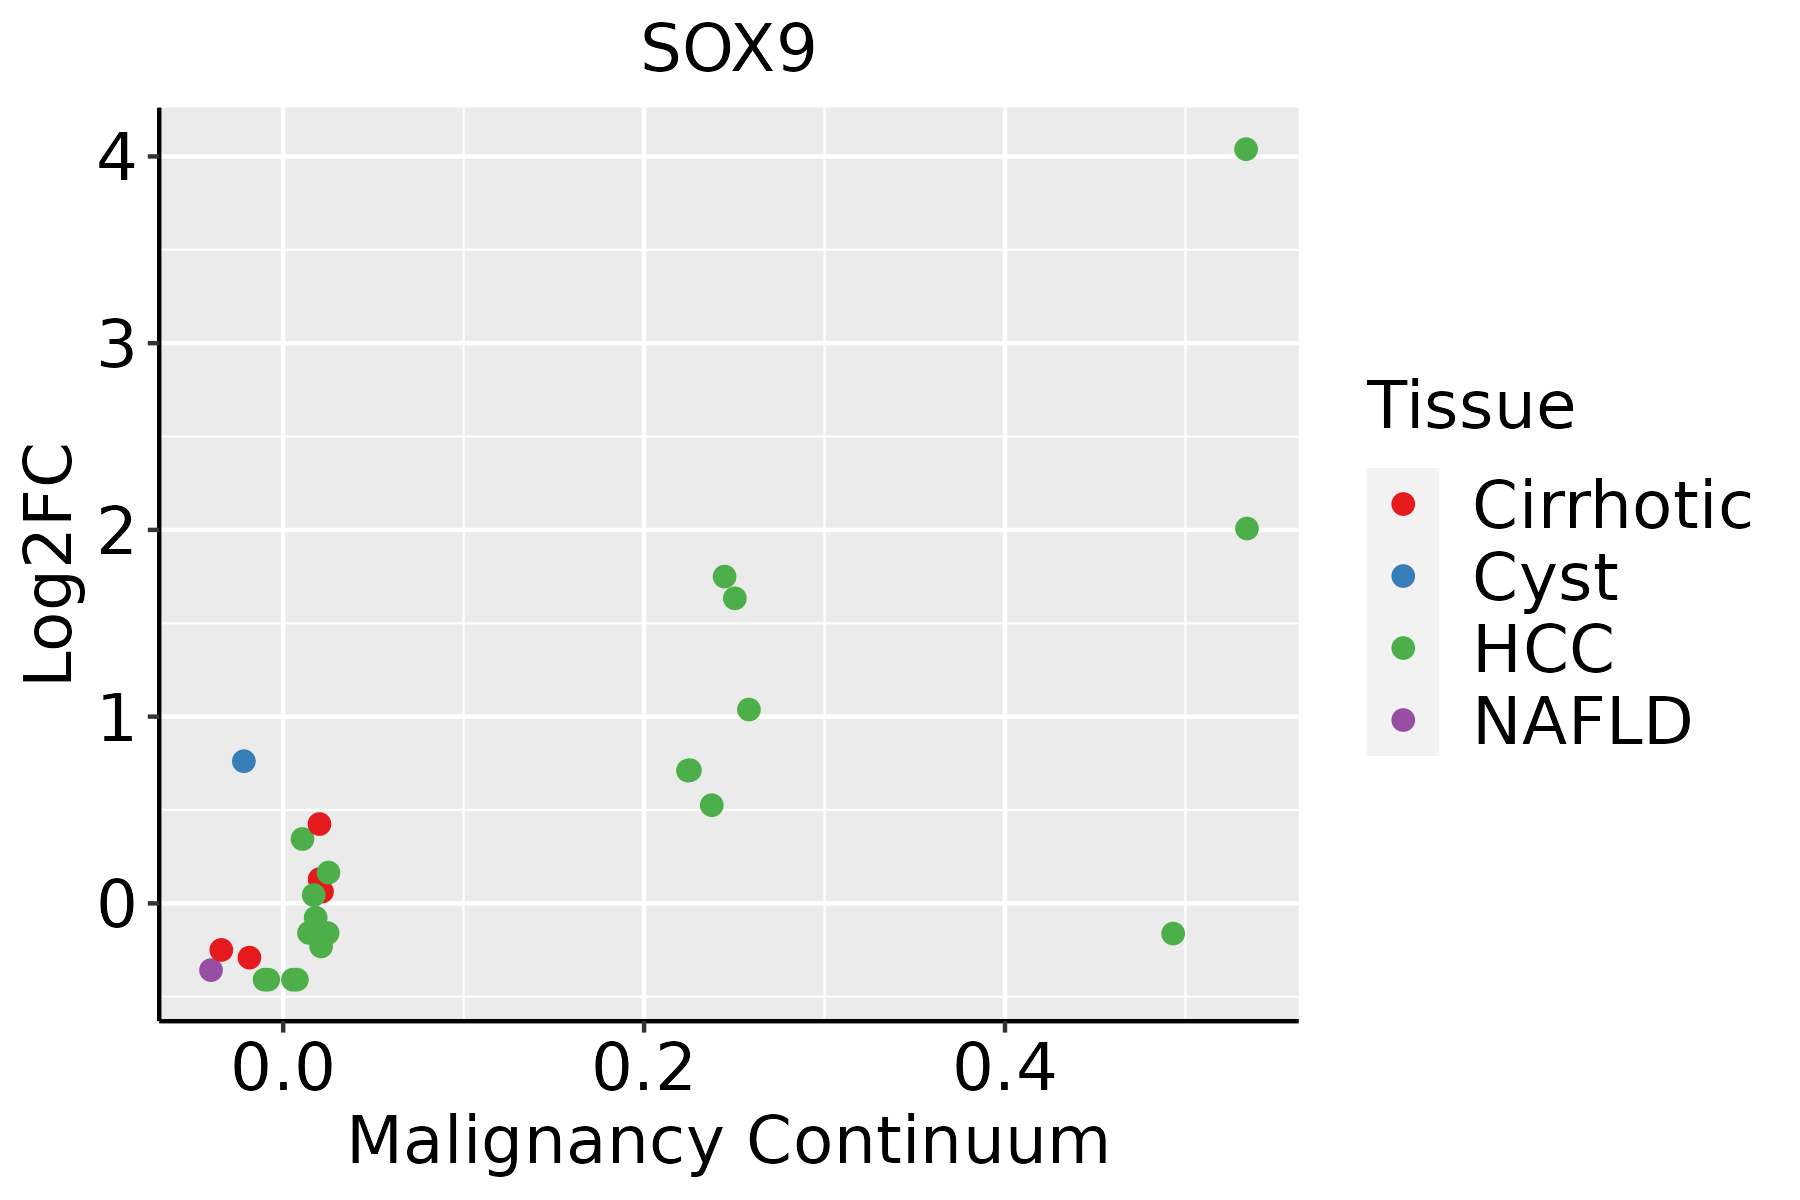 | HCC: Hepatocellular carcinoma |
| NAFLD: Non-alcoholic fatty liver disease | ||
| Oral Cavity | 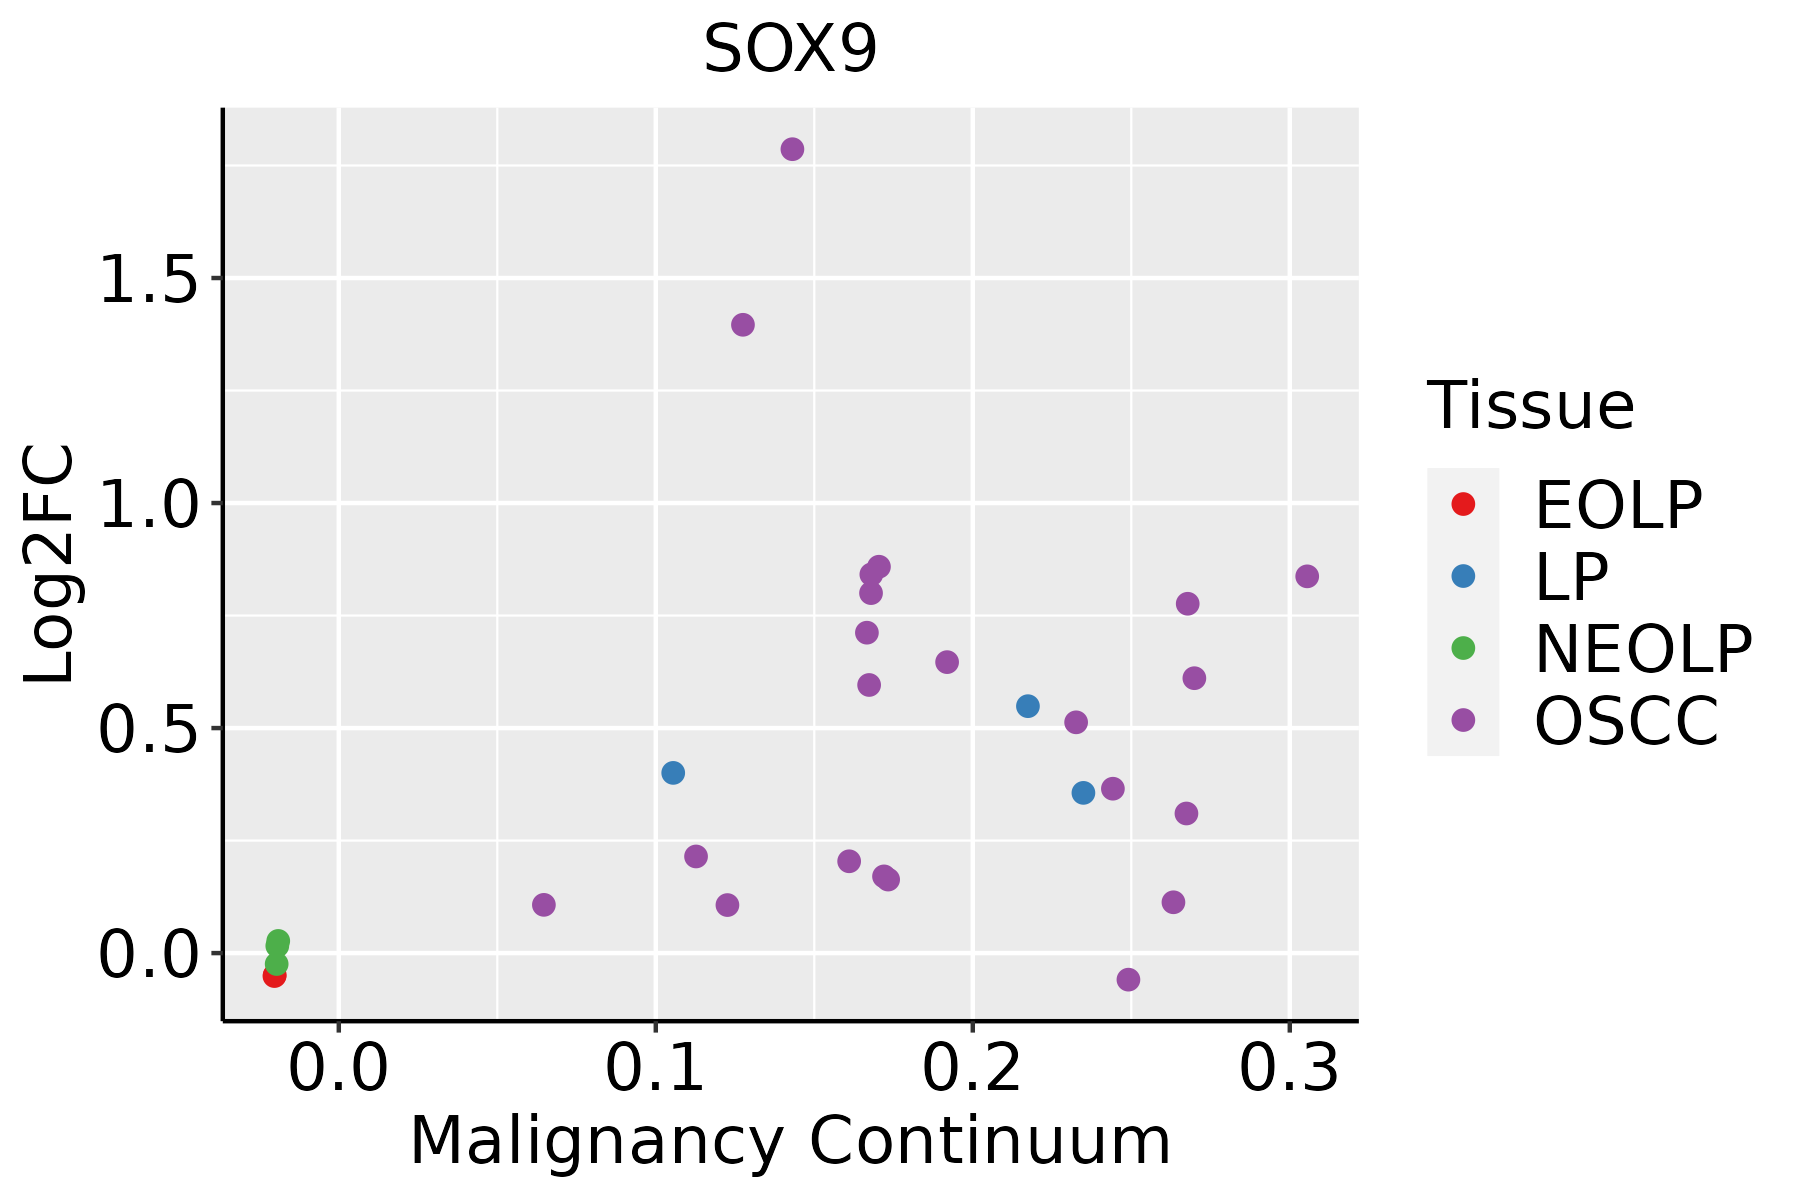 | EOLP: Erosive Oral lichen planus |
| LP: leukoplakia | ||
| NEOLP: Non-erosive oral lichen planus | ||
| OSCC: Oral squamous cell carcinoma | ||
| Prostate | 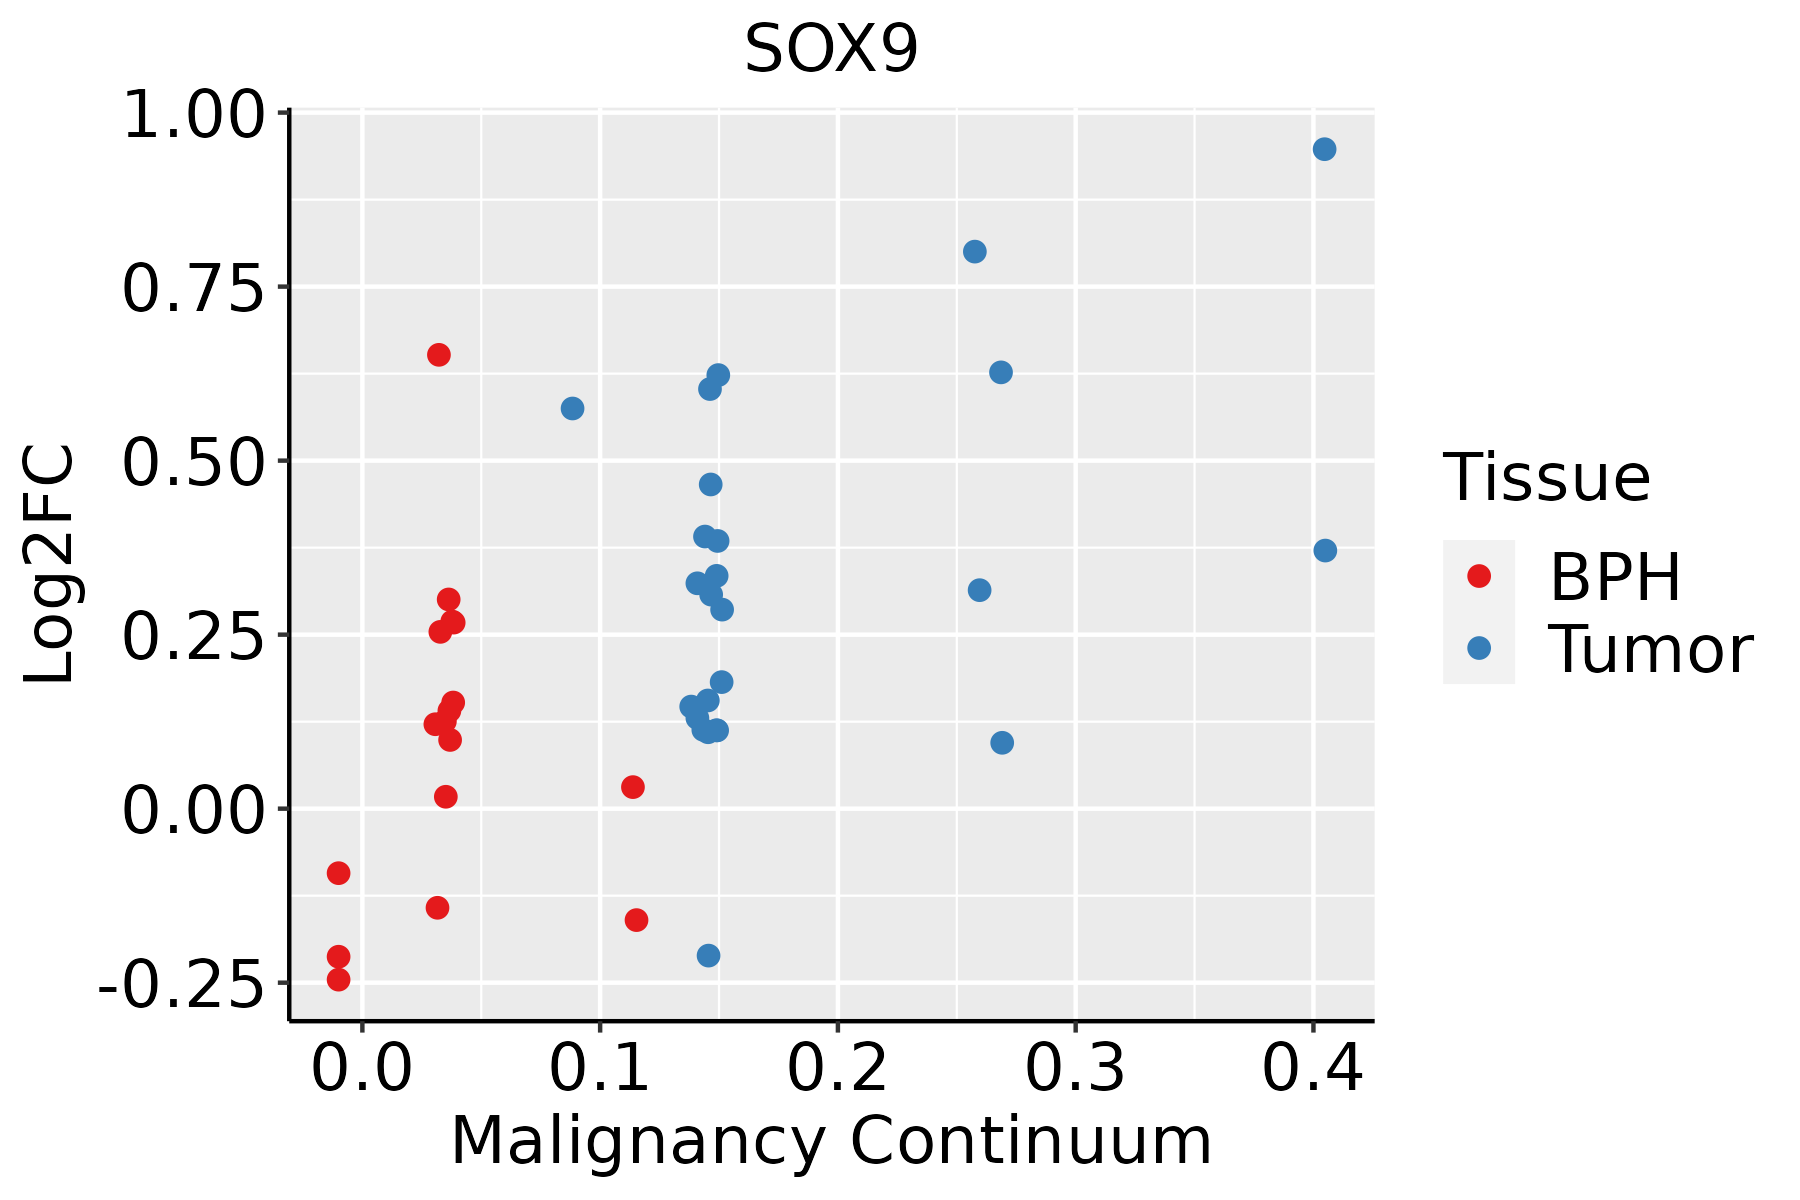 | BPH: Benign Prostatic Hyperplasia |
| Skin |  | AK: Actinic keratosis |
| cSCC: Cutaneous squamous cell carcinoma | ||
| SCCIS:squamous cell carcinoma in situ | ||
| Thyroid |  | ATC: Anaplastic thyroid cancer |
| HT: Hashimoto's thyroiditis | ||
| PTC: Papillary thyroid cancer |
| ∗log2FC in expression of this searched gene in stem-like cells from each diseased tissue sample relative to stem-like cells in normal samples in each tissue plotted against the malignancy continuum. Samples are colored based on if they are from different disease stage. |
Top |
Malignant transformation related pathway analysis |
| Find out the enriched GO biological processes and KEGG pathways involved in transition from healthy to precancer to cancer |
| Tissue | Disease Stage | Enriched GO biological Processes |
| Colorectum | AD |  |
| Colorectum | SER |  |
| Colorectum | MSS |  |
| Colorectum | MSI-H |  |
| Colorectum | FAP |  |
| ∗Top 15 enriched GO BP terms are showed in the bar plot of each disease state in each tissue. Each row represents a significant GO biological process which is colored according to the -log10(p.adjust). |
| Page: 1 2 3 4 5 6 7 8 9 |
| GO ID | Tissue | Disease Stage | Description | Gene Ratio | Bg Ratio | pvalue | p.adjust | Count |
| GO:00421769 | Breast | Precancer | regulation of protein catabolic process | 47/1080 | 391/18723 | 1.50e-06 | 5.58e-05 | 47 |
| GO:00432549 | Breast | Precancer | regulation of protein-containing complex assembly | 50/1080 | 428/18723 | 1.63e-06 | 5.97e-05 | 50 |
| GO:00487329 | Breast | Precancer | gland development | 49/1080 | 436/18723 | 6.11e-06 | 1.73e-04 | 49 |
| GO:00106348 | Breast | Precancer | positive regulation of epithelial cell migration | 25/1080 | 176/18723 | 2.75e-05 | 6.21e-04 | 25 |
| GO:00106319 | Breast | Precancer | epithelial cell migration | 40/1080 | 357/18723 | 4.57e-05 | 9.71e-04 | 40 |
| GO:00901329 | Breast | Precancer | epithelium migration | 40/1080 | 360/18723 | 5.51e-05 | 1.14e-03 | 40 |
| GO:00506736 | Breast | Precancer | epithelial cell proliferation | 46/1080 | 437/18723 | 6.02e-05 | 1.23e-03 | 46 |
| GO:00901309 | Breast | Precancer | tissue migration | 40/1080 | 365/18723 | 7.48e-05 | 1.47e-03 | 40 |
| GO:00712147 | Breast | Precancer | cellular response to abiotic stimulus | 37/1080 | 331/18723 | 9.12e-05 | 1.73e-03 | 37 |
| GO:01040047 | Breast | Precancer | cellular response to environmental stimulus | 37/1080 | 331/18723 | 9.12e-05 | 1.73e-03 | 37 |
| GO:00488729 | Breast | Precancer | homeostasis of number of cells | 32/1080 | 272/18723 | 1.03e-04 | 1.89e-03 | 32 |
| GO:00018898 | Breast | Precancer | liver development | 21/1080 | 147/18723 | 1.08e-04 | 1.96e-03 | 21 |
| GO:00610088 | Breast | Precancer | hepaticobiliary system development | 21/1080 | 150/18723 | 1.45e-04 | 2.49e-03 | 21 |
| GO:00106329 | Breast | Precancer | regulation of epithelial cell migration | 33/1080 | 292/18723 | 1.74e-04 | 2.86e-03 | 33 |
| GO:00506786 | Breast | Precancer | regulation of epithelial cell proliferation | 40/1080 | 381/18723 | 1.88e-04 | 3.03e-03 | 40 |
| GO:00016678 | Breast | Precancer | ameboidal-type cell migration | 47/1080 | 475/18723 | 2.19e-04 | 3.35e-03 | 47 |
| GO:00486087 | Breast | Precancer | reproductive structure development | 43/1080 | 424/18723 | 2.36e-04 | 3.56e-03 | 43 |
| GO:00098969 | Breast | Precancer | positive regulation of catabolic process | 48/1080 | 492/18723 | 2.62e-04 | 3.84e-03 | 48 |
| GO:00085445 | Breast | Precancer | epidermis development | 35/1080 | 324/18723 | 2.71e-04 | 3.96e-03 | 35 |
| GO:00614587 | Breast | Precancer | reproductive system development | 43/1080 | 427/18723 | 2.75e-04 | 4.00e-03 | 43 |
| Page: 1 2 3 4 5 6 7 8 9 10 11 12 13 14 15 16 17 18 19 20 21 22 23 24 25 26 27 28 29 30 31 32 33 34 35 36 37 38 39 40 41 42 43 44 45 46 47 48 49 50 51 52 53 54 55 56 57 58 59 60 61 62 63 64 65 66 67 68 69 70 71 72 73 74 75 76 77 78 79 80 81 82 83 84 85 86 87 88 89 90 91 92 93 94 95 96 97 98 99 100 |
| Pathway ID | Tissue | Disease Stage | Description | Gene Ratio | Bg Ratio | pvalue | p.adjust | qvalue | Count |
| hsa04024 | Colorectum | FAP | cAMP signaling pathway | 51/1404 | 225/8465 | 1.02e-02 | 3.68e-02 | 2.24e-02 | 51 |
| hsa040241 | Colorectum | FAP | cAMP signaling pathway | 51/1404 | 225/8465 | 1.02e-02 | 3.68e-02 | 2.24e-02 | 51 |
| hsa040242 | Colorectum | CRC | cAMP signaling pathway | 47/1091 | 225/8465 | 4.57e-04 | 4.77e-03 | 3.23e-03 | 47 |
| hsa040243 | Colorectum | CRC | cAMP signaling pathway | 47/1091 | 225/8465 | 4.57e-04 | 4.77e-03 | 3.23e-03 | 47 |
| Page: 1 |
Top |
Cell-cell communication analysis |
| Identification of potential cell-cell interactions between two cell types and their ligand-receptor pairs for different disease states |
| Ligand | Receptor | LRpair | Pathway | Tissue | Disease Stage |
| Page: 1 |
Top |
Single-cell gene regulatory network inference analysis |
| Find out the significant the regulons (TFs) and the target genes of each regulon across cell types for different disease states |
| TF | Cell Type | Tissue | Disease Stage | Target Gene | RSS | Regulon Activity |
| SOX9 | BMEM | Breast | ADJ | SLPI,TACSTD2,KRT14, etc. | 2.46e-01 |  |
| SOX9 | BMEM | Breast | Precancer | SLPI,TACSTD2,KRT14, etc. | 1.20e-01 |  |
| SOX9 | ICAF | Cervix | ADJ | NKX3-1,CCL8,CCL2, etc. | 1.04e-01 |  |
| SOX9 | ASC | Colorectum | AD | PABPC1,ETS2,EIF4A2, etc. | 2.31e-01 |  |
| SOX9 | MSC | Esophagus | ADJ | PERP,APOD,KLF5, etc. | 1.17e-02 |  |
| SOX9 | SMC | Esophagus | Healthy | PERP,APOD,KLF5, etc. | 6.09e-02 |  |
| SOX9 | MSC | Liver | Healthy | SOX4,GMNN,PAPD7, etc. | 1.90e-02 |  |
| SOX9 | PVA | Liver | Healthy | SOX4,GMNN,PAPD7, etc. | 1.96e-02 | |
| SOX9 | END | Liver | Healthy | SOX4,GMNN,PAPD7, etc. | 1.58e-02 | |
| SOX9 | LYMEND | Pancreas | ADJ | SLC4A4,FXYD2,GATM, etc. | 2.32e-01 |  |
| ∗The dot plots of a searched regulon are shown for all cell subpopulations in each disease state of each tissue based on the regulon specific score inferred using pySCENIC and by calculating the average expression. |
| Page: 1 2 3 4 |
Top |
Somatic mutation of malignant transformation related genes |
| Annotation of somatic variants for genes involved in malignant transformation |
| Hugo Symbol | Variant Class | Variant Classification | dbSNP RS | HGVSc | HGVSp | HGVSp Short | SWISSPROT | BIOTYPE | SIFT | PolyPhen | Tumor Sample Barcode | Tissue | Histology | Sex | Age | Stage | Therapy Types | Drugs | Outcome |
| SOX9 | SNV | Missense_Mutation | c.223N>A | p.Glu75Lys | p.E75K | P48436 | protein_coding | deleterious(0) | probably_damaging(0.996) | TCGA-AC-A23H-01 | Breast | breast invasive carcinoma | Female | >=65 | I/II | Unknown | Unknown | PD | |
| SOX9 | insertion | Frame_Shift_Ins | novel | c.252_253insG | p.Asp85GlyfsTer167 | p.D85Gfs*167 | P48436 | protein_coding | TCGA-AQ-A7U7-01 | Breast | breast invasive carcinoma | Female | <65 | III/IV | Targeted Molecular therapy | rituximab | CR | ||
| SOX9 | SNV | Missense_Mutation | novel | c.970N>G | p.Thr324Ala | p.T324A | P48436 | protein_coding | tolerated(1) | benign(0) | TCGA-2W-A8YY-01 | Cervix | cervical & endocervical cancer | Female | <65 | I/II | Chemotherapy | cisplatin | CR |
| SOX9 | SNV | Missense_Mutation | novel | c.423N>T | p.Lys141Asn | p.K141N | P48436 | protein_coding | deleterious(0.01) | possibly_damaging(0.691) | TCGA-EA-A410-01 | Cervix | cervical & endocervical cancer | Female | <65 | I/II | Unknown | Unknown | SD |
| SOX9 | SNV | Missense_Mutation | novel | c.841N>A | p.Asp281Asn | p.D281N | P48436 | protein_coding | deleterious(0) | benign(0.125) | TCGA-VS-A958-01 | Cervix | cervical & endocervical cancer | Female | <65 | I/II | Chemotherapy | cisplatin | CR |
| SOX9 | SNV | Missense_Mutation | c.810N>A | p.Phe270Leu | p.F270L | P48436 | protein_coding | deleterious(0) | benign(0.079) | TCGA-A6-2680-01 | Colorectum | colon adenocarcinoma | Female | >=65 | I/II | Unknown | Unknown | SD | |
| SOX9 | SNV | Missense_Mutation | c.358N>T | p.Arg120Cys | p.R120C | P48436 | protein_coding | deleterious(0) | probably_damaging(0.95) | TCGA-A6-3809-01 | Colorectum | colon adenocarcinoma | Female | >=65 | I/II | Unknown | Unknown | SD | |
| SOX9 | SNV | Missense_Mutation | c.810N>A | p.Phe270Leu | p.F270L | P48436 | protein_coding | deleterious(0) | benign(0.079) | TCGA-A6-4105-01 | Colorectum | colon adenocarcinoma | Male | >=65 | I/II | Unknown | Unknown | PD | |
| SOX9 | SNV | Missense_Mutation | rs761747688 | c.838N>G | p.Ser280Gly | p.S280G | P48436 | protein_coding | deleterious(0.01) | possibly_damaging(0.621) | TCGA-A6-5665-01 | Colorectum | colon adenocarcinoma | Female | >=65 | I/II | Unknown | Unknown | PD |
| SOX9 | SNV | Missense_Mutation | c.329N>G | p.Asn110Ser | p.N110S | P48436 | protein_coding | deleterious(0) | possibly_damaging(0.652) | TCGA-AA-3492-01 | Colorectum | colon adenocarcinoma | Female | >=65 | I/II | Unknown | Unknown | SD |
| Page: 1 2 3 4 5 6 7 8 9 10 11 12 |
Top |
Related drugs of malignant transformation related genes |
| Identification of chemicals and drugs interact with genes involved in malignant transfromation |
| (DGIdb 4.0) |
| Entrez ID | Symbol | Category | Interaction Types | Drug Claim Name | Drug Name | PMIDs |
| Page: 1 |

Copyright 2023-Present -The University of Texas Health Science Center at Houston |