Schematic overview of the cellular and molecular mechanisms involved in the cancer progression, including the proposed cellular and molecular mechanisms in cancer cells trajectory. AT1: alveolar type 1 cells; AT2: alveolar type 2 cells; AAH: atypical adenomatous hyperplasia; AIS: adenocarcinoma in situ; MIA: minimally invasive adenocarcinoma; IA: invasive adenocarcinoma; EMT: epithelial-mesenchymal transition

Home

Download

Statistics

Help

Contact

Center for Computational Systems Medicine
leaf

Gene summary

leaf

Malignant transformation analysis

leaf

Malignant transformation related pathway analysis

leaf

Cell-cell communication analysis

leaf

Single-cell gene regulatory network inference analysis

leaf

Somatic mutation of malignant transformation related genes

leaf

Related drugs of malignant transformation related genes

Gene: SOX5

Gene summary for SOX5

check button Gene summary.

Gene informationSpeciesHuman
Gene symbol

SOX5

Gene ID

6660

Gene nameSRY-box transcription factor 5
Gene AliasL-SOX5
Cytomap12p12.1
Gene Typeprotein-coding
GO ID

GO:0001501

UniProtAcc

P35711


Top

Malignant transformation analysis

check button Identification of the aberrant gene expression in precancerous and cancerous lesions by comparing the gene expression of stem-like cells in diseased tissues with normal stem cells
check button Malignant transformation involving gene list.
Entrez IDSymbolReplicatesSpeciesOrganTissueAdj P-valueLog2FCMalignancy
6660SOX5AEH-subject1HumanEndometriumAEH1.03e-971.54e+00-0.3059
6660SOX5AEH-subject2HumanEndometriumAEH2.20e-461.21e+00-0.2525
6660SOX5AEH-subject3HumanEndometriumAEH1.41e-841.46e+00-0.2576
6660SOX5AEH-subject4HumanEndometriumAEH1.69e-521.31e+00-0.2657
6660SOX5AEH-subject5HumanEndometriumAEH7.87e-421.04e+00-0.2953
6660SOX5EEC-subject1HumanEndometriumEEC7.77e-841.42e+00-0.2682
6660SOX5EEC-subject2HumanEndometriumEEC1.74e-711.34e+00-0.2607
6660SOX5EEC-subject3HumanEndometriumEEC1.54e-053.23e-01-0.2525
6660SOX5EEC-subject4HumanEndometriumEEC5.09e-389.85e-01-0.2571
6660SOX5EEC-subject5HumanEndometriumEEC7.80e-196.35e-01-0.249
6660SOX5GSM6177620_NYU_UCEC1_lib1_lib1HumanEndometriumEEC7.00e-03-3.35e-02-0.1869
6660SOX5GSM6177622_NYU_UCEC3_lib1_lib1HumanEndometriumEEC5.26e-04-7.45e-03-0.1917
6660SOX5GSM6177622_NYU_UCEC3_lib2_lib2HumanEndometriumEEC1.03e-05-6.09e-02-0.1916
6660SOX5NAFLD1HumanLiverNAFLD6.52e-171.57e+00-0.04
6660SOX5S41HumanLiverCirrhotic3.22e-091.05e+00-0.0343
6660SOX5HCC1_MengHumanLiverHCC2.08e-83-3.79e-010.0246
6660SOX5HCC2_MengHumanLiverHCC6.90e-13-4.94e-010.0107
6660SOX5cirrhotic1HumanLiverCirrhotic2.00e-11-4.84e-010.0202
6660SOX5cirrhotic2HumanLiverCirrhotic7.07e-13-4.92e-010.0201
6660SOX5cirrhotic3HumanLiverCirrhotic8.33e-08-4.82e-010.0215
Page: 1 2 3 4 5 

check button Transcriptomic changes along malignancy continuum.
TissueExpression DynamicsAbbreviation
EndometriumThe image shows the transcriptomic changes along malignancy continuum.log2FC in expression of this searched gene in stem-like cells from each diseased tissue sample relative to stem-like cells in normal samples in each tissue plotted against the malignancy continuum. Samples are colored based on if they are from different disease stage.
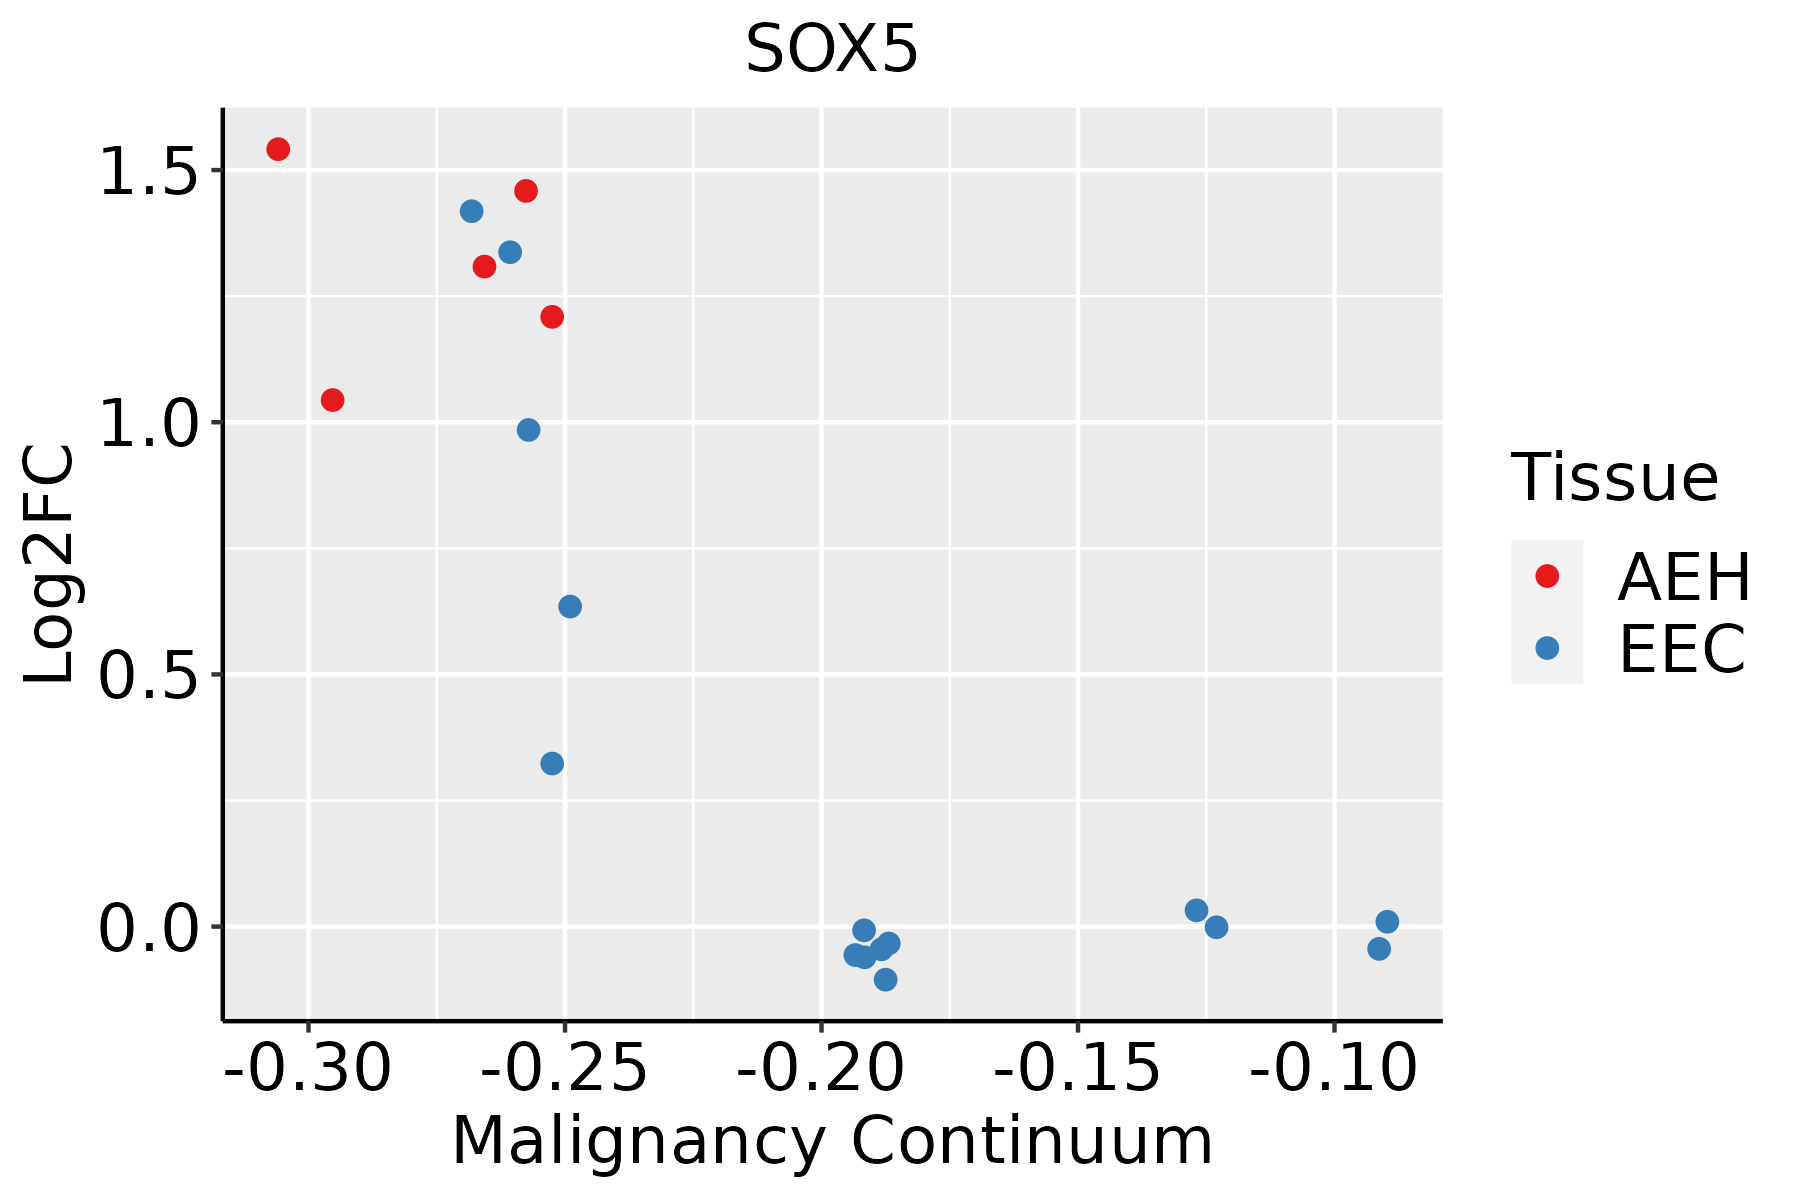
AEH: Atypical endometrial hyperplasia
EEC: Endometrioid Cancer
LiverThe image shows the transcriptomic changes along malignancy continuum.log2FC in expression of this searched gene in stem-like cells from each diseased tissue sample relative to stem-like cells in normal samples in each tissue plotted against the malignancy continuum. Samples are colored based on if they are from different disease stage.
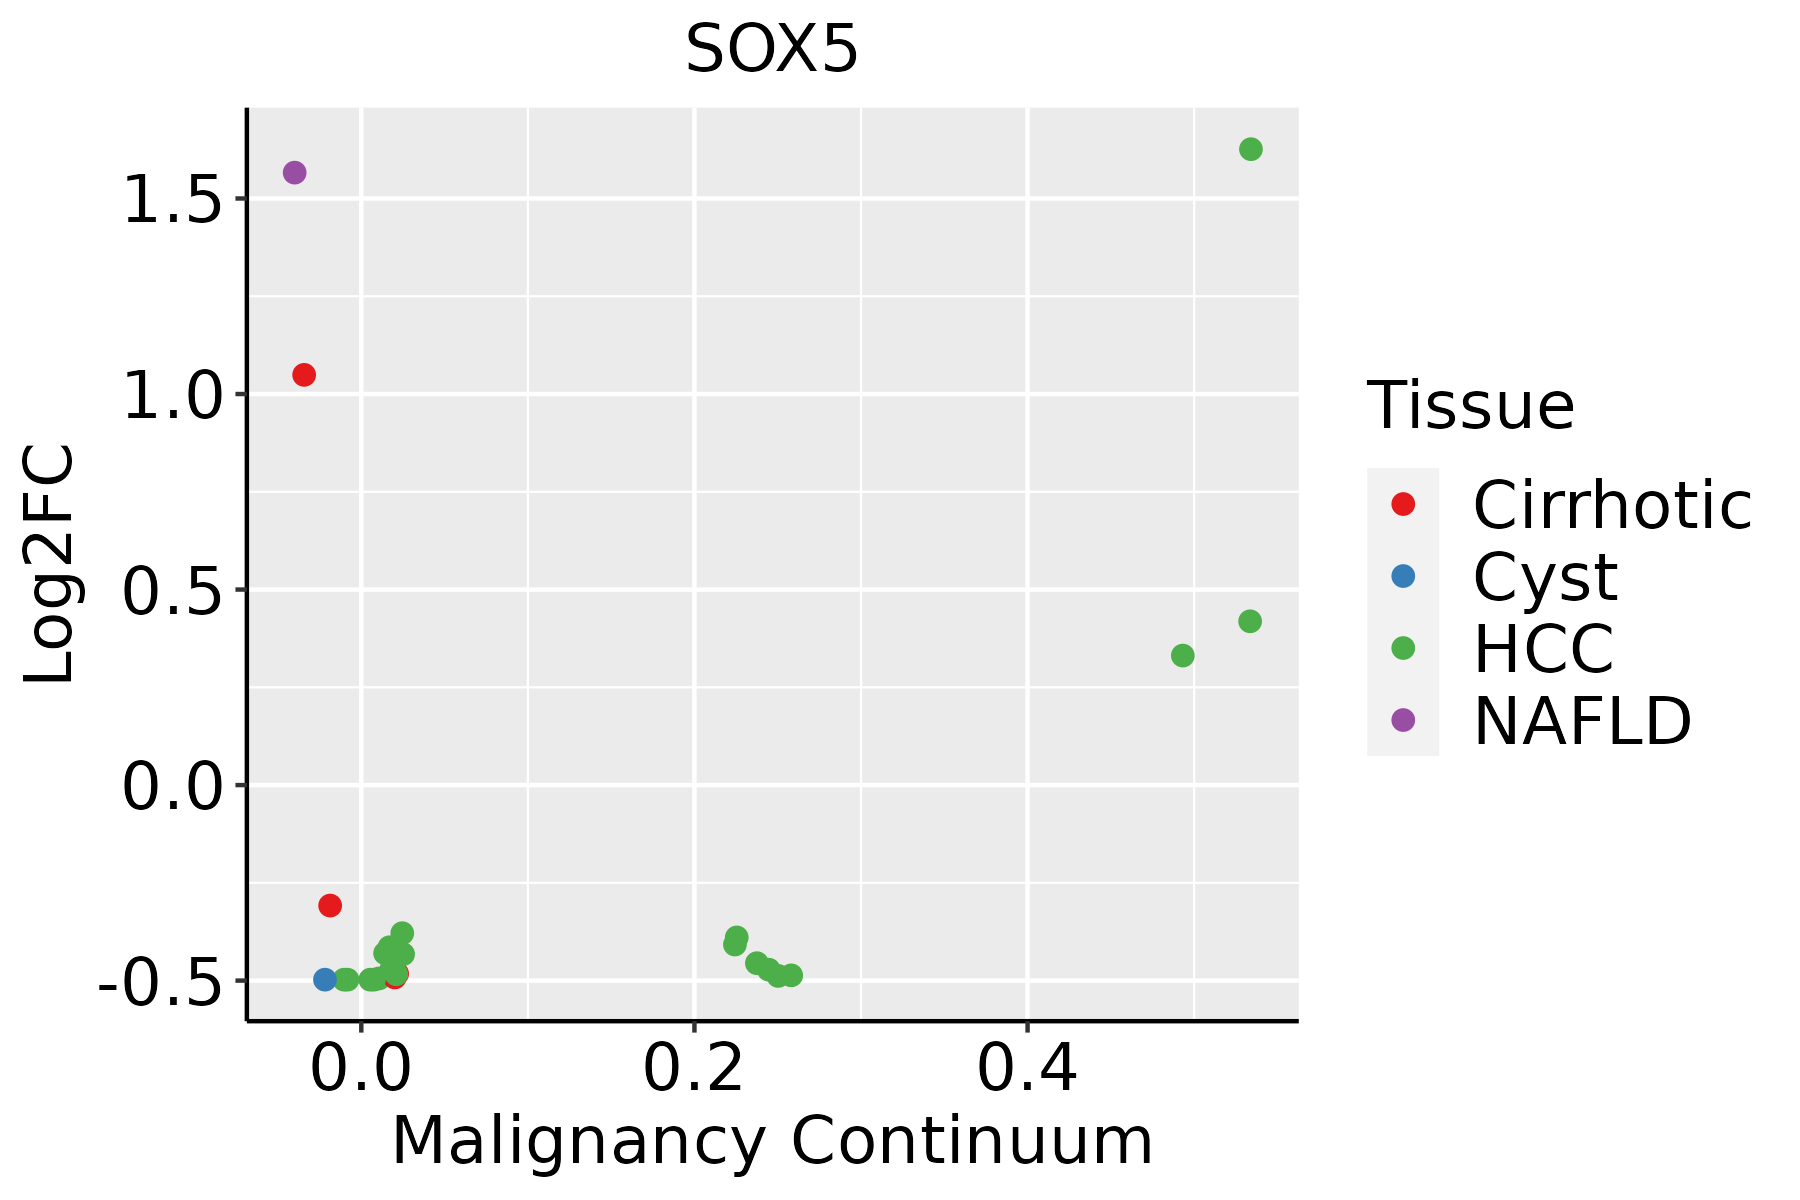
HCC: Hepatocellular carcinoma
NAFLD: Non-alcoholic fatty liver disease
LungThe image shows the transcriptomic changes along malignancy continuum.log2FC in expression of this searched gene in stem-like cells from each diseased tissue sample relative to stem-like cells in normal samples in each tissue plotted against the malignancy continuum. Samples are colored based on if they are from different disease stage.
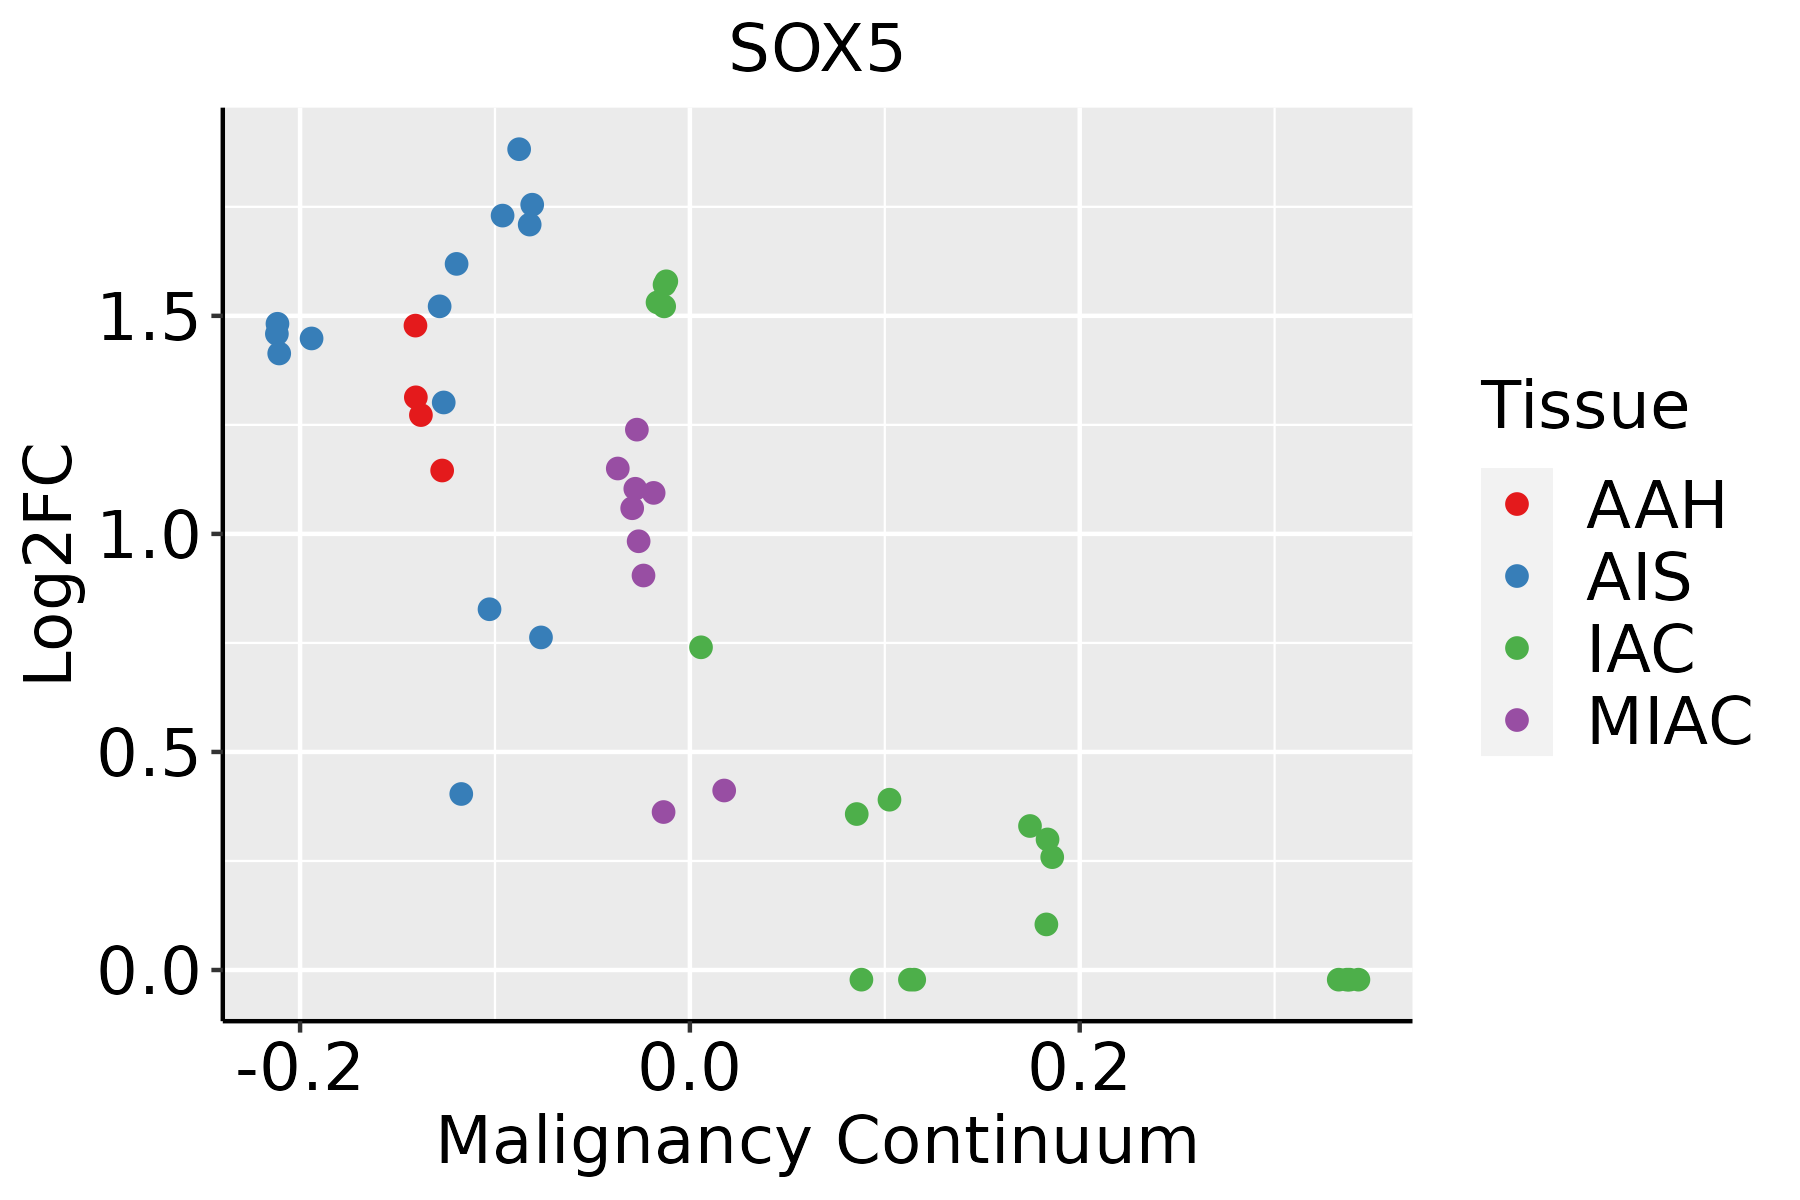
AAH: Atypical adenomatous hyperplasia
AIS: Adenocarcinoma in situ
IAC: Invasive lung adenocarcinoma
MIA: Minimally invasive adenocarcinoma
Oral CavityThe image shows the transcriptomic changes along malignancy continuum.log2FC in expression of this searched gene in stem-like cells from each diseased tissue sample relative to stem-like cells in normal samples in each tissue plotted against the malignancy continuum. Samples are colored based on if they are from different disease stage.
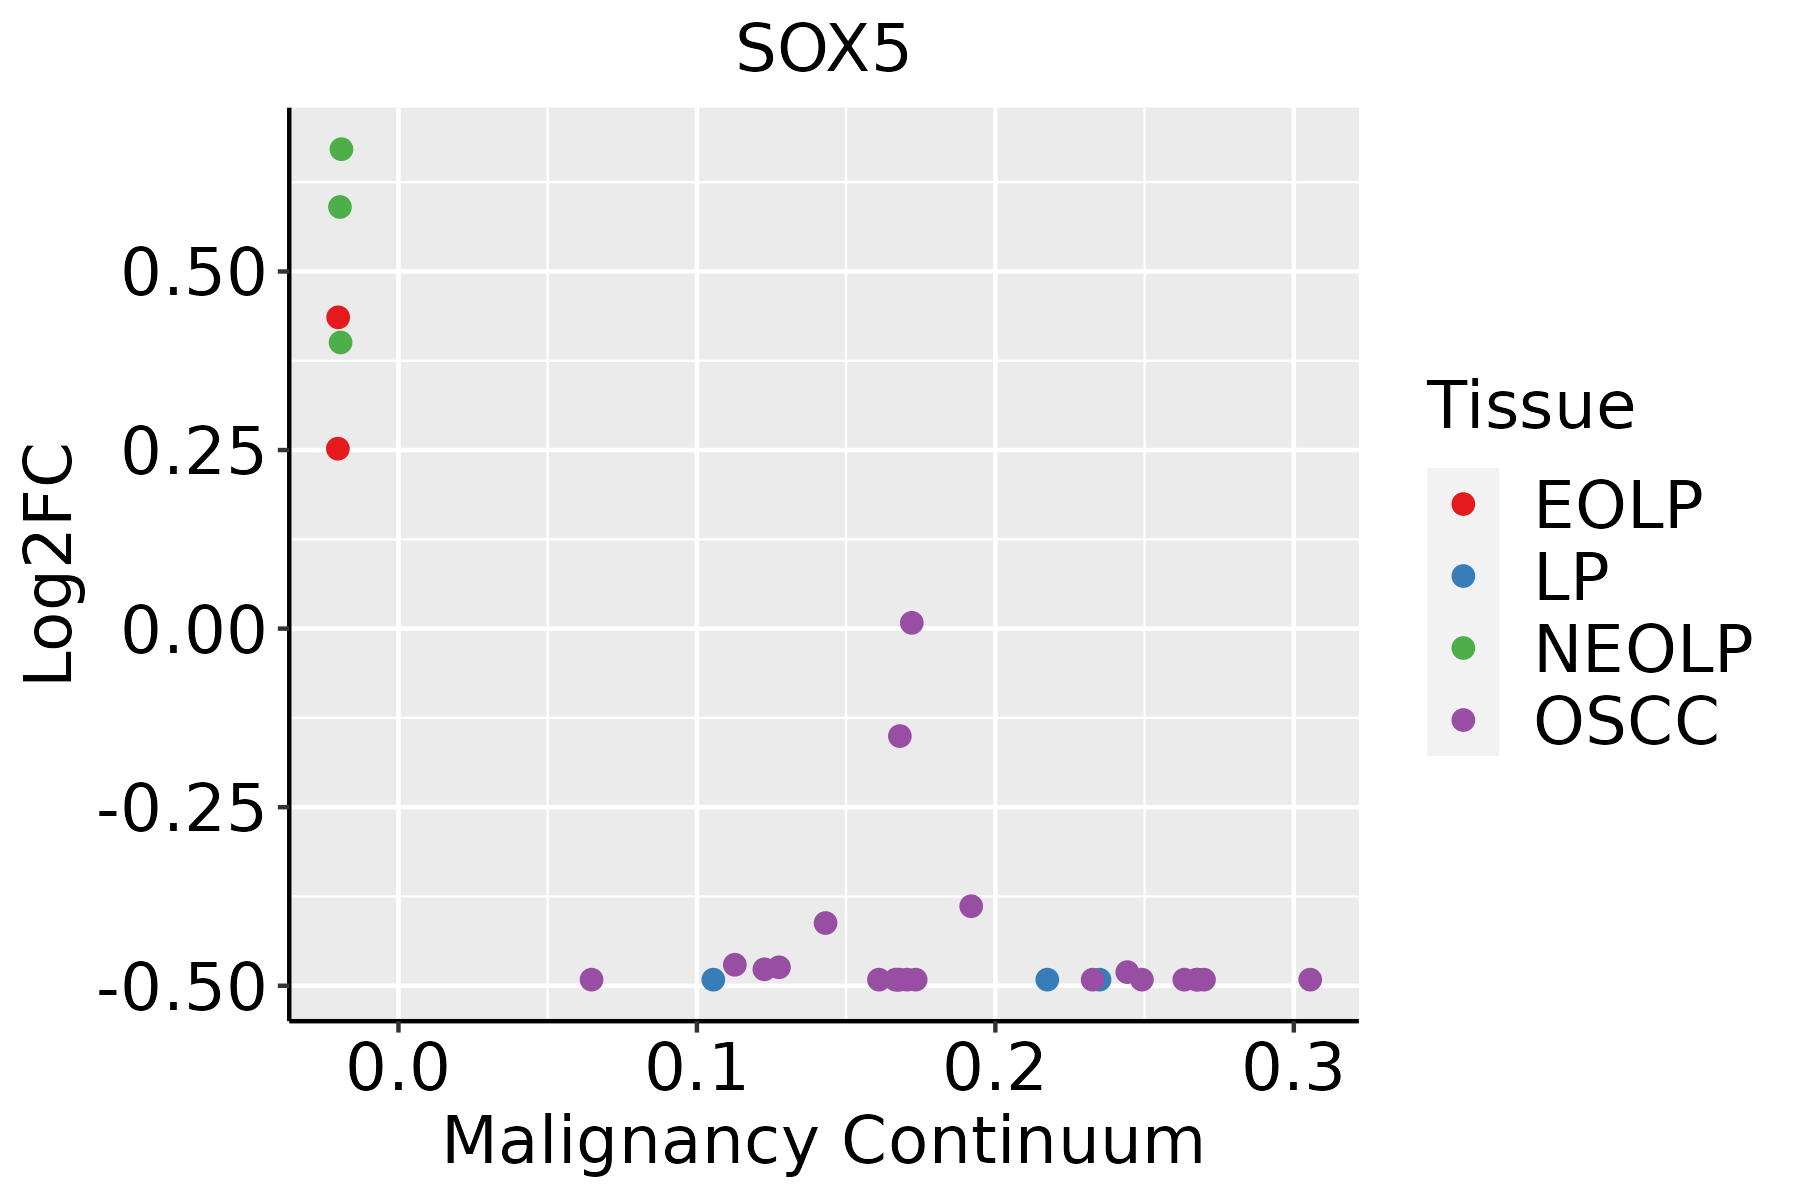
EOLP: Erosive Oral lichen planus
LP: leukoplakia
NEOLP: Non-erosive oral lichen planus
OSCC: Oral squamous cell carcinoma
SkinThe image shows the transcriptomic changes along malignancy continuum.log2FC in expression of this searched gene in stem-like cells from each diseased tissue sample relative to stem-like cells in normal samples in each tissue plotted against the malignancy continuum. Samples are colored based on if they are from different disease stage.AK: Actinic keratosis
cSCC: Cutaneous squamous cell carcinoma
SCCIS:squamous cell carcinoma in situ
∗log2FC in expression of this searched gene in stem-like cells from each diseased tissue sample relative to stem-like cells in normal samples in each tissue plotted against the malignancy continuum. Samples are colored based on if they are from different disease stage.

Top

Malignant transformation related pathway analysis

check buttonFind out the enriched GO biological processes and KEGG pathways involved in transition from healthy to precancer to cancer
check button Figure of enriched GO biological processes.
TissueDisease StageEnriched GO biological Processes
ColorectumADGO analysis - Figure of enriched GO biological processes: Top 15 enriched GO BP terms are showed in the bar plot of each disease state in each tissue. Each row represents a significant GO biological process which is colored according to the -log10(p.adjust).
ColorectumSERGO analysis - Figure of enriched GO biological processes: Top 15 enriched GO BP terms are showed in the bar plot of each disease state in each tissue. Each row represents a significant GO biological process which is colored according to the -log10(p.adjust).
ColorectumMSSGO analysis - Figure of enriched GO biological processes: Top 15 enriched GO BP terms are showed in the bar plot of each disease state in each tissue. Each row represents a significant GO biological process which is colored according to the -log10(p.adjust).
ColorectumMSI-HGO analysis - Figure of enriched GO biological processes: Top 15 enriched GO BP terms are showed in the bar plot of each disease state in each tissue. Each row represents a significant GO biological process which is colored according to the -log10(p.adjust).
ColorectumFAPGO analysis - Figure of enriched GO biological processes: Top 15 enriched GO BP terms are showed in the bar plot of each disease state in each tissue. Each row represents a significant GO biological process which is colored according to the -log10(p.adjust).
∗Top 15 enriched GO BP terms are showed in the bar plot of each disease state in each tissue. Each row represents a significant GO biological process which is colored according to the -log10(p.adjust).
Page: 1 2 3 4 5 6 7 8 9 

check button Enriched GO biological processes.
GO IDTissueDisease StageDescriptionGene RatioBg Ratiopvaluep.adjustCount
GO:00715596EndometriumAEHresponse to transforming growth factor beta53/2100256/187237.01e-061.69e-0453
GO:00715606EndometriumAEHcellular response to transforming growth factor beta stimulus51/2100250/187231.59e-053.32e-0451
GO:00488635EndometriumAEHstem cell differentiation40/2100206/187233.67e-043.99e-0340
GO:0061448EndometriumAEHconnective tissue development44/2100252/187231.92e-031.51e-0244
GO:007155914EndometriumEECresponse to transforming growth factor beta54/2168256/187238.25e-061.83e-0454
GO:007156014EndometriumEECcellular response to transforming growth factor beta stimulus52/2168250/187231.81e-053.41e-0452
GO:004886314EndometriumEECstem cell differentiation43/2168206/187238.48e-051.21e-0343
GO:00613511EndometriumEECneural precursor cell proliferation29/2168145/187232.24e-031.67e-0229
GO:00614481EndometriumEECconnective tissue development44/2168252/187233.51e-032.36e-0244
GO:00715593LiverNAFLDresponse to transforming growth factor beta51/1882256/187231.43e-066.58e-0551
GO:00715603LiverNAFLDcellular response to transforming growth factor beta stimulus48/1882250/187238.27e-062.76e-0448
GO:2000736LiverNAFLDregulation of stem cell differentiation14/188258/187231.48e-031.64e-0214
GO:00488632LiverNAFLDstem cell differentiation33/1882206/187234.81e-033.81e-0233
GO:007155911LiverCirrhoticresponse to transforming growth factor beta96/4634256/187233.55e-066.09e-0596
GO:007156011LiverCirrhoticcellular response to transforming growth factor beta stimulus93/4634250/187237.34e-061.13e-0493
GO:20007361LiverCirrhoticregulation of stem cell differentiation26/463458/187236.65e-045.04e-0326
GO:0072497LiverCirrhoticmesenchymal stem cell differentiation7/463411/187237.11e-033.41e-027
GO:004886311LiverCirrhoticstem cell differentiation66/4634206/187231.06e-024.68e-0266
GO:007155921LiverHCCresponse to transforming growth factor beta141/7958256/187233.08e-053.16e-04141
GO:007156021LiverHCCcellular response to transforming growth factor beta stimulus137/7958250/187235.47e-055.14e-04137
Page: 1 2 3 

check button Enriched KEGG pathways.
Pathway IDTissueDisease StageDescriptionGene RatioBg Ratiopvaluep.adjustqvalueCount
Page: 1 

Top

Cell-cell communication analysis

check buttonIdentification of potential cell-cell interactions between two cell types and their ligand-receptor pairs for different disease states
LigandReceptorLRpairPathwayTissueDisease Stage
Page: 1 

Top

Single-cell gene regulatory network inference analysis

check buttonFind out the significant the regulons (TFs) and the target genes of each regulon across cell types for different disease states
TFCell TypeTissueDisease StageTarget GeneRSSRegulon Activity
SOX5BASCervixCCSNCAIP,TNFRSF18,RARRES1, etc.1.32e-03The dot plots of a searched regulon are shown for all cell subpopulations in each disease state of each tissue based on the regulon specific score inferred using pySCENIC and by calculating the average expression.
SOX5COLCervixCCSNCAIP,TNFRSF18,RARRES1, etc.5.09e-03The dot plots of a searched regulon are shown for all cell subpopulations in each disease state of each tissue based on the regulon specific score inferred using pySCENIC and by calculating the average expression.
SOX5COLCervixN_HPVSNCAIP,TNFRSF18,RARRES1, etc.4.87e-01The dot plots of a searched regulon are shown for all cell subpopulations in each disease state of each tissue based on the regulon specific score inferred using pySCENIC and by calculating the average expression.
SOX5PLACervixCCDENND5B,FUT8,PLCG2, etc.2.61e-01The dot plots of a searched regulon are shown for all cell subpopulations in each disease state of each tissue based on the regulon specific score inferred using pySCENIC and by calculating the average expression.
SOX5BNCervixCCDENND5B,FUT8,PLCG2, etc.9.13e-02The dot plots of a searched regulon are shown for all cell subpopulations in each disease state of each tissue based on the regulon specific score inferred using pySCENIC and by calculating the average expression.
SOX5TUFColorectumADPCSK1N,LINC00907,GCG, etc.9.45e-03The dot plots of a searched regulon are shown for all cell subpopulations in each disease state of each tissue based on the regulon specific score inferred using pySCENIC and by calculating the average expression.
SOX5EEColorectumADPCSK1N,LINC00907,GCG, etc.6.83e-02The dot plots of a searched regulon are shown for all cell subpopulations in each disease state of each tissue based on the regulon specific score inferred using pySCENIC and by calculating the average expression.
SOX5CTColorectumADPCSK1N,LINC00907,GCG, etc.1.21e-02The dot plots of a searched regulon are shown for all cell subpopulations in each disease state of each tissue based on the regulon specific score inferred using pySCENIC and by calculating the average expression.
SOX5SSCColorectumADPCSK1N,LINC00907,GCG, etc.-4.44e-16The dot plots of a searched regulon are shown for all cell subpopulations in each disease state of each tissue based on the regulon specific score inferred using pySCENIC and by calculating the average expression.
SOX5EEColorectumADJRIMBP2,PTPRN2,CACNA1C, etc.1.84e-01The dot plots of a searched regulon are shown for all cell subpopulations in each disease state of each tissue based on the regulon specific score inferred using pySCENIC and by calculating the average expression.
∗The dot plots of a searched regulon are shown for all cell subpopulations in each disease state of each tissue based on the regulon specific score inferred using pySCENIC and by calculating the average expression.
Page: 1 2 3 4 

Top

Somatic mutation of malignant transformation related genes

check buttonAnnotation of somatic variants for genes involved in malignant transformation
Hugo SymbolVariant ClassVariant ClassificationdbSNP RSHGVScHGVSpHGVSp ShortSWISSPROTBIOTYPESIFTPolyPhenTumor Sample BarcodeTissueHistologySexAgeStageTherapy TypesDrugsOutcome
SOX5SNVMissense_Mutationc.991N>Tp.Pro331Serp.P331SP35711protein_codingtolerated(0.13)probably_damaging(0.999)TCGA-A8-A07B-01Breastbreast invasive carcinomaFemale>=65I/IIUnknownUnknownSD
SOX5SNVMissense_Mutationc.2099N>Ap.Ser700Asnp.S700NP35711protein_codingtolerated(0.14)possibly_damaging(0.842)TCGA-AO-A0J9-01Breastbreast invasive carcinomaFemale<65III/IVChemotherapycyclophosphamidePD
SOX5SNVMissense_Mutationc.1328G>Cp.Arg443Thrp.R443TP35711protein_codingtolerated(0.3)probably_damaging(0.998)TCGA-D8-A1JA-01Breastbreast invasive carcinomaFemale<65III/IVChemotherapyadriamycinPD
SOX5SNVMissense_Mutationc.1213N>Ap.Asp405Asnp.D405NP35711protein_codingdeleterious(0.01)benign(0.131)TCGA-D8-A27G-01Breastbreast invasive carcinomaFemale>=65I/IIUnknownUnknownSD
SOX5insertionNonsense_Mutationnovelc.1835_1836insATAAp.Ser613Terp.S613*P35711protein_codingTCGA-A7-A26I-01Breastbreast invasive carcinomaFemale>=65I/IIChemotherapycytoxanSD
SOX5insertionIn_Frame_Insnovelc.1835_1836insTAAGTATAAp.Leu612_Ser613insLysTyrAsnp.L612_S613insKYNP35711protein_codingTCGA-AC-A3QQ-01Breastbreast invasive carcinomaFemale<65I/IIUnknownUnknownSD
SOX5insertionFrame_Shift_Insnovelc.73_74insTTCTTp.Glu25ValfsTer8p.E25Vfs*8P35711protein_codingTCGA-AR-A0U0-01Breastbreast invasive carcinomaFemale>=65I/IIUnknownUnknownSD
SOX5insertionFrame_Shift_Insnovelc.2199_2200insCCAGCCAGGCTGGTCTCGAACTCCTGGGCp.Glu734ProfsTer25p.E734Pfs*25P35711protein_codingTCGA-BH-A0BV-01Breastbreast invasive carcinomaFemale>=65I/IIChemotherapydoxorubicinSD
SOX5SNVMissense_Mutationnovelc.1970N>Ap.Arg657Glnp.R657QP35711protein_codingdeleterious(0.02)probably_damaging(0.973)TCGA-C5-A7UI-01Cervixcervical & endocervical cancerFemale<65I/IIUnknownUnknownSD
SOX5SNVMissense_Mutationc.214N>Gp.Leu72Valp.L72VP35711protein_codingtolerated_low_confidence(0.34)benign(0.028)TCGA-EK-A3GM-01Cervixcervical & endocervical cancerFemale>=65I/IIUnknownUnknownSD
Page: 1 2 3 4 5 6 7 8 9 10 11 12 13 

Top

Related drugs of malignant transformation related genes

check buttonIdentification of chemicals and drugs interact with genes involved in malignant transfromation
(DGIdb 4.0)
Entrez IDSymbolCategoryInteraction TypesDrug Claim NameDrug NamePMIDs
Page: 1