
|
|||||
|
 | |
| |
| |
| |
| |
| |
|
Gene: SOX2 |
Gene summary for SOX2 |
| Gene information | Species | Human | Gene symbol | SOX2 | Gene ID | 6657 |
| Gene name | SRY-box transcription factor 2 | |
| Gene Alias | ANOP3 | |
| Cytomap | 3q26.33 | |
| Gene Type | protein-coding | GO ID | GO:0000122 | UniProtAcc | A0A0U3FYV6 |
Top |
Malignant transformation analysis |
| Identification of the aberrant gene expression in precancerous and cancerous lesions by comparing the gene expression of stem-like cells in diseased tissues with normal stem cells |
| Entrez ID | Symbol | Replicates | Species | Organ | Tissue | Adj P-value | Log2FC | Malignancy |
| 6657 | SOX2 | LZE2T | Human | Esophagus | ESCC | 9.01e-06 | 1.33e+00 | 0.082 |
| 6657 | SOX2 | LZE4T | Human | Esophagus | ESCC | 6.78e-19 | 9.94e-01 | 0.0811 |
| 6657 | SOX2 | LZE5T | Human | Esophagus | ESCC | 2.93e-05 | 5.15e-01 | 0.0514 |
| 6657 | SOX2 | LZE7T | Human | Esophagus | ESCC | 2.09e-27 | 2.04e+00 | 0.0667 |
| 6657 | SOX2 | LZE20T | Human | Esophagus | ESCC | 6.79e-12 | 7.05e-01 | 0.0662 |
| 6657 | SOX2 | LZE22D1 | Human | Esophagus | HGIN | 6.20e-05 | 2.23e-01 | 0.0595 |
| 6657 | SOX2 | LZE22T | Human | Esophagus | ESCC | 9.69e-11 | 8.28e-01 | 0.068 |
| 6657 | SOX2 | LZE24T | Human | Esophagus | ESCC | 3.95e-30 | 1.05e+00 | 0.0596 |
| 6657 | SOX2 | LZE22D3 | Human | Esophagus | HGIN | 2.69e-02 | 5.15e-01 | 0.0653 |
| 6657 | SOX2 | LZE21T | Human | Esophagus | ESCC | 6.47e-17 | 1.77e+00 | 0.0655 |
| 6657 | SOX2 | P1T-E | Human | Esophagus | ESCC | 4.96e-18 | 1.10e+00 | 0.0875 |
| 6657 | SOX2 | P2T-E | Human | Esophagus | ESCC | 7.74e-83 | 1.99e+00 | 0.1177 |
| 6657 | SOX2 | P4T-E | Human | Esophagus | ESCC | 3.83e-60 | 1.87e+00 | 0.1323 |
| 6657 | SOX2 | P5T-E | Human | Esophagus | ESCC | 3.67e-98 | 2.57e+00 | 0.1327 |
| 6657 | SOX2 | P8T-E | Human | Esophagus | ESCC | 8.06e-70 | 1.53e+00 | 0.0889 |
| 6657 | SOX2 | P9T-E | Human | Esophagus | ESCC | 1.72e-81 | 2.57e+00 | 0.1131 |
| 6657 | SOX2 | P10T-E | Human | Esophagus | ESCC | 1.38e-109 | 2.78e+00 | 0.116 |
| 6657 | SOX2 | P11T-E | Human | Esophagus | ESCC | 1.79e-18 | 8.97e-01 | 0.1426 |
| 6657 | SOX2 | P12T-E | Human | Esophagus | ESCC | 1.10e-116 | 3.35e+00 | 0.1122 |
| 6657 | SOX2 | P15T-E | Human | Esophagus | ESCC | 3.11e-87 | 3.08e+00 | 0.1149 |
| Page: 1 2 3 4 |
| Tissue | Expression Dynamics | Abbreviation |
| Esophagus | 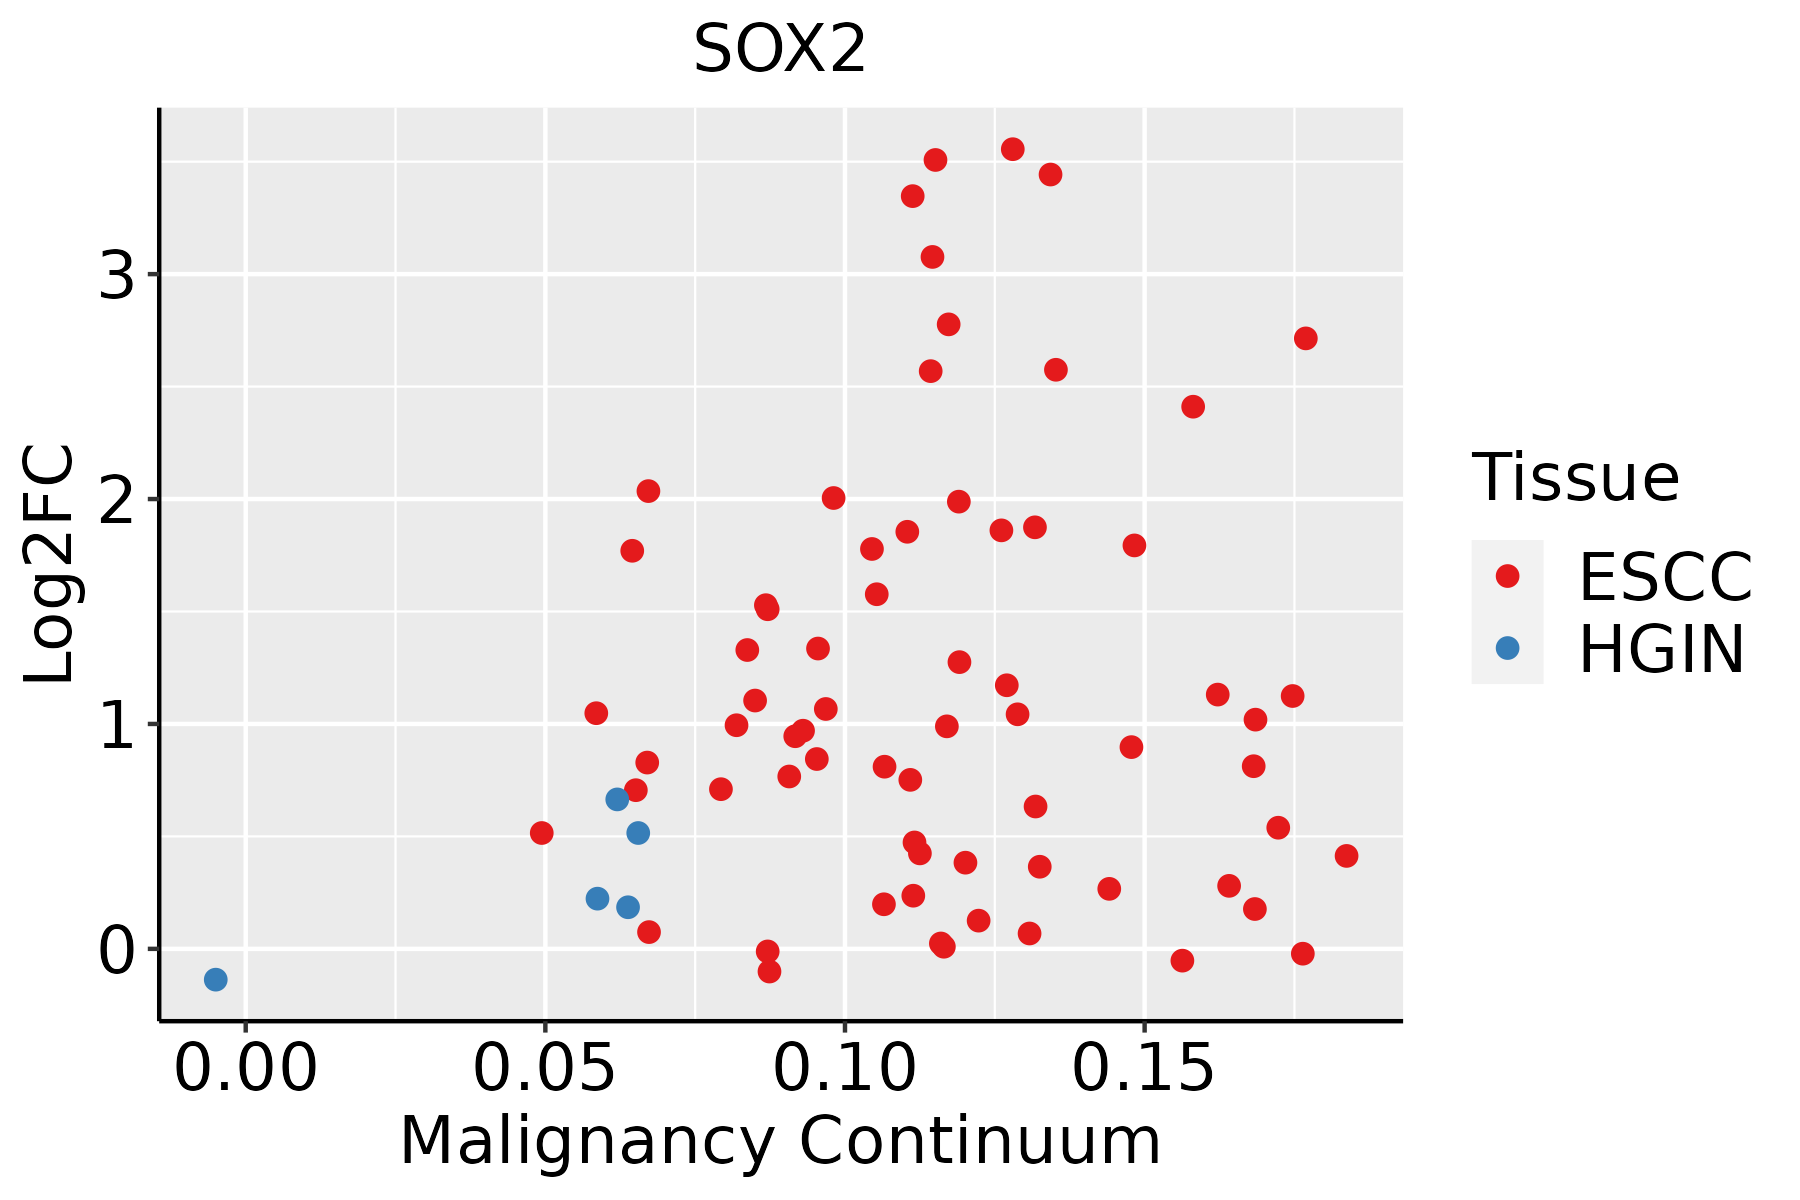 | ESCC: Esophageal squamous cell carcinoma |
| HGIN: High-grade intraepithelial neoplasias | ||
| LGIN: Low-grade intraepithelial neoplasias | ||
| Oral Cavity |  | EOLP: Erosive Oral lichen planus |
| LP: leukoplakia | ||
| NEOLP: Non-erosive oral lichen planus | ||
| OSCC: Oral squamous cell carcinoma | ||
| Skin | 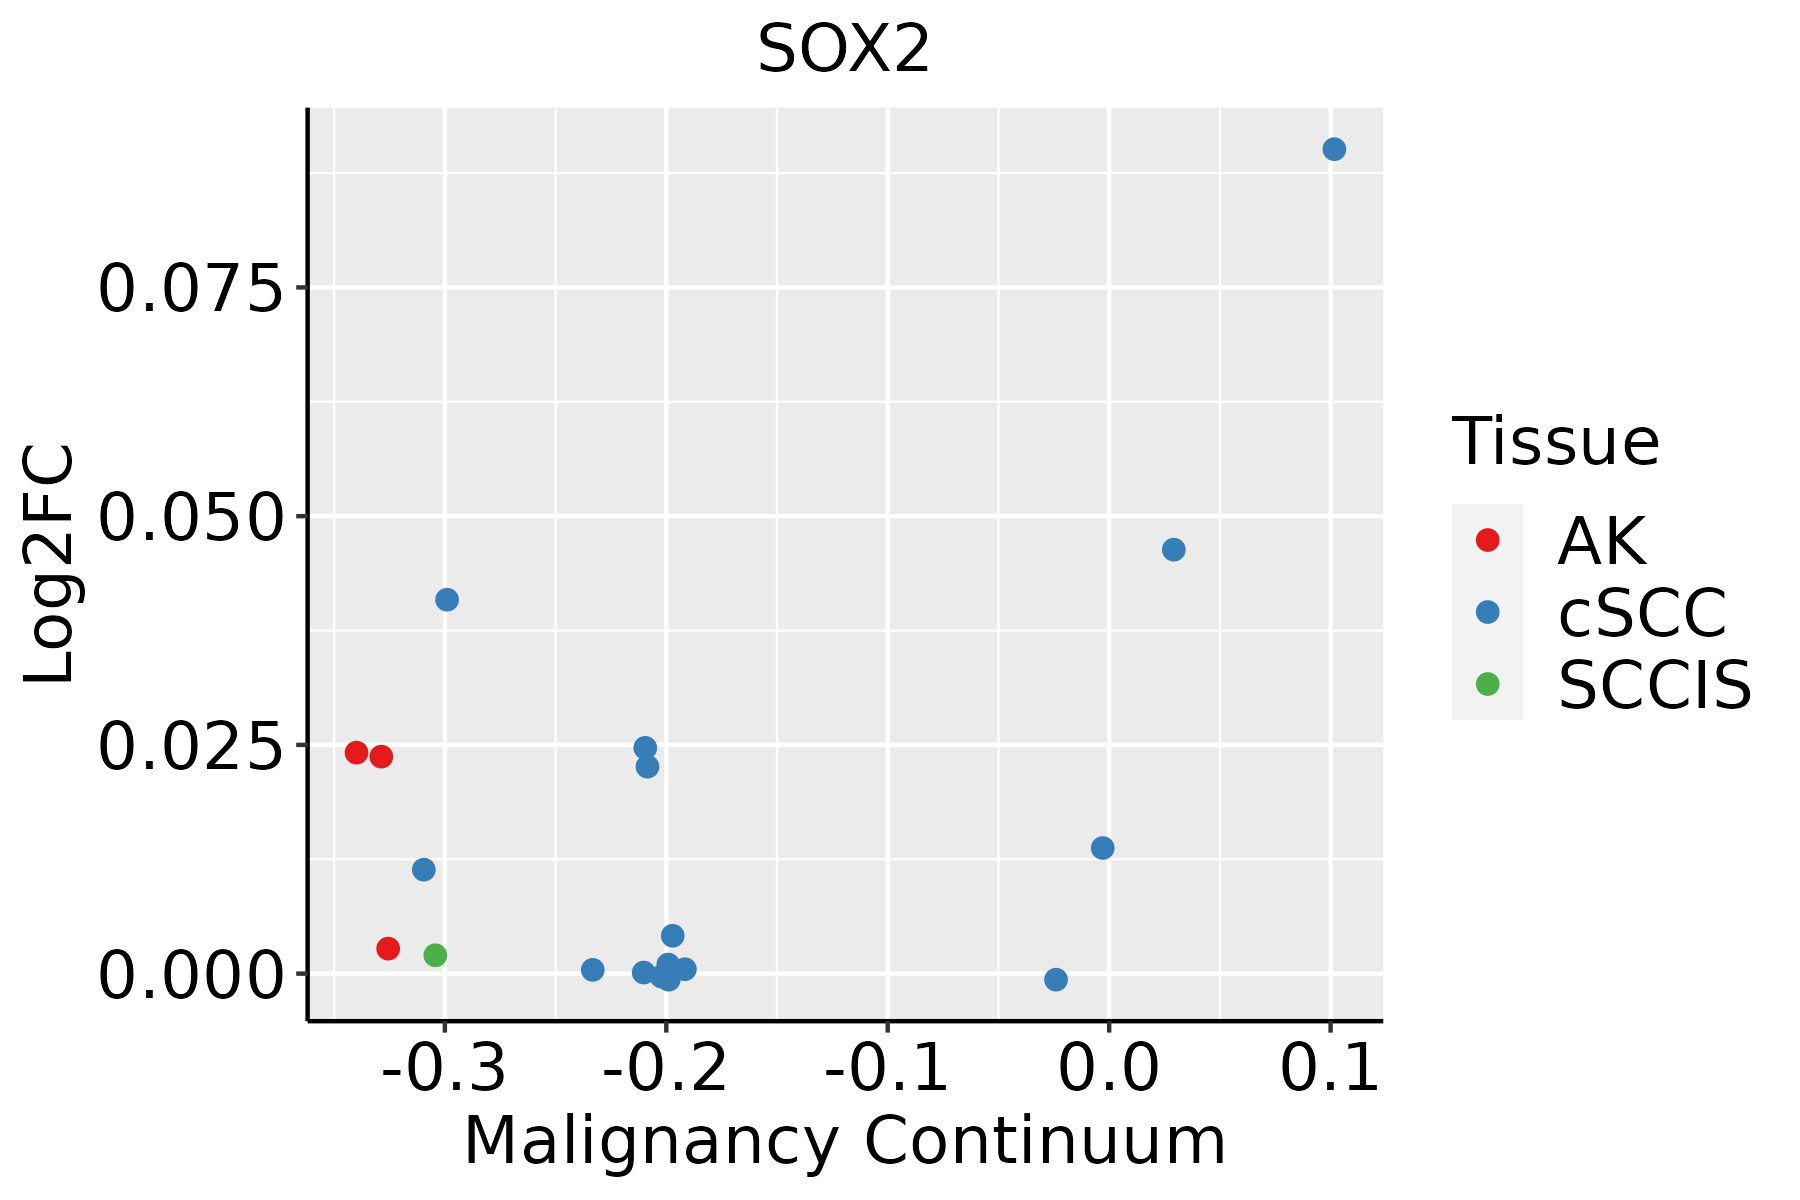 | AK: Actinic keratosis |
| cSCC: Cutaneous squamous cell carcinoma | ||
| SCCIS:squamous cell carcinoma in situ |
| ∗log2FC in expression of this searched gene in stem-like cells from each diseased tissue sample relative to stem-like cells in normal samples in each tissue plotted against the malignancy continuum. Samples are colored based on if they are from different disease stage. |
Top |
Malignant transformation related pathway analysis |
| Find out the enriched GO biological processes and KEGG pathways involved in transition from healthy to precancer to cancer |
| Tissue | Disease Stage | Enriched GO biological Processes |
| Colorectum | AD |  |
| Colorectum | SER |  |
| Colorectum | MSS |  |
| Colorectum | MSI-H |  |
| Colorectum | FAP |  |
| ∗Top 15 enriched GO BP terms are showed in the bar plot of each disease state in each tissue. Each row represents a significant GO biological process which is colored according to the -log10(p.adjust). |
| Page: 1 2 3 4 5 6 7 8 9 |
| GO ID | Tissue | Disease Stage | Description | Gene Ratio | Bg Ratio | pvalue | p.adjust | Count |
| GO:004328126 | Esophagus | HGIN | regulation of cysteine-type endopeptidase activity involved in apoptotic process | 59/2587 | 209/18723 | 3.39e-08 | 1.97e-06 | 59 |
| GO:200011626 | Esophagus | HGIN | regulation of cysteine-type endopeptidase activity | 63/2587 | 235/18723 | 9.71e-08 | 5.02e-06 | 63 |
| GO:005254726 | Esophagus | HGIN | regulation of peptidase activity | 102/2587 | 461/18723 | 6.29e-07 | 2.72e-05 | 102 |
| GO:000632516 | Esophagus | HGIN | chromatin organization | 92/2587 | 409/18723 | 1.05e-06 | 4.16e-05 | 92 |
| GO:005254826 | Esophagus | HGIN | regulation of endopeptidase activity | 96/2587 | 432/18723 | 1.09e-06 | 4.30e-05 | 96 |
| GO:00198277 | Esophagus | HGIN | stem cell population maintenance | 39/2587 | 131/18723 | 1.63e-06 | 6.14e-05 | 39 |
| GO:00987278 | Esophagus | HGIN | maintenance of cell number | 39/2587 | 134/18723 | 3.02e-06 | 1.03e-04 | 39 |
| GO:004873225 | Esophagus | HGIN | gland development | 88/2587 | 436/18723 | 1.34e-04 | 2.71e-03 | 88 |
| GO:000164917 | Esophagus | HGIN | osteoblast differentiation | 50/2587 | 229/18723 | 5.88e-04 | 8.30e-03 | 50 |
| GO:003011116 | Esophagus | HGIN | regulation of Wnt signaling pathway | 65/2587 | 328/18723 | 1.53e-03 | 1.77e-02 | 65 |
| GO:001605516 | Esophagus | HGIN | Wnt signaling pathway | 83/2587 | 444/18723 | 2.27e-03 | 2.33e-02 | 83 |
| GO:019873816 | Esophagus | HGIN | cell-cell signaling by wnt | 83/2587 | 446/18723 | 2.58e-03 | 2.55e-02 | 83 |
| GO:0035019 | Esophagus | HGIN | somatic stem cell population maintenance | 13/2587 | 42/18723 | 3.32e-03 | 3.12e-02 | 13 |
| GO:006082816 | Esophagus | HGIN | regulation of canonical Wnt signaling pathway | 50/2587 | 253/18723 | 5.27e-03 | 4.35e-02 | 50 |
| GO:000150316 | Esophagus | HGIN | ossification | 75/2587 | 408/18723 | 5.49e-03 | 4.49e-02 | 75 |
| GO:0048732111 | Esophagus | ESCC | gland development | 269/8552 | 436/18723 | 7.81e-12 | 2.95e-10 | 269 |
| GO:2000116111 | Esophagus | ESCC | regulation of cysteine-type endopeptidase activity | 158/8552 | 235/18723 | 1.67e-11 | 5.90e-10 | 158 |
| GO:0043281111 | Esophagus | ESCC | regulation of cysteine-type endopeptidase activity involved in apoptotic process | 143/8552 | 209/18723 | 2.12e-11 | 7.31e-10 | 143 |
| GO:001605517 | Esophagus | ESCC | Wnt signaling pathway | 268/8552 | 444/18723 | 2.32e-10 | 6.58e-09 | 268 |
| GO:019873817 | Esophagus | ESCC | cell-cell signaling by wnt | 269/8552 | 446/18723 | 2.41e-10 | 6.79e-09 | 269 |
| Page: 1 2 3 4 5 6 7 |
| Pathway ID | Tissue | Disease Stage | Description | Gene Ratio | Bg Ratio | pvalue | p.adjust | qvalue | Count |
| hsa0439018 | Esophagus | ESCC | Hippo signaling pathway | 92/4205 | 157/8465 | 1.46e-02 | 3.31e-02 | 1.69e-02 | 92 |
| hsa0439019 | Esophagus | ESCC | Hippo signaling pathway | 92/4205 | 157/8465 | 1.46e-02 | 3.31e-02 | 1.69e-02 | 92 |
| hsa0439016 | Oral cavity | OSCC | Hippo signaling pathway | 86/3704 | 157/8465 | 3.30e-03 | 8.24e-03 | 4.20e-03 | 86 |
| hsa0439017 | Oral cavity | OSCC | Hippo signaling pathway | 86/3704 | 157/8465 | 3.30e-03 | 8.24e-03 | 4.20e-03 | 86 |
| hsa0439025 | Oral cavity | NEOLP | Hippo signaling pathway | 35/1112 | 157/8465 | 9.91e-04 | 4.85e-03 | 3.05e-03 | 35 |
| hsa0439035 | Oral cavity | NEOLP | Hippo signaling pathway | 35/1112 | 157/8465 | 9.91e-04 | 4.85e-03 | 3.05e-03 | 35 |
| Page: 1 |
Top |
Cell-cell communication analysis |
| Identification of potential cell-cell interactions between two cell types and their ligand-receptor pairs for different disease states |
| Ligand | Receptor | LRpair | Pathway | Tissue | Disease Stage |
| Page: 1 |
Top |
Single-cell gene regulatory network inference analysis |
| Find out the significant the regulons (TFs) and the target genes of each regulon across cell types for different disease states |
| TF | Cell Type | Tissue | Disease Stage | Target Gene | RSS | Regulon Activity |
| SOX2 | TRANS | Cervix | N_HPV | AMTN,CSTA,LYPD3, etc. | 2.21e-01 |  |
| SOX2 | TUF | Colorectum | AD | SMOC2,NR2F1,LRP4, etc. | 8.69e-03 |  |
| SOX2 | SSC | Colorectum | AD | SMOC2,NR2F1,LRP4, etc. | 0.00e+00 | |
| SOX2 | STM | Colorectum | MSI-H | SMOC2,NR2F1,LRP4, etc. | 1.31e-01 |  |
| SOX2 | STM | Colorectum | SER | SMOC2,NR2F1,LRP4, etc. | 4.18e-02 |  |
| SOX2 | CILIA | Lung | AAH | CAPS,AC025580.1,ALDH1A1, etc. | 6.61e-01 |  |
| SOX2 | ABP | Lung | ADJ | CAPS,AC025580.1,ALDH1A1, etc. | 2.88e-03 |  |
| SOX2 | CILIA | Lung | ADJ | CAPS,AC025580.1,ALDH1A1, etc. | 4.86e-01 | |
| SOX2 | STM | Lung | ADJ | CAPS,AC025580.1,ALDH1A1, etc. | 1.85e-03 | |
| SOX2 | CLUB | Lung | AIS | CAPS,AC025580.1,ALDH1A1, etc. | 8.82e-02 |  |
| ∗The dot plots of a searched regulon are shown for all cell subpopulations in each disease state of each tissue based on the regulon specific score inferred using pySCENIC and by calculating the average expression. |
| Page: 1 2 |
Top |
Somatic mutation of malignant transformation related genes |
| Annotation of somatic variants for genes involved in malignant transformation |
| Hugo Symbol | Variant Class | Variant Classification | dbSNP RS | HGVSc | HGVSp | HGVSp Short | SWISSPROT | BIOTYPE | SIFT | PolyPhen | Tumor Sample Barcode | Tissue | Histology | Sex | Age | Stage | Therapy Types | Drugs | Outcome |
| SOX2 | SNV | Missense_Mutation | c.466C>T | p.Arg156Cys | p.R156C | P48431 | protein_coding | deleterious(0.01) | probably_damaging(0.993) | TCGA-A8-A09Z-01 | Breast | breast invasive carcinoma | Female | >=65 | I/II | Unknown | Unknown | SD | |
| SOX2 | SNV | Missense_Mutation | c.250N>A | p.Glu84Lys | p.E84K | P48431 | protein_coding | deleterious(0) | probably_damaging(0.989) | TCGA-E2-A10C-01 | Breast | breast invasive carcinoma | Female | <65 | I/II | Chemotherapy | cytoxan | SD | |
| SOX2 | SNV | Missense_Mutation | c.277G>A | p.Glu93Lys | p.E93K | P48431 | protein_coding | deleterious(0) | probably_damaging(0.991) | TCGA-2W-A8YY-01 | Cervix | cervical & endocervical cancer | Female | <65 | I/II | Chemotherapy | cisplatin | CR | |
| SOX2 | SNV | Missense_Mutation | c.796N>G | p.Gln266Glu | p.Q266E | P48431 | protein_coding | tolerated(0.25) | benign(0.072) | TCGA-C5-A7UC-01 | Cervix | cervical & endocervical cancer | Female | <65 | I/II | Unknown | Unknown | SD | |
| SOX2 | SNV | Missense_Mutation | c.472N>A | p.Asp158Asn | p.D158N | P48431 | protein_coding | deleterious(0.01) | benign(0.326) | TCGA-DS-A0VM-01 | Cervix | cervical & endocervical cancer | Female | <65 | I/II | Chemotherapy | cisplatin | PD | |
| SOX2 | SNV | Missense_Mutation | novel | c.198N>A | p.Met66Ile | p.M66I | P48431 | protein_coding | deleterious(0) | possibly_damaging(0.543) | TCGA-EA-A3HU-01 | Cervix | cervical & endocervical cancer | Female | <65 | I/II | Unknown | Unknown | SD |
| SOX2 | SNV | Missense_Mutation | c.602N>G | p.Asp201Gly | p.D201G | P48431 | protein_coding | deleterious(0) | probably_damaging(0.961) | TCGA-AA-A00N-01 | Colorectum | colon adenocarcinoma | Male | >=65 | I/II | Unknown | Unknown | PD | |
| SOX2 | SNV | Missense_Mutation | novel | c.838N>A | p.Gly280Ser | p.G280S | P48431 | protein_coding | tolerated(0.13) | benign(0.013) | TCGA-AD-6901-01 | Colorectum | colon adenocarcinoma | Male | >=65 | I/II | Chemotherapy | xeloda | PD |
| SOX2 | SNV | Missense_Mutation | c.644N>T | p.Thr215Ile | p.T215I | P48431 | protein_coding | deleterious(0.05) | benign(0.439) | TCGA-AD-6964-01 | Colorectum | colon adenocarcinoma | Male | <65 | III/IV | Chemotherapy | folfox | PD | |
| SOX2 | SNV | Missense_Mutation | novel | c.829N>C | p.Tyr277His | p.Y277H | P48431 | protein_coding | deleterious(0) | probably_damaging(0.999) | TCGA-AZ-4315-01 | Colorectum | colon adenocarcinoma | Male | <65 | I/II | Unknown | Unknown | SD |
| Page: 1 2 3 4 |
Top |
Related drugs of malignant transformation related genes |
| Identification of chemicals and drugs interact with genes involved in malignant transfromation |
| (DGIdb 4.0) |
| Entrez ID | Symbol | Category | Interaction Types | Drug Claim Name | Drug Name | PMIDs |
| Page: 1 |

Copyright 2023-Present -The University of Texas Health Science Center at Houston |