
|
|||||
|
 | |
| |
| |
| |
| |
| |
|
Gene: SOX13 |
Gene summary for SOX13 |
| Gene information | Species | Human | Gene symbol | SOX13 | Gene ID | 9580 |
| Gene name | SRY-box transcription factor 13 | |
| Gene Alias | ICA12 | |
| Cytomap | 1q32.1 | |
| Gene Type | protein-coding | GO ID | GO:0000122 | UniProtAcc | Q9UN79 |
Top |
Malignant transformation analysis |
| Identification of the aberrant gene expression in precancerous and cancerous lesions by comparing the gene expression of stem-like cells in diseased tissues with normal stem cells |
| Entrez ID | Symbol | Replicates | Species | Organ | Tissue | Adj P-value | Log2FC | Malignancy |
| 9580 | SOX13 | CCI_1 | Human | Cervix | CC | 1.40e-10 | 8.57e-01 | 0.528 |
| 9580 | SOX13 | CCI_3 | Human | Cervix | CC | 2.33e-04 | 5.73e-01 | 0.516 |
| 9580 | SOX13 | LZE2T | Human | Esophagus | ESCC | 1.11e-02 | 3.85e-01 | 0.082 |
| 9580 | SOX13 | LZE22T | Human | Esophagus | ESCC | 1.77e-03 | 2.21e-01 | 0.068 |
| 9580 | SOX13 | LZE21T | Human | Esophagus | ESCC | 8.05e-05 | 2.23e-01 | 0.0655 |
| 9580 | SOX13 | P2T-E | Human | Esophagus | ESCC | 7.63e-03 | 5.72e-02 | 0.1177 |
| 9580 | SOX13 | P4T-E | Human | Esophagus | ESCC | 6.13e-08 | 1.60e-01 | 0.1323 |
| 9580 | SOX13 | P5T-E | Human | Esophagus | ESCC | 1.72e-06 | 8.98e-02 | 0.1327 |
| 9580 | SOX13 | P8T-E | Human | Esophagus | ESCC | 4.27e-04 | 8.70e-02 | 0.0889 |
| 9580 | SOX13 | P9T-E | Human | Esophagus | ESCC | 5.99e-14 | 3.49e-01 | 0.1131 |
| 9580 | SOX13 | P10T-E | Human | Esophagus | ESCC | 2.53e-21 | 4.11e-01 | 0.116 |
| 9580 | SOX13 | P11T-E | Human | Esophagus | ESCC | 3.31e-02 | 1.62e-01 | 0.1426 |
| 9580 | SOX13 | P12T-E | Human | Esophagus | ESCC | 8.94e-07 | 1.08e-01 | 0.1122 |
| 9580 | SOX13 | P15T-E | Human | Esophagus | ESCC | 4.19e-12 | 1.89e-01 | 0.1149 |
| 9580 | SOX13 | P16T-E | Human | Esophagus | ESCC | 3.33e-12 | 1.86e-01 | 0.1153 |
| 9580 | SOX13 | P17T-E | Human | Esophagus | ESCC | 1.86e-03 | 1.44e-01 | 0.1278 |
| 9580 | SOX13 | P23T-E | Human | Esophagus | ESCC | 2.59e-07 | 1.98e-01 | 0.108 |
| 9580 | SOX13 | P26T-E | Human | Esophagus | ESCC | 1.63e-07 | 1.08e-01 | 0.1276 |
| 9580 | SOX13 | P27T-E | Human | Esophagus | ESCC | 4.59e-16 | 1.42e-01 | 0.1055 |
| 9580 | SOX13 | P28T-E | Human | Esophagus | ESCC | 9.86e-33 | 5.75e-01 | 0.1149 |
| Page: 1 2 3 |
| Tissue | Expression Dynamics | Abbreviation |
| Cervix | 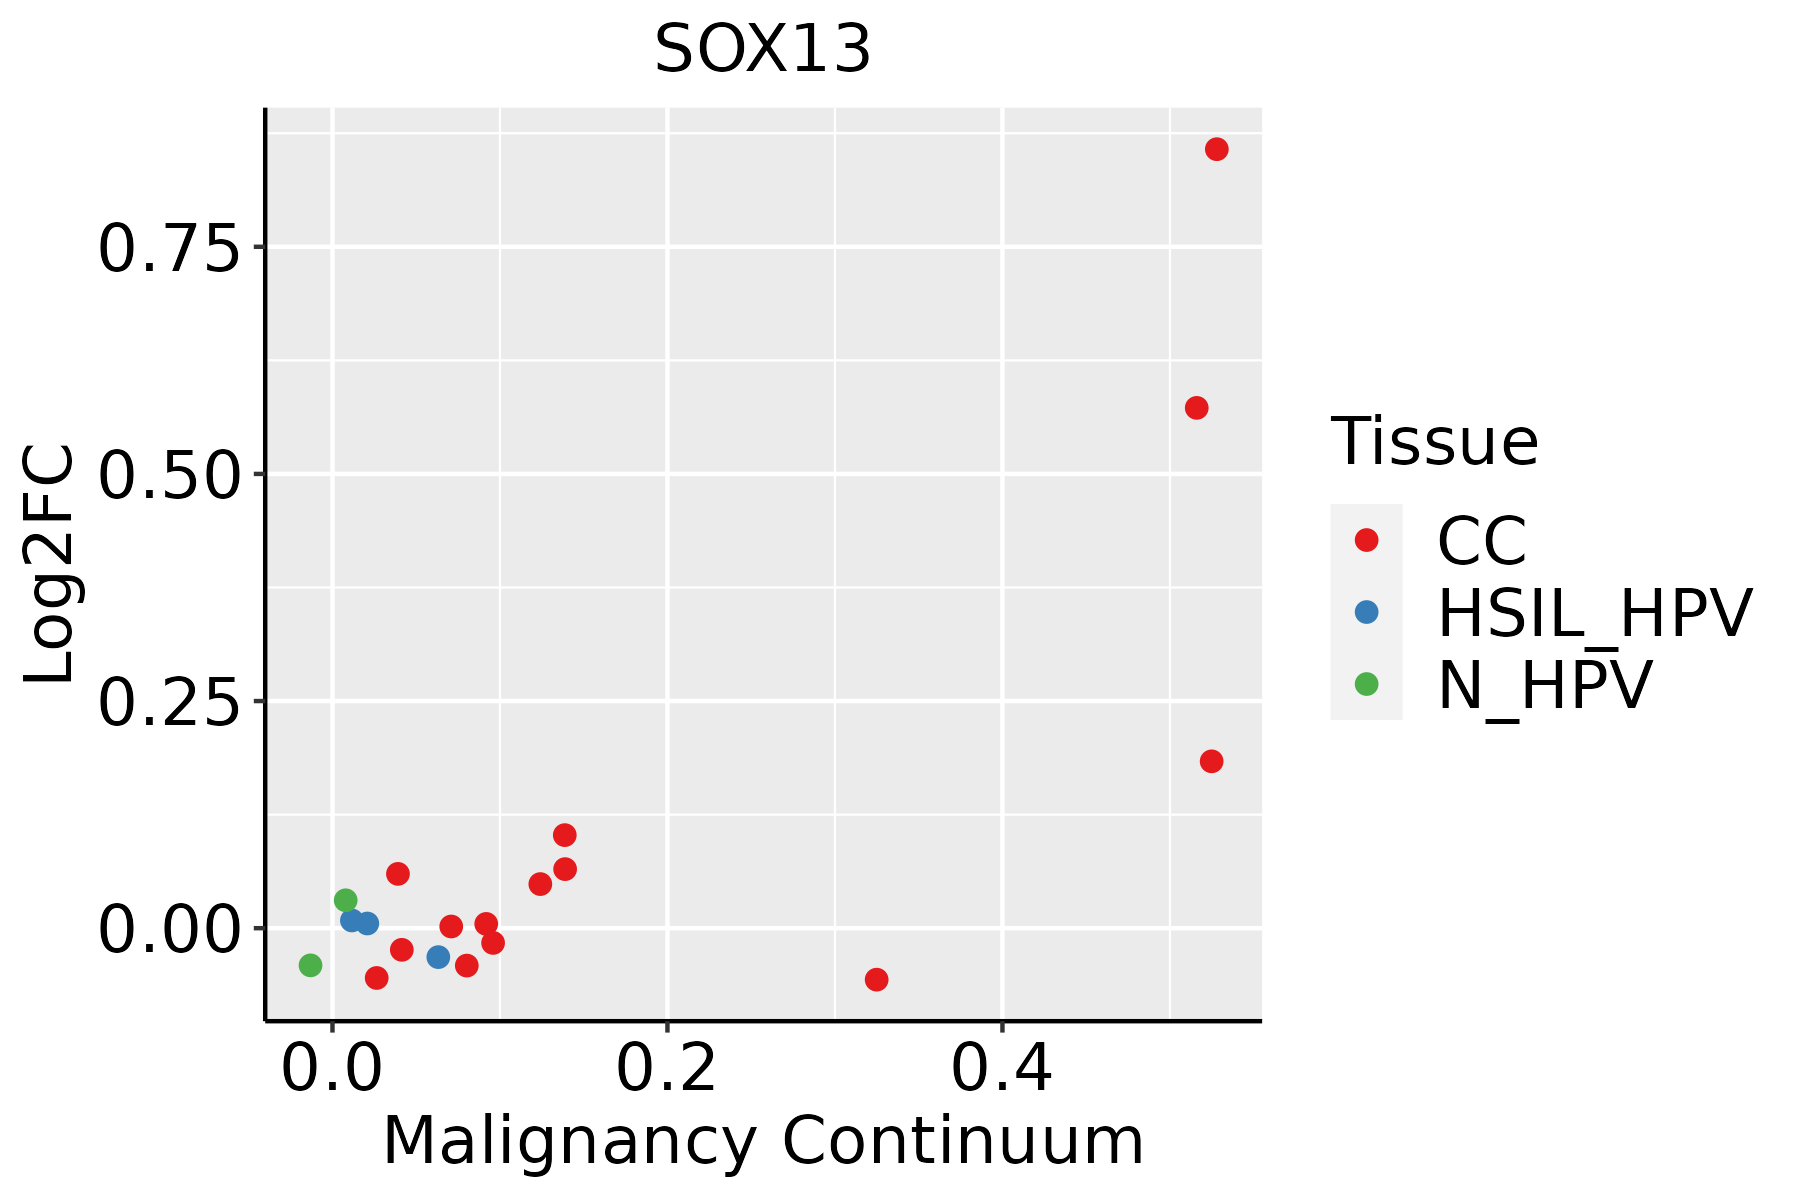 | CC: Cervix cancer |
| HSIL_HPV: HPV-infected high-grade squamous intraepithelial lesions | ||
| N_HPV: HPV-infected normal cervix | ||
| Esophagus |  | ESCC: Esophageal squamous cell carcinoma |
| HGIN: High-grade intraepithelial neoplasias | ||
| LGIN: Low-grade intraepithelial neoplasias | ||
| Liver | 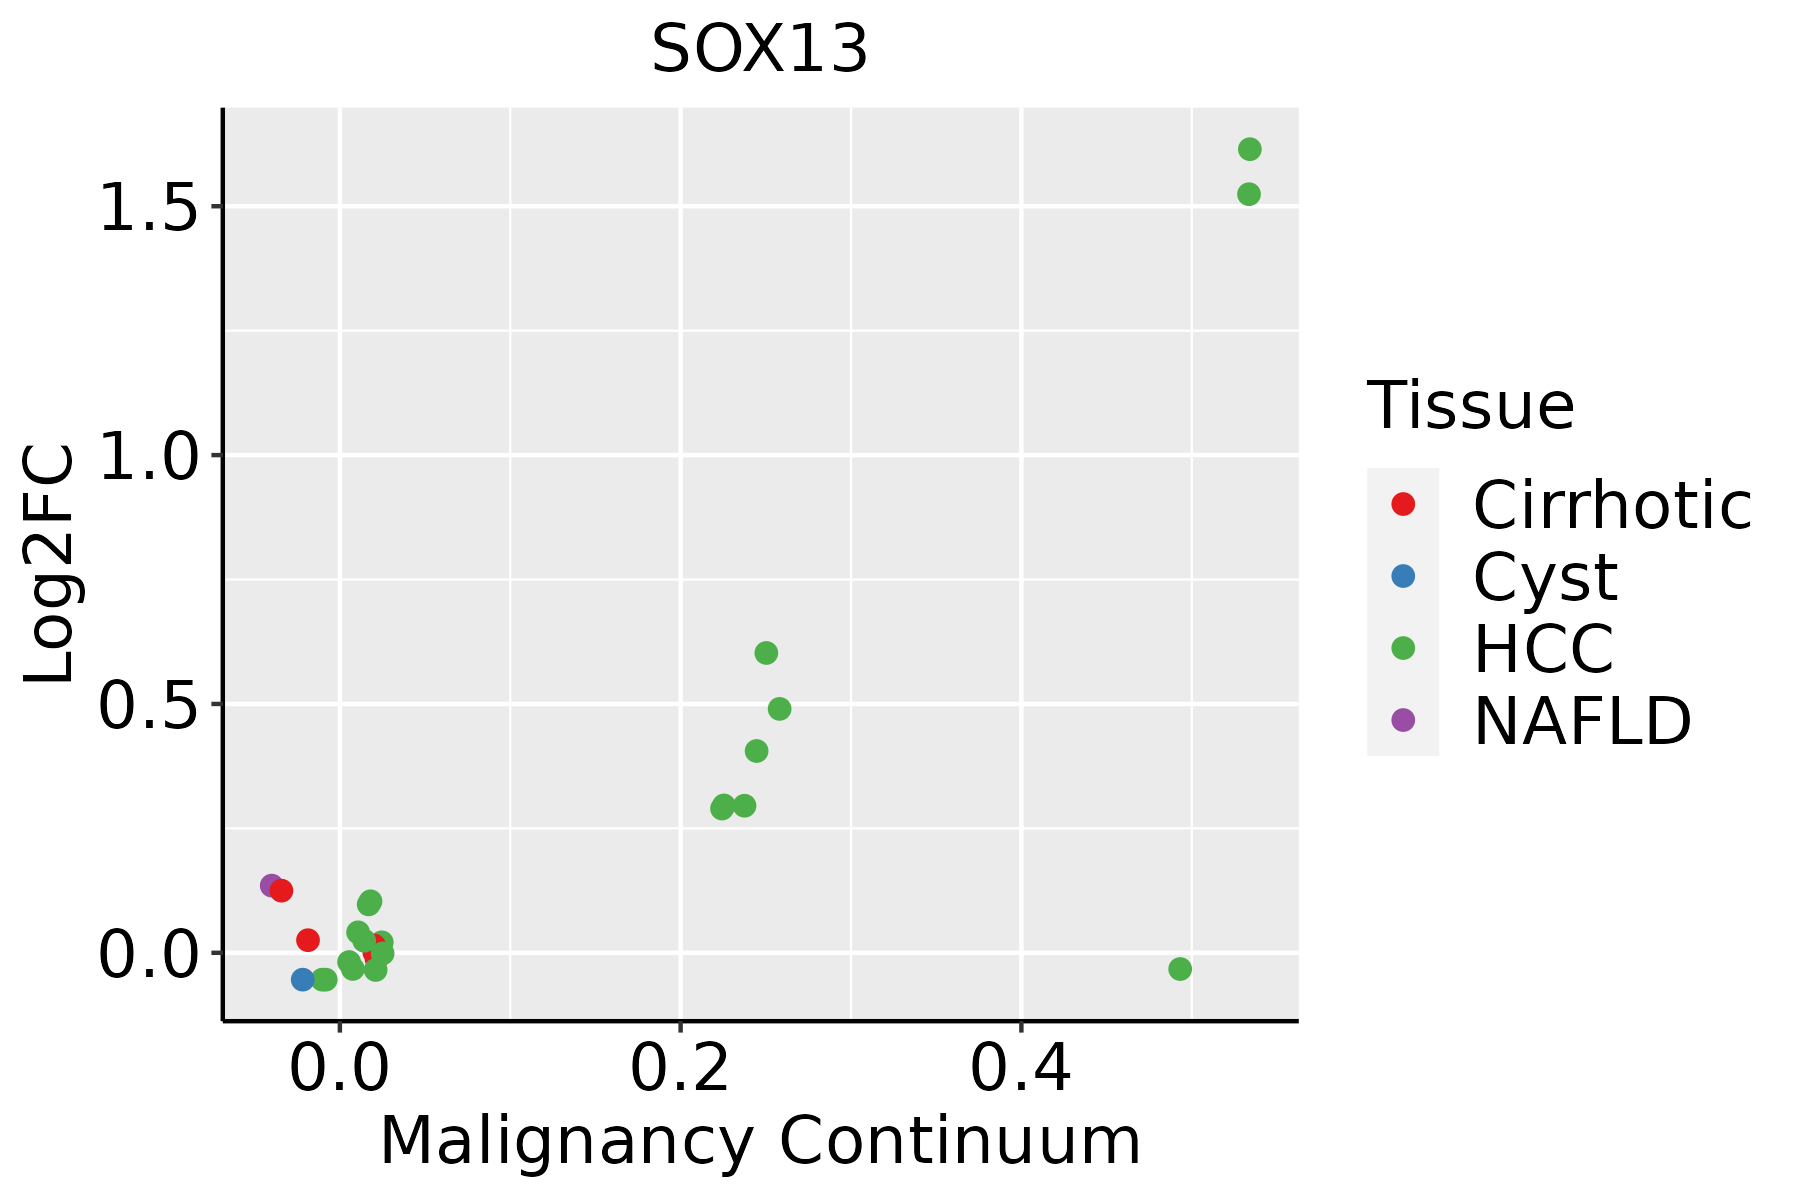 | HCC: Hepatocellular carcinoma |
| NAFLD: Non-alcoholic fatty liver disease |
| ∗log2FC in expression of this searched gene in stem-like cells from each diseased tissue sample relative to stem-like cells in normal samples in each tissue plotted against the malignancy continuum. Samples are colored based on if they are from different disease stage. |
Top |
Malignant transformation related pathway analysis |
| Find out the enriched GO biological processes and KEGG pathways involved in transition from healthy to precancer to cancer |
| Tissue | Disease Stage | Enriched GO biological Processes |
| Colorectum | AD |  |
| Colorectum | SER |  |
| Colorectum | MSS |  |
| Colorectum | MSI-H |  |
| Colorectum | FAP |  |
| ∗Top 15 enriched GO BP terms are showed in the bar plot of each disease state in each tissue. Each row represents a significant GO biological process which is colored according to the -log10(p.adjust). |
| Page: 1 2 3 4 5 6 7 8 9 |
| GO ID | Tissue | Disease Stage | Description | Gene Ratio | Bg Ratio | pvalue | p.adjust | Count |
| GO:002240710 | Cervix | CC | regulation of cell-cell adhesion | 103/2311 | 448/18723 | 1.78e-10 | 2.87e-08 | 103 |
| GO:004578510 | Cervix | CC | positive regulation of cell adhesion | 101/2311 | 437/18723 | 1.96e-10 | 3.08e-08 | 101 |
| GO:00421108 | Cervix | CC | T cell activation | 107/2311 | 487/18723 | 1.24e-09 | 1.46e-07 | 107 |
| GO:00508638 | Cervix | CC | regulation of T cell activation | 80/2311 | 329/18723 | 1.28e-09 | 1.47e-07 | 80 |
| GO:00160557 | Cervix | CC | Wnt signaling pathway | 98/2311 | 444/18723 | 4.82e-09 | 4.65e-07 | 98 |
| GO:01987387 | Cervix | CC | cell-cell signaling by wnt | 98/2311 | 446/18723 | 6.16e-09 | 5.58e-07 | 98 |
| GO:00071598 | Cervix | CC | leukocyte cell-cell adhesion | 85/2311 | 371/18723 | 8.27e-09 | 7.07e-07 | 85 |
| GO:00301117 | Cervix | CC | regulation of Wnt signaling pathway | 76/2311 | 328/18723 | 3.05e-08 | 2.08e-06 | 76 |
| GO:19030378 | Cervix | CC | regulation of leukocyte cell-cell adhesion | 77/2311 | 336/18723 | 4.08e-08 | 2.54e-06 | 77 |
| GO:190370610 | Cervix | CC | regulation of hemopoiesis | 80/2311 | 367/18723 | 2.14e-07 | 9.55e-06 | 80 |
| GO:00608287 | Cervix | CC | regulation of canonical Wnt signaling pathway | 58/2311 | 253/18723 | 1.83e-06 | 5.89e-05 | 58 |
| GO:00600707 | Cervix | CC | canonical Wnt signaling pathway | 66/2311 | 303/18723 | 2.47e-06 | 7.35e-05 | 66 |
| GO:00454445 | Cervix | CC | fat cell differentiation | 53/2311 | 229/18723 | 3.72e-06 | 9.75e-05 | 53 |
| GO:19021056 | Cervix | CC | regulation of leukocyte differentiation | 61/2311 | 279/18723 | 5.16e-06 | 1.29e-04 | 61 |
| GO:00224099 | Cervix | CC | positive regulation of cell-cell adhesion | 61/2311 | 284/18723 | 9.30e-06 | 2.11e-04 | 61 |
| GO:19030397 | Cervix | CC | positive regulation of leukocyte cell-cell adhesion | 53/2311 | 239/18723 | 1.37e-05 | 2.74e-04 | 53 |
| GO:00508708 | Cervix | CC | positive regulation of T cell activation | 49/2311 | 216/18723 | 1.51e-05 | 2.97e-04 | 49 |
| GO:0045580 | Cervix | CC | regulation of T cell differentiation | 33/2311 | 146/18723 | 3.75e-04 | 3.87e-03 | 33 |
| GO:00302173 | Cervix | CC | T cell differentiation | 51/2311 | 257/18723 | 3.81e-04 | 3.89e-03 | 51 |
| GO:19031314 | Cervix | CC | mononuclear cell differentiation | 76/2311 | 426/18723 | 5.66e-04 | 5.42e-03 | 76 |
| Page: 1 2 3 4 |
| Pathway ID | Tissue | Disease Stage | Description | Gene Ratio | Bg Ratio | pvalue | p.adjust | qvalue | Count |
| Page: 1 |
Top |
Cell-cell communication analysis |
| Identification of potential cell-cell interactions between two cell types and their ligand-receptor pairs for different disease states |
| Ligand | Receptor | LRpair | Pathway | Tissue | Disease Stage |
| Page: 1 |
Top |
Single-cell gene regulatory network inference analysis |
| Find out the significant the regulons (TFs) and the target genes of each regulon across cell types for different disease states |
| TF | Cell Type | Tissue | Disease Stage | Target Gene | RSS | Regulon Activity |
| SOX13 | IMENT | Colorectum | CRC | EPM2A,ST6GALNAC3,GANC, etc. | 5.48e-02 |  |
| SOX13 | TUF | Colorectum | FAP | EPM2A,ST6GALNAC3,GANC, etc. | 8.62e-02 |  |
| SOX13 | MVA | Liver | HCC | PRDM16,JAG2,PIK3C2B, etc. | 4.11e-01 |  |
| SOX13 | MSC.MVA | Liver | HCC | PRDM16,JAG2,PIK3C2B, etc. | 1.28e-01 | |
| SOX13 | MVA | Liver | Healthy | PRDM16,JAG2,PIK3C2B, etc. | 5.41e-02 |  |
| SOX13 | PERI | Lung | AAH | SOX5,PRR16,FGF14, etc. | 1.88e-01 |  |
| SOX13 | PERI | Lung | AIS | SOX5,PRR16,FGF14, etc. | 2.15e-01 |  |
| SOX13 | FIB | Lung | Healthy | SOX5,PRR16,FGF14, etc. | 4.46e-01 |  |
| SOX13 | PVA | Lung | Healthy | SOX5,PRR16,FGF14, etc. | 1.12e-01 | |
| SOX13 | ECM | Lung | IAC | SOX5,PRR16,FGF14, etc. | 1.07e-01 |  |
| ∗The dot plots of a searched regulon are shown for all cell subpopulations in each disease state of each tissue based on the regulon specific score inferred using pySCENIC and by calculating the average expression. |
| Page: 1 2 3 4 |
Top |
Somatic mutation of malignant transformation related genes |
| Annotation of somatic variants for genes involved in malignant transformation |
| Hugo Symbol | Variant Class | Variant Classification | dbSNP RS | HGVSc | HGVSp | HGVSp Short | SWISSPROT | BIOTYPE | SIFT | PolyPhen | Tumor Sample Barcode | Tissue | Histology | Sex | Age | Stage | Therapy Types | Drugs | Outcome |
| SOX13 | SNV | Missense_Mutation | novel | c.1340N>T | p.Pro447Leu | p.P447L | Q9UN79 | protein_coding | deleterious(0) | probably_damaging(0.999) | TCGA-A8-A08R-01 | Breast | breast invasive carcinoma | Female | <65 | I/II | Unknown | Unknown | SD |
| SOX13 | SNV | Missense_Mutation | rs762506053 | c.44N>A | p.Gly15Asp | p.G15D | Q9UN79 | protein_coding | tolerated_low_confidence(0.1) | benign(0.003) | TCGA-A8-A09Z-01 | Breast | breast invasive carcinoma | Female | >=65 | I/II | Unknown | Unknown | SD |
| SOX13 | SNV | Missense_Mutation | c.1249N>A | p.Glu417Lys | p.E417K | Q9UN79 | protein_coding | deleterious(0) | possibly_damaging(0.833) | TCGA-AO-A128-01 | Breast | breast invasive carcinoma | Female | <65 | I/II | Chemotherapy | doxorubicin | SD | |
| SOX13 | SNV | Missense_Mutation | novel | c.379N>G | p.Phe127Val | p.F127V | Q9UN79 | protein_coding | tolerated(0.13) | benign(0.058) | TCGA-AR-A1AP-01 | Breast | breast invasive carcinoma | Female | >=65 | I/II | Hormone Therapy | anastrozole | SD |
| SOX13 | SNV | Missense_Mutation | novel | c.21N>G | p.Ile7Met | p.I7M | Q9UN79 | protein_coding | tolerated_low_confidence(0.06) | benign(0.027) | TCGA-AR-A2LE-01 | Breast | breast invasive carcinoma | Female | >=65 | I/II | Hormone Therapy | tamoxiphen | PD |
| SOX13 | SNV | Missense_Mutation | c.544N>C | p.Glu182Gln | p.E182Q | Q9UN79 | protein_coding | deleterious(0) | possibly_damaging(0.767) | TCGA-E2-A159-01 | Breast | breast invasive carcinoma | Female | <65 | I/II | Chemotherapy | cyclophosphamide | SD | |
| SOX13 | SNV | Missense_Mutation | c.433N>A | p.Leu145Ile | p.L145I | Q9UN79 | protein_coding | deleterious(0) | probably_damaging(0.991) | TCGA-GM-A2DB-01 | Breast | breast invasive carcinoma | Female | <65 | I/II | Chemotherapy | taxol | CR | |
| SOX13 | insertion | Frame_Shift_Ins | novel | c.695_696insC | p.Ser235LysfsTer10 | p.S235Kfs*10 | Q9UN79 | protein_coding | TCGA-A8-A08G-01 | Breast | breast invasive carcinoma | Female | <65 | I/II | Chemotherapy | 5-fluorouracil | CR | ||
| SOX13 | insertion | Frame_Shift_Ins | novel | c.634_635insAAGCAGGG | p.Ile212LysfsTer20 | p.I212Kfs*20 | Q9UN79 | protein_coding | TCGA-BH-A0BA-01 | Breast | breast invasive carcinoma | Female | <65 | III/IV | Chemotherapy | cytoxan | SD | ||
| SOX13 | insertion | In_Frame_Ins | novel | c.635_636insGTGGTTAGGGCTGGG | p.Ile212delinsMetTrpLeuGlyLeuGly | p.I212delinsMWLGLG | Q9UN79 | protein_coding | TCGA-BH-A0BA-01 | Breast | breast invasive carcinoma | Female | <65 | III/IV | Chemotherapy | cytoxan | SD |
| Page: 1 2 3 4 5 6 |
Top |
Related drugs of malignant transformation related genes |
| Identification of chemicals and drugs interact with genes involved in malignant transfromation |
| (DGIdb 4.0) |
| Entrez ID | Symbol | Category | Interaction Types | Drug Claim Name | Drug Name | PMIDs |
| Page: 1 |

Copyright 2023-Present -The University of Texas Health Science Center at Houston |