
|
|||||
|
 | |
| |
| |
| |
| |
| |
|
Gene: SOX12 |
Gene summary for SOX12 |
| Gene information | Species | Human | Gene symbol | SOX12 | Gene ID | 6666 |
| Gene name | SRY-box transcription factor 12 | |
| Gene Alias | SOX22 | |
| Cytomap | 20p13 | |
| Gene Type | protein-coding | GO ID | GO:0001775 | UniProtAcc | O15370 |
Top |
Malignant transformation analysis |
| Identification of the aberrant gene expression in precancerous and cancerous lesions by comparing the gene expression of stem-like cells in diseased tissues with normal stem cells |
| Entrez ID | Symbol | Replicates | Species | Organ | Tissue | Adj P-value | Log2FC | Malignancy |
| 6666 | SOX12 | HCC1_Meng | Human | Liver | HCC | 4.38e-45 | 1.27e-01 | 0.0246 |
| 6666 | SOX12 | HCC1 | Human | Liver | HCC | 1.22e-16 | 3.94e+00 | 0.5336 |
| 6666 | SOX12 | HCC2 | Human | Liver | HCC | 1.18e-24 | 3.64e+00 | 0.5341 |
| 6666 | SOX12 | HCC5 | Human | Liver | HCC | 1.61e-03 | 1.41e+00 | 0.4932 |
| 6666 | SOX12 | Pt14.a | Human | Liver | HCC | 1.71e-03 | 1.73e-01 | 0.0169 |
| 6666 | SOX12 | Pt14.b | Human | Liver | HCC | 1.46e-03 | 1.74e-01 | 0.018 |
| 6666 | SOX12 | S014 | Human | Liver | HCC | 1.10e-27 | 7.19e-01 | 0.2254 |
| 6666 | SOX12 | S015 | Human | Liver | HCC | 4.34e-22 | 8.05e-01 | 0.2375 |
| 6666 | SOX12 | S016 | Human | Liver | HCC | 8.57e-27 | 7.18e-01 | 0.2243 |
| 6666 | SOX12 | S027 | Human | Liver | HCC | 2.75e-07 | 3.03e-01 | 0.2446 |
| 6666 | SOX12 | S028 | Human | Liver | HCC | 1.22e-10 | 4.00e-01 | 0.2503 |
| 6666 | SOX12 | S029 | Human | Liver | HCC | 1.30e-10 | 2.69e-01 | 0.2581 |
| 6666 | SOX12 | male-WTA | Human | Thyroid | PTC | 1.13e-11 | 1.59e-01 | 0.1037 |
| 6666 | SOX12 | PTC04 | Human | Thyroid | PTC | 1.78e-08 | 1.21e-01 | 0.1927 |
| 6666 | SOX12 | PTC05 | Human | Thyroid | PTC | 7.16e-14 | 3.92e-01 | 0.2065 |
| 6666 | SOX12 | PTC06 | Human | Thyroid | PTC | 3.84e-16 | 3.51e-01 | 0.2057 |
| 6666 | SOX12 | PTC07 | Human | Thyroid | PTC | 2.01e-06 | 1.65e-01 | 0.2044 |
| 6666 | SOX12 | ATC09 | Human | Thyroid | ATC | 1.54e-16 | 5.48e-01 | 0.2871 |
| 6666 | SOX12 | ATC12 | Human | Thyroid | ATC | 7.08e-20 | 4.68e-01 | 0.34 |
| 6666 | SOX12 | ATC13 | Human | Thyroid | ATC | 4.38e-08 | 1.76e-01 | 0.34 |
| Page: 1 2 |
| Tissue | Expression Dynamics | Abbreviation |
| Liver | 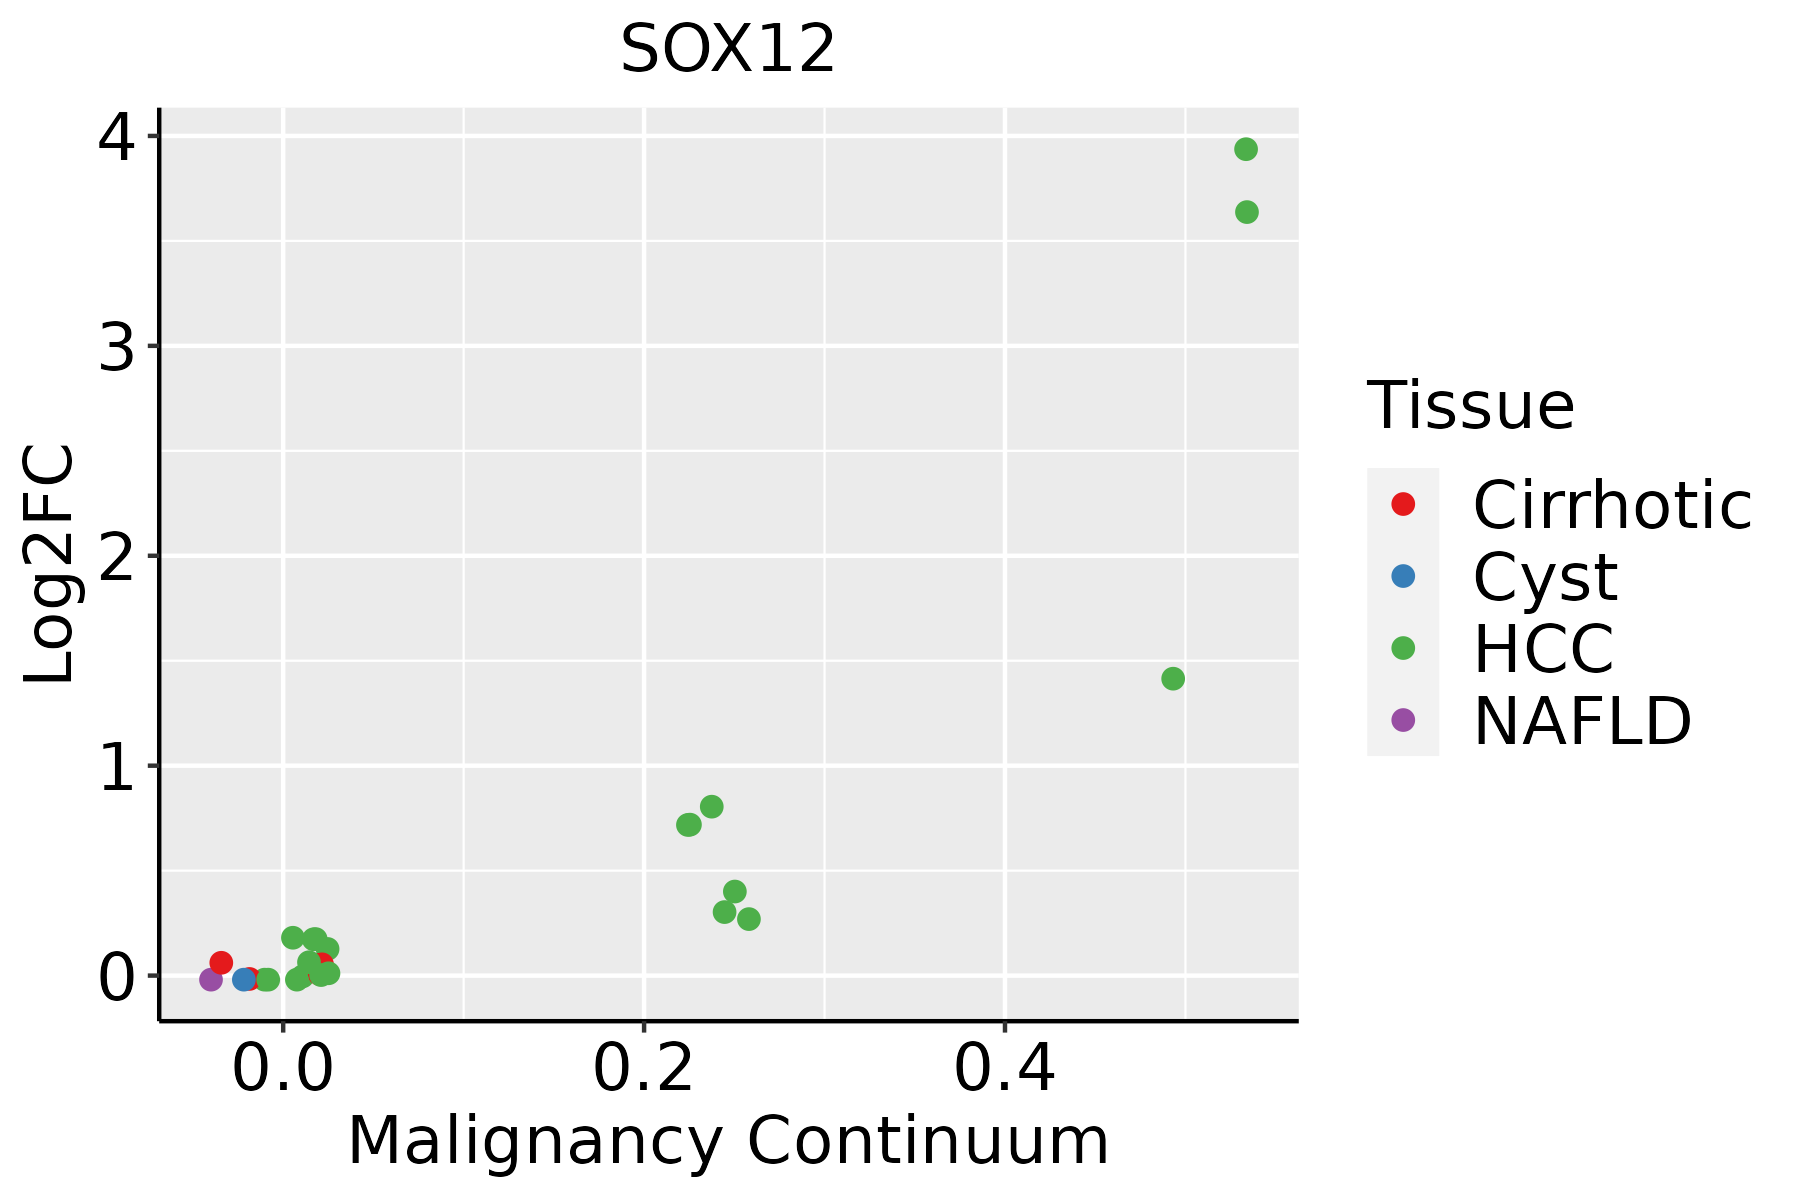 | HCC: Hepatocellular carcinoma |
| NAFLD: Non-alcoholic fatty liver disease | ||
| Thyroid | 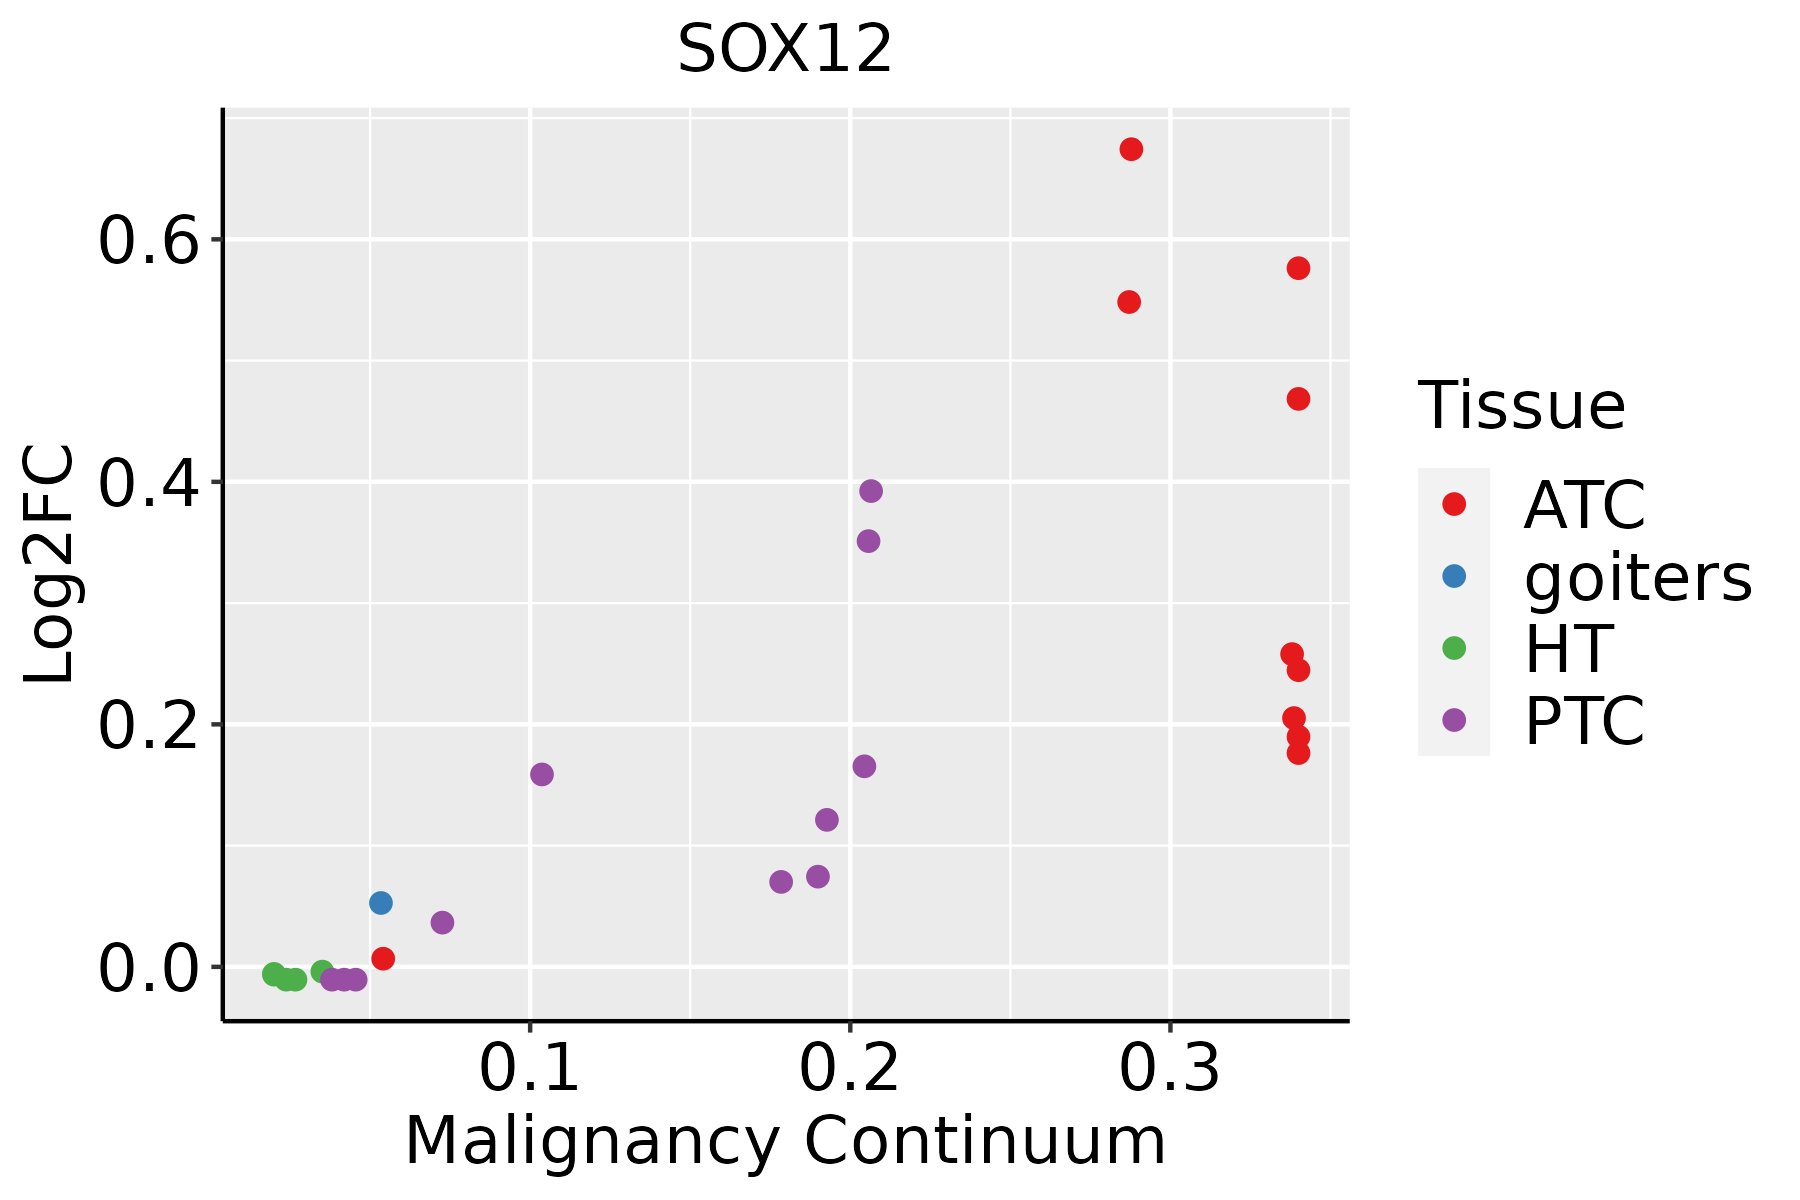 | ATC: Anaplastic thyroid cancer |
| HT: Hashimoto's thyroiditis | ||
| PTC: Papillary thyroid cancer |
| ∗log2FC in expression of this searched gene in stem-like cells from each diseased tissue sample relative to stem-like cells in normal samples in each tissue plotted against the malignancy continuum. Samples are colored based on if they are from different disease stage. |
Top |
Malignant transformation related pathway analysis |
| Find out the enriched GO biological processes and KEGG pathways involved in transition from healthy to precancer to cancer |
| Tissue | Disease Stage | Enriched GO biological Processes |
| Colorectum | AD |  |
| Colorectum | SER |  |
| Colorectum | MSS |  |
| Colorectum | MSI-H |  |
| Colorectum | FAP |  |
| ∗Top 15 enriched GO BP terms are showed in the bar plot of each disease state in each tissue. Each row represents a significant GO biological process which is colored according to the -log10(p.adjust). |
| Page: 1 2 3 4 5 6 7 8 9 |
| GO ID | Tissue | Disease Stage | Description | Gene Ratio | Bg Ratio | pvalue | p.adjust | Count |
| GO:004578512 | Liver | HCC | positive regulation of cell adhesion | 215/7958 | 437/18723 | 2.53e-03 | 1.22e-02 | 215 |
| GO:0045785112 | Thyroid | PTC | positive regulation of cell adhesion | 176/5968 | 437/18723 | 1.10e-04 | 8.83e-04 | 176 |
| GO:0045785210 | Thyroid | ATC | positive regulation of cell adhesion | 194/6293 | 437/18723 | 1.40e-06 | 1.75e-05 | 194 |
| GO:1903706112 | Thyroid | ATC | regulation of hemopoiesis | 148/6293 | 367/18723 | 3.87e-03 | 1.68e-02 | 148 |
| Page: 1 |
| Pathway ID | Tissue | Disease Stage | Description | Gene Ratio | Bg Ratio | pvalue | p.adjust | qvalue | Count |
| Page: 1 |
Top |
Cell-cell communication analysis |
| Identification of potential cell-cell interactions between two cell types and their ligand-receptor pairs for different disease states |
| Ligand | Receptor | LRpair | Pathway | Tissue | Disease Stage |
| Page: 1 |
Top |
Single-cell gene regulatory network inference analysis |
| Find out the significant the regulons (TFs) and the target genes of each regulon across cell types for different disease states |
| TF | Cell Type | Tissue | Disease Stage | Target Gene | RSS | Regulon Activity |
| SOX12 | SMC | Thyroid | ATC | RPL24P4,PRICKLE2,CUTALP, etc. | 1.98e-01 |  |
| ∗The dot plots of a searched regulon are shown for all cell subpopulations in each disease state of each tissue based on the regulon specific score inferred using pySCENIC and by calculating the average expression. |
| Page: 1 |
Top |
Somatic mutation of malignant transformation related genes |
| Annotation of somatic variants for genes involved in malignant transformation |
| Hugo Symbol | Variant Class | Variant Classification | dbSNP RS | HGVSc | HGVSp | HGVSp Short | SWISSPROT | BIOTYPE | SIFT | PolyPhen | Tumor Sample Barcode | Tissue | Histology | Sex | Age | Stage | Therapy Types | Drugs | Outcome |
| SOX12 | SNV | Missense_Mutation | novel | c.342G>C | p.Lys114Asn | p.K114N | O15370 | protein_coding | deleterious(0.02) | probably_damaging(0.946) | TCGA-EW-A6SD-01 | Breast | breast invasive carcinoma | Female | <65 | I/II | Chemotherapy | tch | SD |
| SOX12 | SNV | Missense_Mutation | novel | c.216N>C | p.Lys72Asn | p.K72N | O15370 | protein_coding | deleterious(0) | possibly_damaging(0.696) | TCGA-C5-A3HD-01 | Cervix | cervical & endocervical cancer | Female | <65 | I/II | Chemotherapy | cisplatin | SD |
| SOX12 | SNV | Missense_Mutation | novel | c.684N>T | p.Glu228Asp | p.E228D | O15370 | protein_coding | tolerated(0.21) | benign(0.191) | TCGA-EA-A3HS-01 | Cervix | cervical & endocervical cancer | Female | <65 | I/II | Unknown | Unknown | SD |
| SOX12 | SNV | Missense_Mutation | novel | c.740N>T | p.Ser247Leu | p.S247L | O15370 | protein_coding | tolerated(0.29) | benign(0.001) | TCGA-VS-A9UC-01 | Cervix | cervical & endocervical cancer | Female | <65 | I/II | Chemotherapy | cisplatin | SD |
| SOX12 | SNV | Missense_Mutation | rs867428648 | c.335N>A | p.Arg112His | p.R112H | O15370 | protein_coding | deleterious(0) | possibly_damaging(0.591) | TCGA-AZ-6598-01 | Colorectum | colon adenocarcinoma | Female | >=65 | I/II | Unknown | Unknown | SD |
| SOX12 | SNV | Missense_Mutation | novel | c.326N>G | p.Tyr109Cys | p.Y109C | O15370 | protein_coding | deleterious(0) | possibly_damaging(0.67) | TCGA-DM-A0XD-01 | Colorectum | colon adenocarcinoma | Male | >=65 | I/II | Unknown | Unknown | PD |
| SOX12 | SNV | Missense_Mutation | c.223N>A | p.Gly75Ser | p.G75S | O15370 | protein_coding | deleterious(0) | probably_damaging(0.999) | TCGA-CC-A7IH-01 | Liver | liver hepatocellular carcinoma | Male | <65 | III/IV | Unknown | Unknown | SD | |
| SOX12 | SNV | Missense_Mutation | c.880N>A | p.Glu294Lys | p.E294K | O15370 | protein_coding | deleterious(0) | probably_damaging(0.992) | TCGA-69-7980-01 | Lung | lung adenocarcinoma | Female | >=65 | I/II | Unknown | Unknown | SD | |
| SOX12 | SNV | Missense_Mutation | novel | c.855N>G | p.Phe285Leu | p.F285L | O15370 | protein_coding | deleterious(0) | probably_damaging(0.932) | TCGA-77-8136-01 | Lung | lung squamous cell carcinoma | Female | >=65 | I/II | Unknown | Unknown | PD |
| SOX12 | SNV | Missense_Mutation | novel | c.872N>A | p.Cys291Tyr | p.C291Y | O15370 | protein_coding | deleterious(0) | probably_damaging(0.996) | TCGA-CV-7433-01 | Oral cavity | head & neck squamous cell carcinoma | Male | <65 | I/II | Unknown | Unknown | PD |
| Page: 1 2 |
Top |
Related drugs of malignant transformation related genes |
| Identification of chemicals and drugs interact with genes involved in malignant transfromation |
| (DGIdb 4.0) |
| Entrez ID | Symbol | Category | Interaction Types | Drug Claim Name | Drug Name | PMIDs |
| Page: 1 |

Copyright 2023-Present -The University of Texas Health Science Center at Houston |