
|
|||||
|
 | |
| |
| |
| |
| |
| |
|
Gene: SOSTDC1 |
Gene summary for SOSTDC1 |
| Gene information | Species | Human | Gene symbol | SOSTDC1 | Gene ID | 25928 |
| Gene name | sclerostin domain containing 1 | |
| Gene Alias | CDA019 | |
| Cytomap | 7p21.2 | |
| Gene Type | protein-coding | GO ID | GO:0001942 | UniProtAcc | A4D125 |
Top |
Malignant transformation analysis |
| Identification of the aberrant gene expression in precancerous and cancerous lesions by comparing the gene expression of stem-like cells in diseased tissues with normal stem cells |
| Entrez ID | Symbol | Replicates | Species | Organ | Tissue | Adj P-value | Log2FC | Malignancy |
| 25928 | SOSTDC1 | P2T-E | Human | Esophagus | ESCC | 2.91e-23 | 6.07e-01 | 0.1177 |
| 25928 | SOSTDC1 | P10T-E | Human | Esophagus | ESCC | 1.37e-105 | 2.64e+00 | 0.116 |
| 25928 | SOSTDC1 | P12T-E | Human | Esophagus | ESCC | 1.57e-22 | 7.05e-01 | 0.1122 |
| 25928 | SOSTDC1 | P15T-E | Human | Esophagus | ESCC | 1.70e-20 | 1.26e+00 | 0.1149 |
| 25928 | SOSTDC1 | P16T-E | Human | Esophagus | ESCC | 7.46e-103 | 3.15e+00 | 0.1153 |
| 25928 | SOSTDC1 | P20T-E | Human | Esophagus | ESCC | 8.03e-21 | 1.04e+00 | 0.1124 |
| 25928 | SOSTDC1 | P22T-E | Human | Esophagus | ESCC | 1.68e-31 | 1.08e+00 | 0.1236 |
| 25928 | SOSTDC1 | P26T-E | Human | Esophagus | ESCC | 9.11e-18 | 3.58e-01 | 0.1276 |
| 25928 | SOSTDC1 | P27T-E | Human | Esophagus | ESCC | 6.35e-08 | 4.28e-01 | 0.1055 |
| 25928 | SOSTDC1 | P30T-E | Human | Esophagus | ESCC | 3.93e-30 | 1.79e+00 | 0.137 |
| 25928 | SOSTDC1 | P31T-E | Human | Esophagus | ESCC | 1.35e-113 | 4.31e+00 | 0.1251 |
| 25928 | SOSTDC1 | P32T-E | Human | Esophagus | ESCC | 2.55e-05 | 3.97e-01 | 0.1666 |
| 25928 | SOSTDC1 | P36T-E | Human | Esophagus | ESCC | 1.77e-04 | 5.37e-01 | 0.1187 |
| 25928 | SOSTDC1 | P37T-E | Human | Esophagus | ESCC | 9.63e-20 | 6.42e-01 | 0.1371 |
| 25928 | SOSTDC1 | P49T-E | Human | Esophagus | ESCC | 4.18e-05 | 9.26e-01 | 0.1768 |
| 25928 | SOSTDC1 | P56T-E | Human | Esophagus | ESCC | 3.95e-15 | 3.57e+00 | 0.1613 |
| 25928 | SOSTDC1 | P57T-E | Human | Esophagus | ESCC | 2.18e-02 | 1.73e-01 | 0.0926 |
| 25928 | SOSTDC1 | P61T-E | Human | Esophagus | ESCC | 2.26e-13 | 5.41e-01 | 0.099 |
| 25928 | SOSTDC1 | P62T-E | Human | Esophagus | ESCC | 4.80e-28 | 1.37e+00 | 0.1302 |
| 25928 | SOSTDC1 | P74T-E | Human | Esophagus | ESCC | 1.79e-08 | 3.44e-01 | 0.1479 |
| Page: 1 2 |
| Tissue | Expression Dynamics | Abbreviation |
| Esophagus | 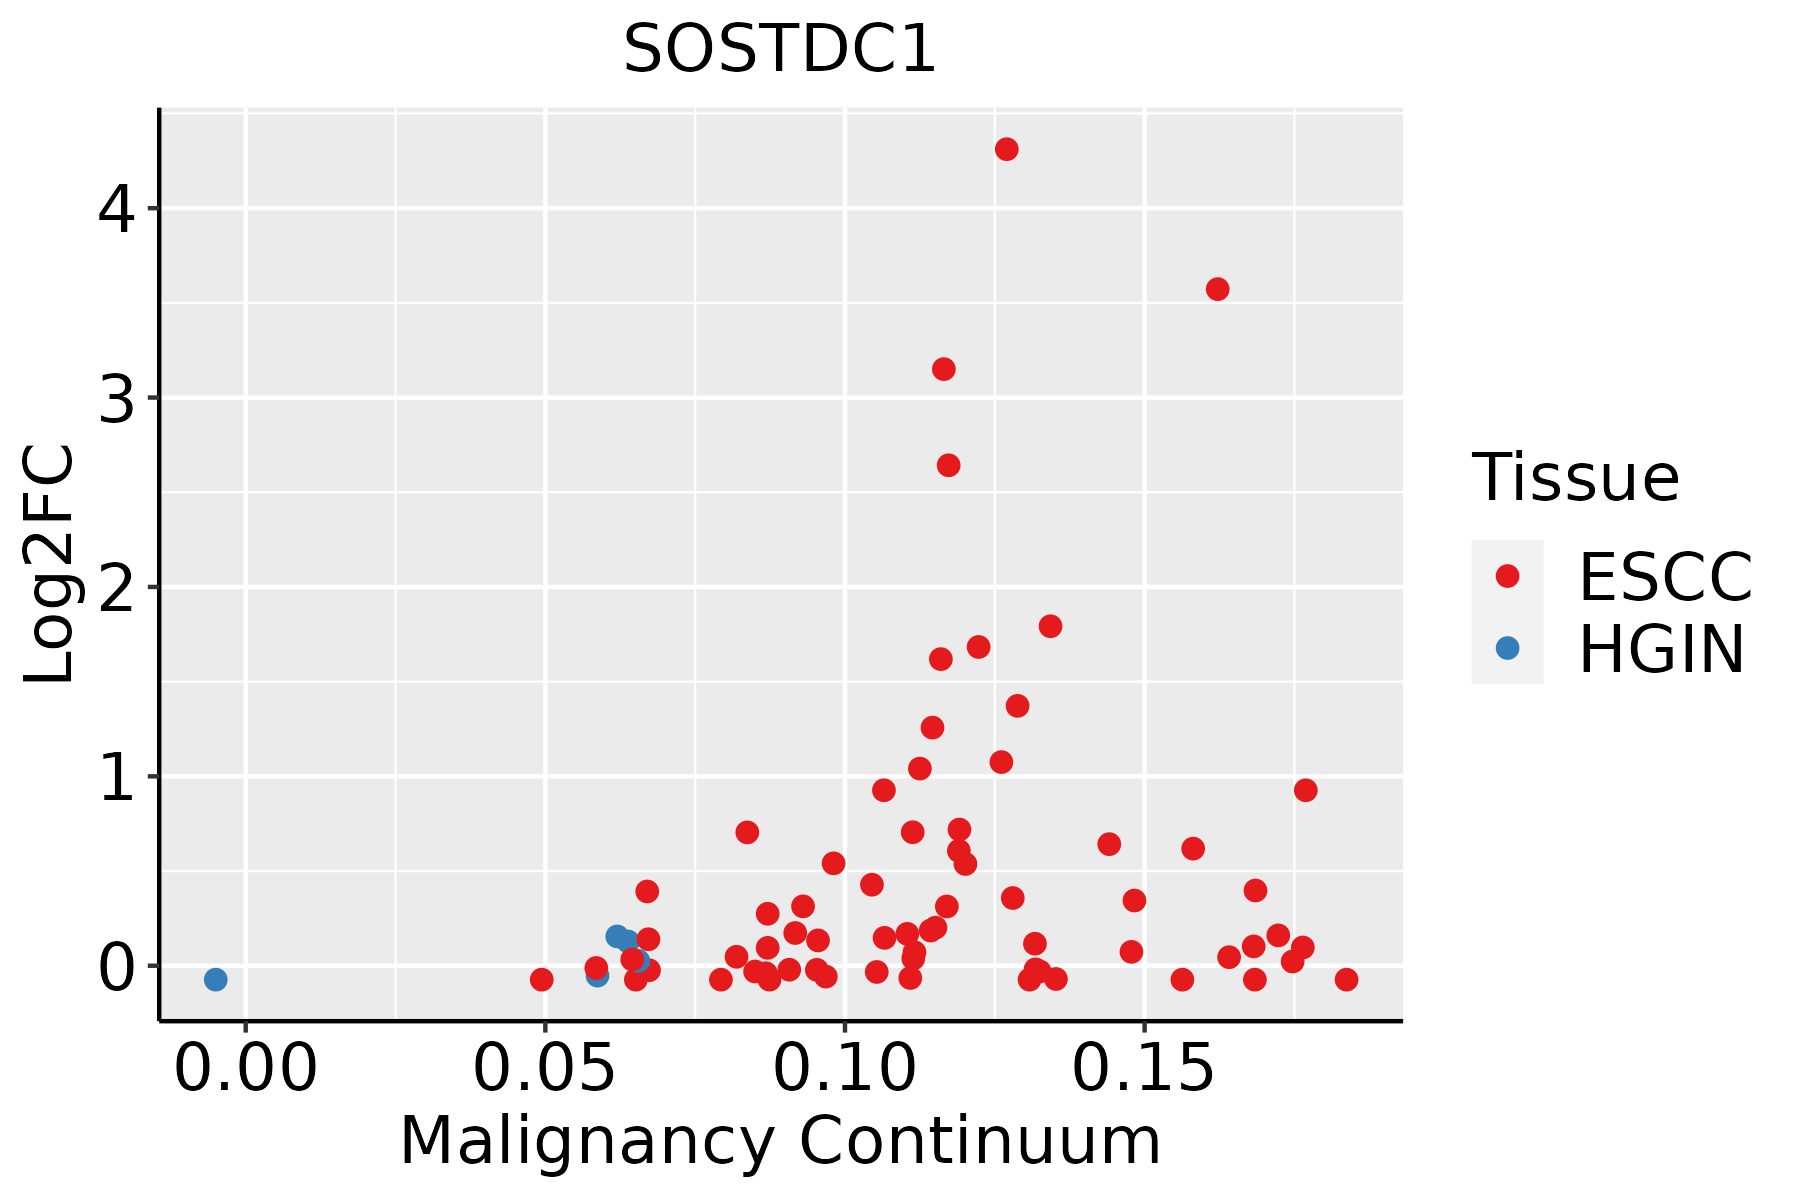 | ESCC: Esophageal squamous cell carcinoma |
| HGIN: High-grade intraepithelial neoplasias | ||
| LGIN: Low-grade intraepithelial neoplasias | ||
| Skin |  | AK: Actinic keratosis |
| cSCC: Cutaneous squamous cell carcinoma | ||
| SCCIS:squamous cell carcinoma in situ |
| ∗log2FC in expression of this searched gene in stem-like cells from each diseased tissue sample relative to stem-like cells in normal samples in each tissue plotted against the malignancy continuum. Samples are colored based on if they are from different disease stage. |
Top |
Malignant transformation related pathway analysis |
| Find out the enriched GO biological processes and KEGG pathways involved in transition from healthy to precancer to cancer |
| Tissue | Disease Stage | Enriched GO biological Processes |
| Colorectum | AD |  |
| Colorectum | SER |  |
| Colorectum | MSS |  |
| Colorectum | MSI-H |  |
| Colorectum | FAP |  |
| ∗Top 15 enriched GO BP terms are showed in the bar plot of each disease state in each tissue. Each row represents a significant GO biological process which is colored according to the -log10(p.adjust). |
| Page: 1 2 3 4 5 6 7 8 9 |
| GO ID | Tissue | Disease Stage | Description | Gene Ratio | Bg Ratio | pvalue | p.adjust | Count |
| GO:0048732111 | Esophagus | ESCC | gland development | 269/8552 | 436/18723 | 7.81e-12 | 2.95e-10 | 269 |
| GO:001605517 | Esophagus | ESCC | Wnt signaling pathway | 268/8552 | 444/18723 | 2.32e-10 | 6.58e-09 | 268 |
| GO:019873817 | Esophagus | ESCC | cell-cell signaling by wnt | 269/8552 | 446/18723 | 2.41e-10 | 6.79e-09 | 269 |
| GO:00435888 | Esophagus | ESCC | skin development | 163/8552 | 263/18723 | 6.48e-08 | 1.14e-06 | 163 |
| GO:000854410 | Esophagus | ESCC | epidermis development | 193/8552 | 324/18723 | 2.87e-07 | 4.19e-06 | 193 |
| GO:003011117 | Esophagus | ESCC | regulation of Wnt signaling pathway | 194/8552 | 328/18723 | 5.39e-07 | 7.14e-06 | 194 |
| GO:006007016 | Esophagus | ESCC | canonical Wnt signaling pathway | 180/8552 | 303/18723 | 9.15e-07 | 1.17e-05 | 180 |
| GO:006082817 | Esophagus | ESCC | regulation of canonical Wnt signaling pathway | 153/8552 | 253/18723 | 1.38e-06 | 1.67e-05 | 153 |
| GO:002261216 | Esophagus | ESCC | gland morphogenesis | 78/8552 | 118/18723 | 5.83e-06 | 6.03e-05 | 78 |
| GO:006056210 | Esophagus | ESCC | epithelial tube morphogenesis | 187/8552 | 325/18723 | 9.95e-06 | 9.44e-05 | 187 |
| GO:003087914 | Esophagus | ESCC | mammary gland development | 85/8552 | 137/18723 | 8.11e-05 | 6.01e-04 | 85 |
| GO:000717810 | Esophagus | ESCC | transmembrane receptor protein serine/threonine kinase signaling pathway | 195/8552 | 355/18723 | 2.58e-04 | 1.58e-03 | 195 |
| GO:00224043 | Esophagus | ESCC | molting cycle process | 53/8552 | 84/18723 | 9.62e-04 | 4.88e-03 | 53 |
| GO:00224053 | Esophagus | ESCC | hair cycle process | 53/8552 | 84/18723 | 9.62e-04 | 4.88e-03 | 53 |
| GO:0001942 | Esophagus | ESCC | hair follicle development | 51/8552 | 81/18723 | 1.27e-03 | 6.14e-03 | 51 |
| GO:0098773 | Esophagus | ESCC | skin epidermis development | 53/8552 | 85/18723 | 1.43e-03 | 6.77e-03 | 53 |
| GO:00611807 | Esophagus | ESCC | mammary gland epithelium development | 43/8552 | 67/18723 | 1.73e-03 | 7.97e-03 | 43 |
| GO:00301788 | Esophagus | ESCC | negative regulation of Wnt signaling pathway | 97/8552 | 170/18723 | 1.81e-03 | 8.31e-03 | 97 |
| GO:00454454 | Esophagus | ESCC | myoblast differentiation | 52/8552 | 84/18723 | 1.98e-03 | 8.90e-03 | 52 |
| GO:00423033 | Esophagus | ESCC | molting cycle | 64/8552 | 107/18723 | 2.24e-03 | 9.85e-03 | 64 |
| Page: 1 2 3 4 |
| Pathway ID | Tissue | Disease Stage | Description | Gene Ratio | Bg Ratio | pvalue | p.adjust | qvalue | Count |
| Page: 1 |
Top |
Cell-cell communication analysis |
| Identification of potential cell-cell interactions between two cell types and their ligand-receptor pairs for different disease states |
| Ligand | Receptor | LRpair | Pathway | Tissue | Disease Stage |
| Page: 1 |
Top |
Single-cell gene regulatory network inference analysis |
| Find out the significant the regulons (TFs) and the target genes of each regulon across cell types for different disease states |
| TF | Cell Type | Tissue | Disease Stage | Target Gene | RSS | Regulon Activity |
| ∗The dot plots of a searched regulon are shown for all cell subpopulations in each disease state of each tissue based on the regulon specific score inferred using pySCENIC and by calculating the average expression. |
| Page: 1 |
Top |
Somatic mutation of malignant transformation related genes |
| Annotation of somatic variants for genes involved in malignant transformation |
| Hugo Symbol | Variant Class | Variant Classification | dbSNP RS | HGVSc | HGVSp | HGVSp Short | SWISSPROT | BIOTYPE | SIFT | PolyPhen | Tumor Sample Barcode | Tissue | Histology | Sex | Age | Stage | Therapy Types | Drugs | Outcome |
| SOSTDC1 | SNV | Missense_Mutation | novel | c.399N>G | p.Cys133Trp | p.C133W | Q6X4U4 | protein_coding | deleterious(0) | probably_damaging(1) | TCGA-BH-A1FH-01 | Breast | breast invasive carcinoma | Female | <65 | III/IV | Unknown | Unknown | PD |
| SOSTDC1 | insertion | Frame_Shift_Ins | novel | c.116_117insAG | p.Pro41PhefsTer11 | p.P41Ffs*11 | Q6X4U4 | protein_coding | TCGA-BH-A0E2-01 | Breast | breast invasive carcinoma | Female | <65 | III/IV | Chemotherapy | doxorubicin | SD | ||
| SOSTDC1 | insertion | Nonsense_Mutation | novel | c.115_116insTGTACAAGTAAAACACACTTACTGTTCCGATCCAGTC | p.Pro39LeufsTer4 | p.P39Lfs*4 | Q6X4U4 | protein_coding | TCGA-BH-A0E2-01 | Breast | breast invasive carcinoma | Female | <65 | III/IV | Chemotherapy | doxorubicin | SD | ||
| SOSTDC1 | SNV | Missense_Mutation | rs770948074 | c.458N>A | p.Arg153His | p.R153H | Q6X4U4 | protein_coding | deleterious(0) | probably_damaging(0.997) | TCGA-AA-3715-01 | Colorectum | colon adenocarcinoma | Male | >=65 | I/II | Unknown | Unknown | PD |
| SOSTDC1 | SNV | Missense_Mutation | rs367980297 | c.416G>A | p.Arg139His | p.R139H | Q6X4U4 | protein_coding | deleterious(0) | probably_damaging(0.998) | TCGA-D5-6928-01 | Colorectum | colon adenocarcinoma | Male | >=65 | I/II | Unknown | Unknown | SD |
| SOSTDC1 | SNV | Missense_Mutation | rs770948074 | c.458G>A | p.Arg153His | p.R153H | Q6X4U4 | protein_coding | deleterious(0) | probably_damaging(0.997) | TCGA-D1-A15X-01 | Endometrium | uterine corpus endometrioid carcinoma | Female | <65 | I/II | Unknown | Unknown | SD |
| SOSTDC1 | SNV | Missense_Mutation | rs367980297 | c.416G>A | p.Arg139His | p.R139H | Q6X4U4 | protein_coding | deleterious(0) | probably_damaging(0.998) | TCGA-D1-A16Y-01 | Endometrium | uterine corpus endometrioid carcinoma | Female | <65 | I/II | Unknown | Unknown | SD |
| SOSTDC1 | SNV | Missense_Mutation | novel | c.59N>A | p.Ser20Asn | p.S20N | Q6X4U4 | protein_coding | tolerated(0.16) | benign(0.229) | TCGA-DF-A2KU-01 | Endometrium | uterine corpus endometrioid carcinoma | Female | Unknown | I/II | Unknown | Unknown | SD |
| SOSTDC1 | SNV | Missense_Mutation | novel | c.406N>T | p.Asp136Tyr | p.D136Y | Q6X4U4 | protein_coding | tolerated(0.06) | probably_damaging(0.996) | TCGA-EO-A22X-01 | Endometrium | uterine corpus endometrioid carcinoma | Female | <65 | III/IV | Unspecific | Carboplatin | Complete Response |
| SOSTDC1 | SNV | Missense_Mutation | novel | c.193N>A | p.Leu65Met | p.L65M | Q6X4U4 | protein_coding | tolerated(0.22) | benign(0.007) | TCGA-EO-A3AY-01 | Endometrium | uterine corpus endometrioid carcinoma | Female | <65 | I/II | Unknown | Unknown | PD |
| Page: 1 2 |
Top |
Related drugs of malignant transformation related genes |
| Identification of chemicals and drugs interact with genes involved in malignant transfromation |
| (DGIdb 4.0) |
| Entrez ID | Symbol | Category | Interaction Types | Drug Claim Name | Drug Name | PMIDs |
| Page: 1 |

Copyright 2023-Present -The University of Texas Health Science Center at Houston |