
|
|||||
|
 | |
| |
| |
| |
| |
| |
|
Gene: SOS2 |
Gene summary for SOS2 |
| Gene information | Species | Human | Gene symbol | SOS2 | Gene ID | 6655 |
| Gene name | SOS Ras/Rho guanine nucleotide exchange factor 2 | |
| Gene Alias | NS9 | |
| Cytomap | 14q21.3 | |
| Gene Type | protein-coding | GO ID | GO:0001775 | UniProtAcc | Q07890 |
Top |
Malignant transformation analysis |
| Identification of the aberrant gene expression in precancerous and cancerous lesions by comparing the gene expression of stem-like cells in diseased tissues with normal stem cells |
| Entrez ID | Symbol | Replicates | Species | Organ | Tissue | Adj P-value | Log2FC | Malignancy |
| 6655 | SOS2 | HTA11_3410_2000001011 | Human | Colorectum | AD | 5.90e-08 | -3.85e-01 | 0.0155 |
| 6655 | SOS2 | HTA11_347_2000001011 | Human | Colorectum | AD | 1.11e-12 | 6.60e-01 | -0.1954 |
| 6655 | SOS2 | HTA11_99999971662_82457 | Human | Colorectum | MSS | 3.62e-14 | -5.29e-01 | 0.3859 |
| 6655 | SOS2 | HTA11_99999973899_84307 | Human | Colorectum | MSS | 5.32e-05 | -6.05e-01 | 0.2585 |
| 6655 | SOS2 | HTA11_99999974143_84620 | Human | Colorectum | MSS | 2.70e-06 | -4.25e-01 | 0.3005 |
| 6655 | SOS2 | F007 | Human | Colorectum | FAP | 2.46e-02 | -1.15e-01 | 0.1176 |
| 6655 | SOS2 | A001-C-207 | Human | Colorectum | FAP | 1.01e-04 | -2.59e-01 | 0.1278 |
| 6655 | SOS2 | A015-C-203 | Human | Colorectum | FAP | 3.31e-28 | -3.42e-01 | -0.1294 |
| 6655 | SOS2 | A015-C-204 | Human | Colorectum | FAP | 2.81e-07 | -3.00e-01 | -0.0228 |
| 6655 | SOS2 | A014-C-040 | Human | Colorectum | FAP | 1.38e-04 | -2.84e-01 | -0.1184 |
| 6655 | SOS2 | A002-C-201 | Human | Colorectum | FAP | 9.20e-12 | -2.45e-01 | 0.0324 |
| 6655 | SOS2 | A002-C-203 | Human | Colorectum | FAP | 1.72e-04 | -1.82e-01 | 0.2786 |
| 6655 | SOS2 | A001-C-119 | Human | Colorectum | FAP | 2.06e-04 | -7.76e-02 | -0.1557 |
| 6655 | SOS2 | A001-C-108 | Human | Colorectum | FAP | 4.26e-14 | -1.81e-01 | -0.0272 |
| 6655 | SOS2 | A002-C-205 | Human | Colorectum | FAP | 3.27e-24 | -2.81e-01 | -0.1236 |
| 6655 | SOS2 | A001-C-104 | Human | Colorectum | FAP | 2.93e-03 | -1.61e-01 | 0.0184 |
| 6655 | SOS2 | A015-C-005 | Human | Colorectum | FAP | 2.45e-03 | -2.62e-01 | -0.0336 |
| 6655 | SOS2 | A015-C-006 | Human | Colorectum | FAP | 5.94e-20 | -6.06e-01 | -0.0994 |
| 6655 | SOS2 | A015-C-106 | Human | Colorectum | FAP | 6.24e-08 | -1.51e-01 | -0.0511 |
| 6655 | SOS2 | A002-C-114 | Human | Colorectum | FAP | 7.39e-18 | -2.31e-01 | -0.1561 |
| Page: 1 2 3 4 |
| Tissue | Expression Dynamics | Abbreviation |
| Colorectum (GSE201348) |  | FAP: Familial adenomatous polyposis |
| CRC: Colorectal cancer | ||
| Colorectum (HTA11) |  | AD: Adenomas |
| SER: Sessile serrated lesions | ||
| MSI-H: Microsatellite-high colorectal cancer | ||
| MSS: Microsatellite stable colorectal cancer | ||
| Lung |  | AAH: Atypical adenomatous hyperplasia |
| AIS: Adenocarcinoma in situ | ||
| IAC: Invasive lung adenocarcinoma | ||
| MIA: Minimally invasive adenocarcinoma | ||
| Prostate | 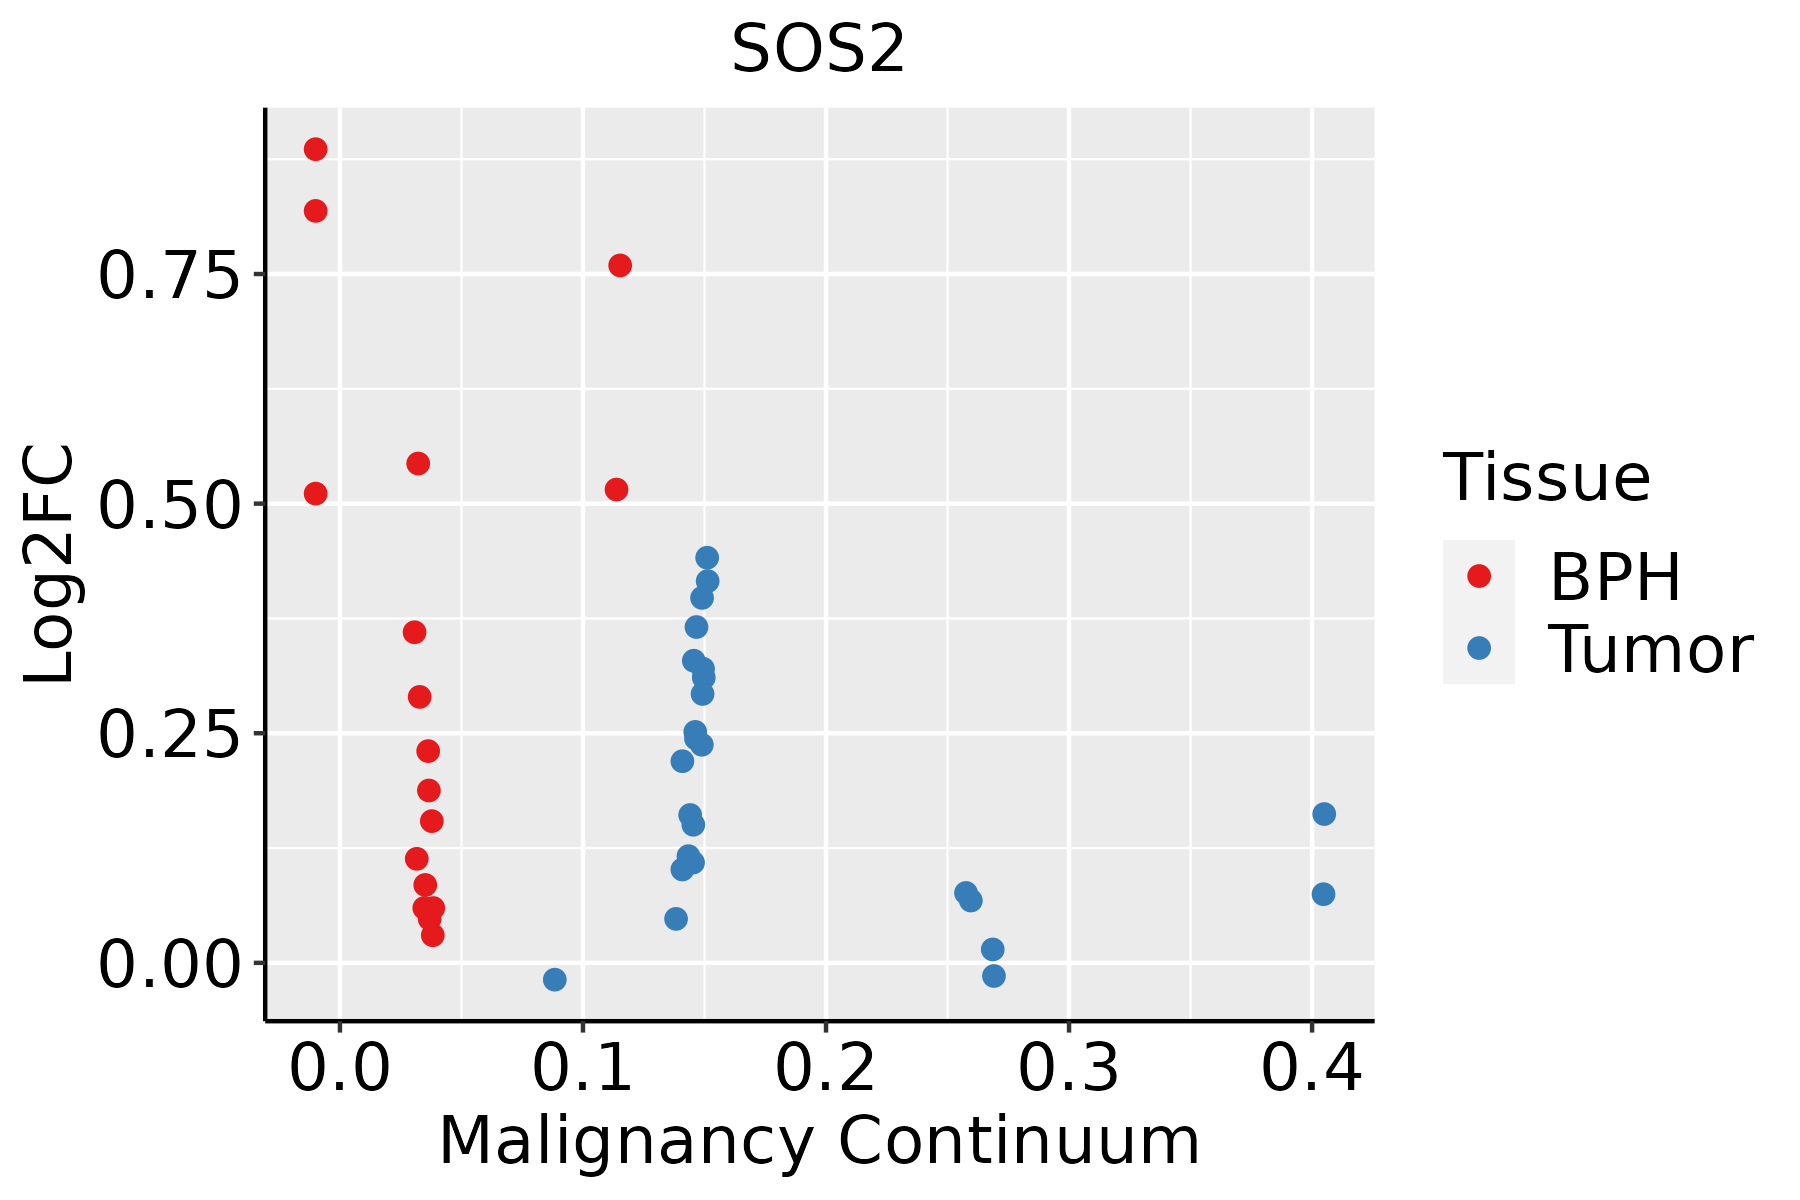 | BPH: Benign Prostatic Hyperplasia |
| Skin | 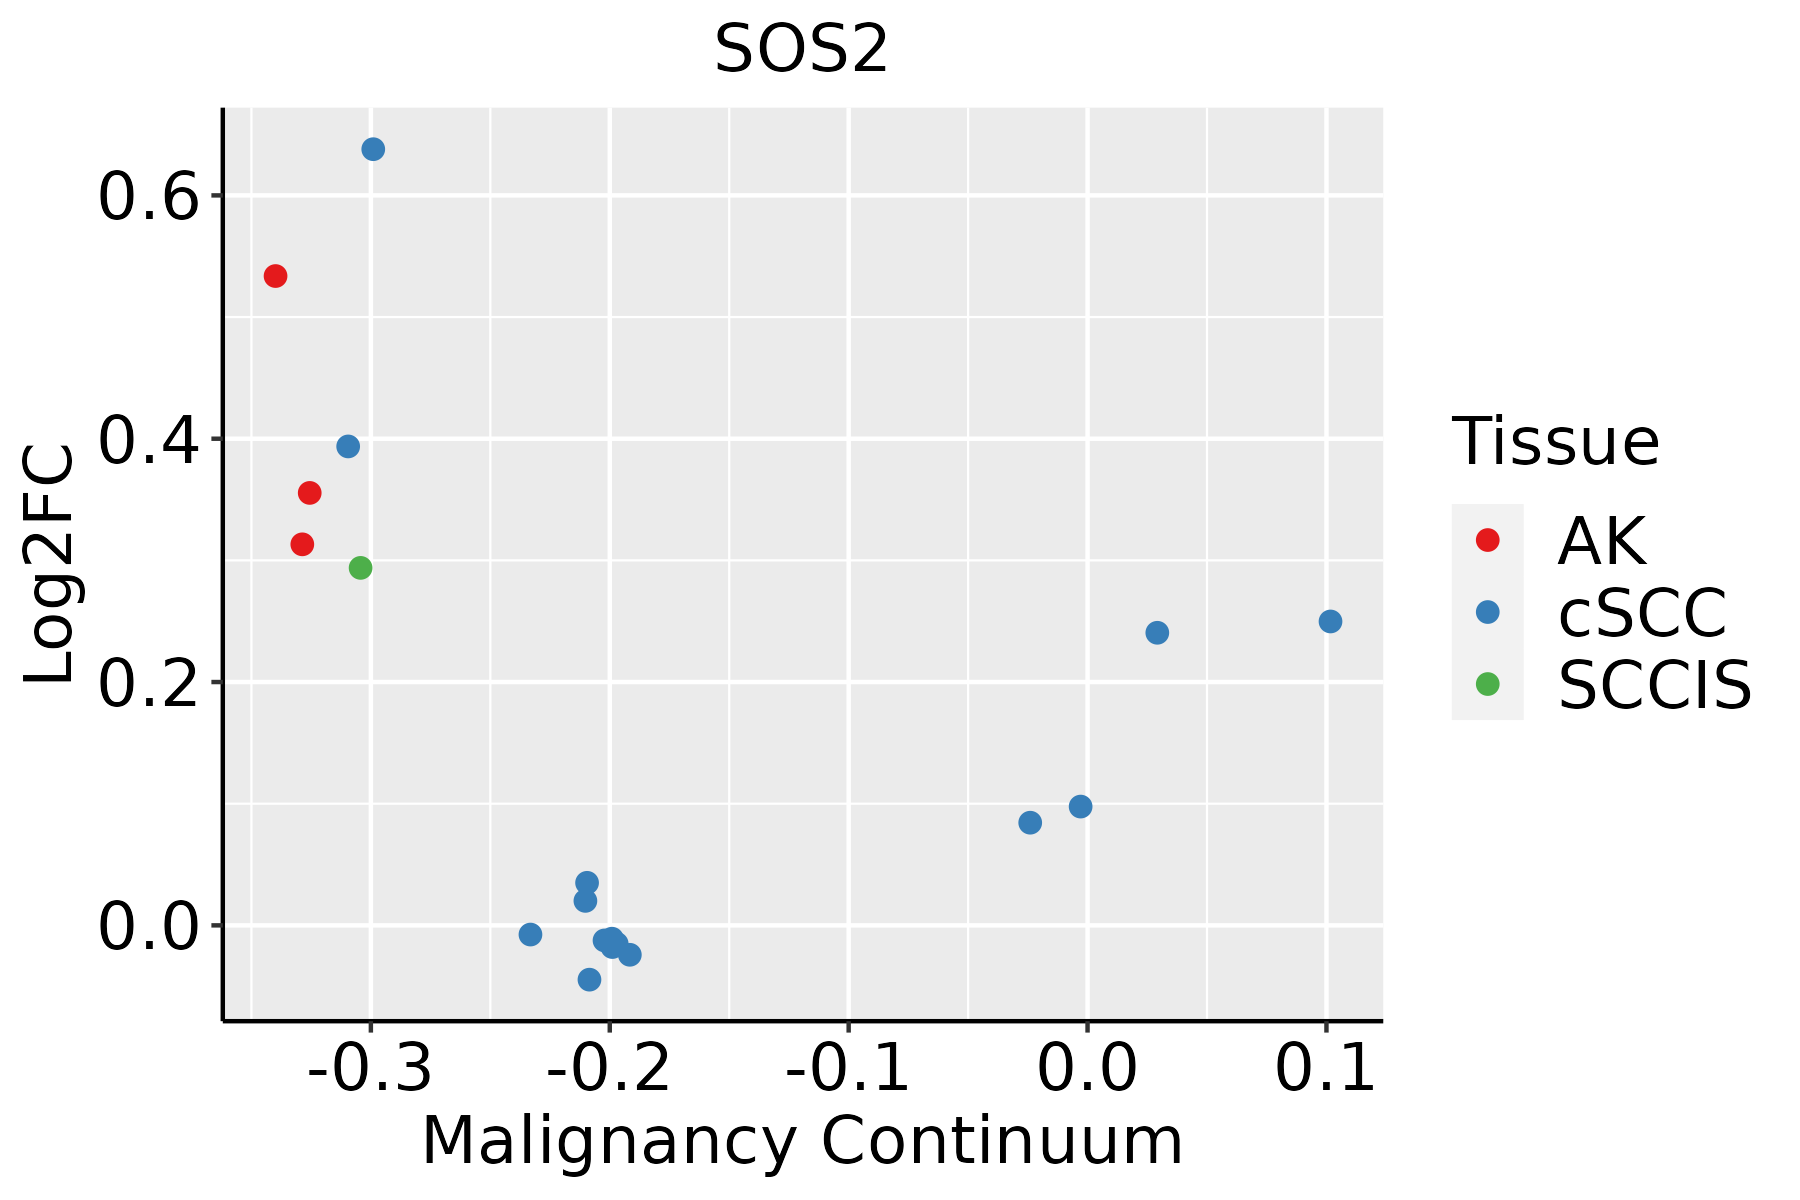 | AK: Actinic keratosis |
| cSCC: Cutaneous squamous cell carcinoma | ||
| SCCIS:squamous cell carcinoma in situ |
| ∗log2FC in expression of this searched gene in stem-like cells from each diseased tissue sample relative to stem-like cells in normal samples in each tissue plotted against the malignancy continuum. Samples are colored based on if they are from different disease stage. |
Top |
Malignant transformation related pathway analysis |
| Find out the enriched GO biological processes and KEGG pathways involved in transition from healthy to precancer to cancer |
| Tissue | Disease Stage | Enriched GO biological Processes |
| Colorectum | AD |  |
| Colorectum | SER |  |
| Colorectum | MSS |  |
| Colorectum | MSI-H |  |
| Colorectum | FAP |  |
| ∗Top 15 enriched GO BP terms are showed in the bar plot of each disease state in each tissue. Each row represents a significant GO biological process which is colored according to the -log10(p.adjust). |
| Page: 1 2 3 4 5 6 7 8 9 |
| GO ID | Tissue | Disease Stage | Description | Gene Ratio | Bg Ratio | pvalue | p.adjust | Count |
| GO:0048872 | Colorectum | AD | homeostasis of number of cells | 87/3918 | 272/18723 | 1.16e-05 | 2.61e-04 | 87 |
| GO:0051056 | Colorectum | AD | regulation of small GTPase mediated signal transduction | 94/3918 | 302/18723 | 1.81e-05 | 3.76e-04 | 94 |
| GO:1903706 | Colorectum | AD | regulation of hemopoiesis | 99/3918 | 367/18723 | 3.08e-03 | 2.28e-02 | 99 |
| GO:0001782 | Colorectum | AD | B cell homeostasis | 13/3918 | 31/18723 | 6.53e-03 | 4.06e-02 | 13 |
| GO:00488722 | Colorectum | MSS | homeostasis of number of cells | 82/3467 | 272/18723 | 2.02e-06 | 6.28e-05 | 82 |
| GO:00510561 | Colorectum | MSS | regulation of small GTPase mediated signal transduction | 82/3467 | 302/18723 | 1.31e-04 | 1.99e-03 | 82 |
| GO:19037061 | Colorectum | MSS | regulation of hemopoiesis | 89/3467 | 367/18723 | 3.39e-03 | 2.56e-02 | 89 |
| GO:00017821 | Colorectum | MSS | B cell homeostasis | 12/3467 | 31/18723 | 6.80e-03 | 4.39e-02 | 12 |
| GO:0002244 | Colorectum | MSS | hematopoietic progenitor cell differentiation | 32/3467 | 114/18723 | 8.07e-03 | 4.91e-02 | 32 |
| GO:00510562 | Colorectum | FAP | regulation of small GTPase mediated signal transduction | 78/2622 | 302/18723 | 3.25e-08 | 2.85e-06 | 78 |
| GO:00488724 | Colorectum | FAP | homeostasis of number of cells | 60/2622 | 272/18723 | 1.91e-04 | 2.79e-03 | 60 |
| GO:00022441 | Colorectum | FAP | hematopoietic progenitor cell differentiation | 29/2622 | 114/18723 | 8.35e-04 | 8.71e-03 | 29 |
| GO:1903131 | Colorectum | FAP | mononuclear cell differentiation | 79/2622 | 426/18723 | 5.00e-03 | 3.33e-02 | 79 |
| GO:19037063 | Colorectum | FAP | regulation of hemopoiesis | 69/2622 | 367/18723 | 6.01e-03 | 3.78e-02 | 69 |
| GO:00510563 | Colorectum | CRC | regulation of small GTPase mediated signal transduction | 69/2078 | 302/18723 | 3.34e-09 | 9.08e-07 | 69 |
| GO:00488725 | Colorectum | CRC | homeostasis of number of cells | 48/2078 | 272/18723 | 7.78e-04 | 9.87e-03 | 48 |
| GO:00022442 | Colorectum | CRC | hematopoietic progenitor cell differentiation | 23/2078 | 114/18723 | 3.20e-03 | 2.79e-02 | 23 |
| GO:00510565 | Lung | IAC | regulation of small GTPase mediated signal transduction | 70/2061 | 302/18723 | 9.44e-10 | 1.87e-07 | 70 |
| GO:00488728 | Lung | IAC | homeostasis of number of cells | 54/2061 | 272/18723 | 1.20e-05 | 3.64e-04 | 54 |
| GO:00421106 | Lung | IAC | T cell activation | 77/2061 | 487/18723 | 6.82e-04 | 9.20e-03 | 77 |
| Page: 1 2 3 4 5 6 |
| Pathway ID | Tissue | Disease Stage | Description | Gene Ratio | Bg Ratio | pvalue | p.adjust | qvalue | Count |
| hsa05208 | Colorectum | AD | Chemical carcinogenesis - reactive oxygen species | 126/2092 | 223/8465 | 1.01e-24 | 1.68e-22 | 1.07e-22 | 126 |
| hsa04714 | Colorectum | AD | Thermogenesis | 120/2092 | 232/8465 | 2.76e-19 | 1.16e-17 | 7.37e-18 | 120 |
| hsa04722 | Colorectum | AD | Neurotrophin signaling pathway | 50/2092 | 119/8465 | 2.28e-05 | 2.24e-04 | 1.43e-04 | 50 |
| hsa05213 | Colorectum | AD | Endometrial cancer | 29/2092 | 58/8465 | 2.69e-05 | 2.57e-04 | 1.64e-04 | 29 |
| hsa05210 | Colorectum | AD | Colorectal cancer | 35/2092 | 86/8465 | 7.54e-04 | 5.49e-03 | 3.50e-03 | 35 |
| hsa05205 | Colorectum | AD | Proteoglycans in cancer | 70/2092 | 205/8465 | 1.37e-03 | 8.46e-03 | 5.39e-03 | 70 |
| hsa05220 | Colorectum | AD | Chronic myeloid leukemia | 31/2092 | 76/8465 | 1.41e-03 | 8.46e-03 | 5.39e-03 | 31 |
| hsa05225 | Colorectum | AD | Hepatocellular carcinoma | 59/2092 | 168/8465 | 1.50e-03 | 8.69e-03 | 5.54e-03 | 59 |
| hsa05163 | Colorectum | AD | Human cytomegalovirus infection | 75/2092 | 225/8465 | 2.00e-03 | 1.10e-02 | 7.01e-03 | 75 |
| hsa05211 | Colorectum | AD | Renal cell carcinoma | 28/2092 | 69/8465 | 2.58e-03 | 1.37e-02 | 8.75e-03 | 28 |
| hsa04810 | Colorectum | AD | Regulation of actin cytoskeleton | 75/2092 | 229/8465 | 3.36e-03 | 1.76e-02 | 1.12e-02 | 75 |
| hsa04912 | Colorectum | AD | GnRH signaling pathway | 35/2092 | 93/8465 | 3.69e-03 | 1.90e-02 | 1.21e-02 | 35 |
| hsa05160 | Colorectum | AD | Hepatitis C | 54/2092 | 157/8465 | 3.87e-03 | 1.96e-02 | 1.25e-02 | 54 |
| hsa04510 | Colorectum | AD | Focal adhesion | 67/2092 | 203/8465 | 4.40e-03 | 2.17e-02 | 1.38e-02 | 67 |
| hsa05215 | Colorectum | AD | Prostate cancer | 35/2092 | 97/8465 | 7.95e-03 | 3.13e-02 | 2.00e-02 | 35 |
| hsa04012 | Colorectum | AD | ErbB signaling pathway | 31/2092 | 85/8465 | 1.02e-02 | 3.91e-02 | 2.50e-02 | 31 |
| hsa01521 | Colorectum | AD | EGFR tyrosine kinase inhibitor resistance | 29/2092 | 79/8465 | 1.15e-02 | 4.24e-02 | 2.71e-02 | 29 |
| hsa052081 | Colorectum | AD | Chemical carcinogenesis - reactive oxygen species | 126/2092 | 223/8465 | 1.01e-24 | 1.68e-22 | 1.07e-22 | 126 |
| hsa047141 | Colorectum | AD | Thermogenesis | 120/2092 | 232/8465 | 2.76e-19 | 1.16e-17 | 7.37e-18 | 120 |
| hsa047221 | Colorectum | AD | Neurotrophin signaling pathway | 50/2092 | 119/8465 | 2.28e-05 | 2.24e-04 | 1.43e-04 | 50 |
| Page: 1 2 3 4 5 6 7 8 9 10 11 12 13 14 15 16 17 18 19 |
Top |
Cell-cell communication analysis |
| Identification of potential cell-cell interactions between two cell types and their ligand-receptor pairs for different disease states |
| Ligand | Receptor | LRpair | Pathway | Tissue | Disease Stage |
| Page: 1 |
Top |
Single-cell gene regulatory network inference analysis |
| Find out the significant the regulons (TFs) and the target genes of each regulon across cell types for different disease states |
| TF | Cell Type | Tissue | Disease Stage | Target Gene | RSS | Regulon Activity |
| ∗The dot plots of a searched regulon are shown for all cell subpopulations in each disease state of each tissue based on the regulon specific score inferred using pySCENIC and by calculating the average expression. |
| Page: 1 |
Top |
Somatic mutation of malignant transformation related genes |
| Annotation of somatic variants for genes involved in malignant transformation |
| Hugo Symbol | Variant Class | Variant Classification | dbSNP RS | HGVSc | HGVSp | HGVSp Short | SWISSPROT | BIOTYPE | SIFT | PolyPhen | Tumor Sample Barcode | Tissue | Histology | Sex | Age | Stage | Therapy Types | Drugs | Outcome |
| SOS2 | SNV | Missense_Mutation | c.517N>G | p.Met173Val | p.M173V | Q07890 | protein_coding | deleterious(0.01) | possibly_damaging(0.657) | TCGA-AC-A23H-01 | Breast | breast invasive carcinoma | Female | >=65 | I/II | Unknown | Unknown | PD | |
| SOS2 | SNV | Missense_Mutation | c.1984N>C | p.Glu662Gln | p.E662Q | Q07890 | protein_coding | tolerated(0.26) | benign(0.044) | TCGA-BH-A0DZ-01 | Breast | breast invasive carcinoma | Female | <65 | I/II | Chemotherapy | docetaxel | SD | |
| SOS2 | SNV | Missense_Mutation | rs376799463 | c.919N>A | p.Glu307Lys | p.E307K | Q07890 | protein_coding | deleterious(0.02) | benign(0.07) | TCGA-BH-A28O-01 | Breast | breast invasive carcinoma | Female | <65 | III/IV | Chemotherapy | cytoxan | CR |
| SOS2 | SNV | Missense_Mutation | novel | c.1482N>C | p.Met494Ile | p.M494I | Q07890 | protein_coding | tolerated(0.56) | benign(0.062) | TCGA-C8-A8HP-01 | Breast | breast invasive carcinoma | Female | <65 | III/IV | Chemotherapy | 5-fluorouracil | CR |
| SOS2 | SNV | Missense_Mutation | c.2027N>A | p.Arg676His | p.R676H | Q07890 | protein_coding | deleterious(0) | benign(0.28) | TCGA-D8-A1JS-01 | Breast | breast invasive carcinoma | Female | >=65 | I/II | Hormone Therapy | tamoxiphen | SD | |
| SOS2 | SNV | Missense_Mutation | c.2864N>G | p.Asn955Ser | p.N955S | Q07890 | protein_coding | deleterious(0.05) | possibly_damaging(0.84) | TCGA-D8-A1Y0-01 | Breast | breast invasive carcinoma | Female | >=65 | III/IV | Chemotherapy | cyclophosphamide+methotrexatum+fluorouracillum | SD | |
| SOS2 | deletion | In_Frame_Del | novel | c.1491_1496delNNNNNN | p.Gln498_Ile499del | p.Q498_I499del | Q07890 | protein_coding | TCGA-A2-A3Y0-01 | Breast | breast invasive carcinoma | Female | <65 | I/II | Chemotherapy | adriamycin | CR | ||
| SOS2 | deletion | Frame_Shift_Del | novel | c.1291delN | p.Glu431LysfsTer18 | p.E431Kfs*18 | Q07890 | protein_coding | TCGA-EW-A2FV-01 | Breast | breast invasive carcinoma | Female | <65 | III/IV | Chemotherapy | docetaxel | SD | ||
| SOS2 | SNV | Missense_Mutation | c.1933N>T | p.Arg645Trp | p.R645W | Q07890 | protein_coding | deleterious(0) | probably_damaging(1) | TCGA-2W-A8YY-01 | Cervix | cervical & endocervical cancer | Female | <65 | I/II | Chemotherapy | cisplatin | CR | |
| SOS2 | SNV | Missense_Mutation | novel | c.3244N>C | p.Ala1082Pro | p.A1082P | Q07890 | protein_coding | tolerated(0.12) | benign(0.01) | TCGA-DS-A0VL-01 | Cervix | cervical & endocervical cancer | Female | <65 | I/II | Unknown | Unknown | SD |
| Page: 1 2 3 4 5 6 7 8 9 10 11 12 13 14 15 |
Top |
Related drugs of malignant transformation related genes |
| Identification of chemicals and drugs interact with genes involved in malignant transfromation |
| (DGIdb 4.0) |
| Entrez ID | Symbol | Category | Interaction Types | Drug Claim Name | Drug Name | PMIDs |
| Page: 1 |

Copyright 2023-Present -The University of Texas Health Science Center at Houston |