
|
|||||
|
 | |
| |
| |
| |
| |
| |
|
Gene: SORT1 |
Gene summary for SORT1 |
| Gene information | Species | Human | Gene symbol | SORT1 | Gene ID | 6272 |
| Gene name | sortilin 1 | |
| Gene Alias | Gp95 | |
| Cytomap | 1p13.3 | |
| Gene Type | protein-coding | GO ID | GO:0001503 | UniProtAcc | Q99523 |
Top |
Malignant transformation analysis |
| Identification of the aberrant gene expression in precancerous and cancerous lesions by comparing the gene expression of stem-like cells in diseased tissues with normal stem cells |
| Entrez ID | Symbol | Replicates | Species | Organ | Tissue | Adj P-value | Log2FC | Malignancy |
| 6272 | SORT1 | LZE24T | Human | Esophagus | ESCC | 3.38e-06 | 1.04e-01 | 0.0596 |
| 6272 | SORT1 | P1T-E | Human | Esophagus | ESCC | 1.09e-03 | 2.92e-01 | 0.0875 |
| 6272 | SORT1 | P2T-E | Human | Esophagus | ESCC | 3.20e-07 | 1.66e-01 | 0.1177 |
| 6272 | SORT1 | P4T-E | Human | Esophagus | ESCC | 3.98e-13 | 2.96e-01 | 0.1323 |
| 6272 | SORT1 | P5T-E | Human | Esophagus | ESCC | 4.09e-08 | 1.70e-01 | 0.1327 |
| 6272 | SORT1 | P8T-E | Human | Esophagus | ESCC | 1.53e-15 | 1.83e-01 | 0.0889 |
| 6272 | SORT1 | P10T-E | Human | Esophagus | ESCC | 6.79e-11 | 1.60e-01 | 0.116 |
| 6272 | SORT1 | P12T-E | Human | Esophagus | ESCC | 2.00e-27 | 5.49e-01 | 0.1122 |
| 6272 | SORT1 | P16T-E | Human | Esophagus | ESCC | 9.42e-17 | 2.06e-01 | 0.1153 |
| 6272 | SORT1 | P17T-E | Human | Esophagus | ESCC | 9.55e-04 | 1.80e-01 | 0.1278 |
| 6272 | SORT1 | P19T-E | Human | Esophagus | ESCC | 9.77e-03 | 3.02e-01 | 0.1662 |
| 6272 | SORT1 | P20T-E | Human | Esophagus | ESCC | 3.37e-04 | 1.41e-01 | 0.1124 |
| 6272 | SORT1 | P21T-E | Human | Esophagus | ESCC | 1.32e-02 | 2.99e-02 | 0.1617 |
| 6272 | SORT1 | P22T-E | Human | Esophagus | ESCC | 2.21e-04 | -1.47e-02 | 0.1236 |
| 6272 | SORT1 | P24T-E | Human | Esophagus | ESCC | 1.15e-06 | 3.58e-02 | 0.1287 |
| 6272 | SORT1 | P26T-E | Human | Esophagus | ESCC | 3.72e-08 | 8.00e-02 | 0.1276 |
| 6272 | SORT1 | P27T-E | Human | Esophagus | ESCC | 4.23e-06 | 1.19e-01 | 0.1055 |
| 6272 | SORT1 | P28T-E | Human | Esophagus | ESCC | 9.05e-06 | 8.59e-02 | 0.1149 |
| 6272 | SORT1 | P37T-E | Human | Esophagus | ESCC | 7.40e-18 | 3.00e-01 | 0.1371 |
| 6272 | SORT1 | P39T-E | Human | Esophagus | ESCC | 1.46e-08 | 1.18e-01 | 0.0894 |
| Page: 1 2 3 4 |
| Tissue | Expression Dynamics | Abbreviation |
| Esophagus | 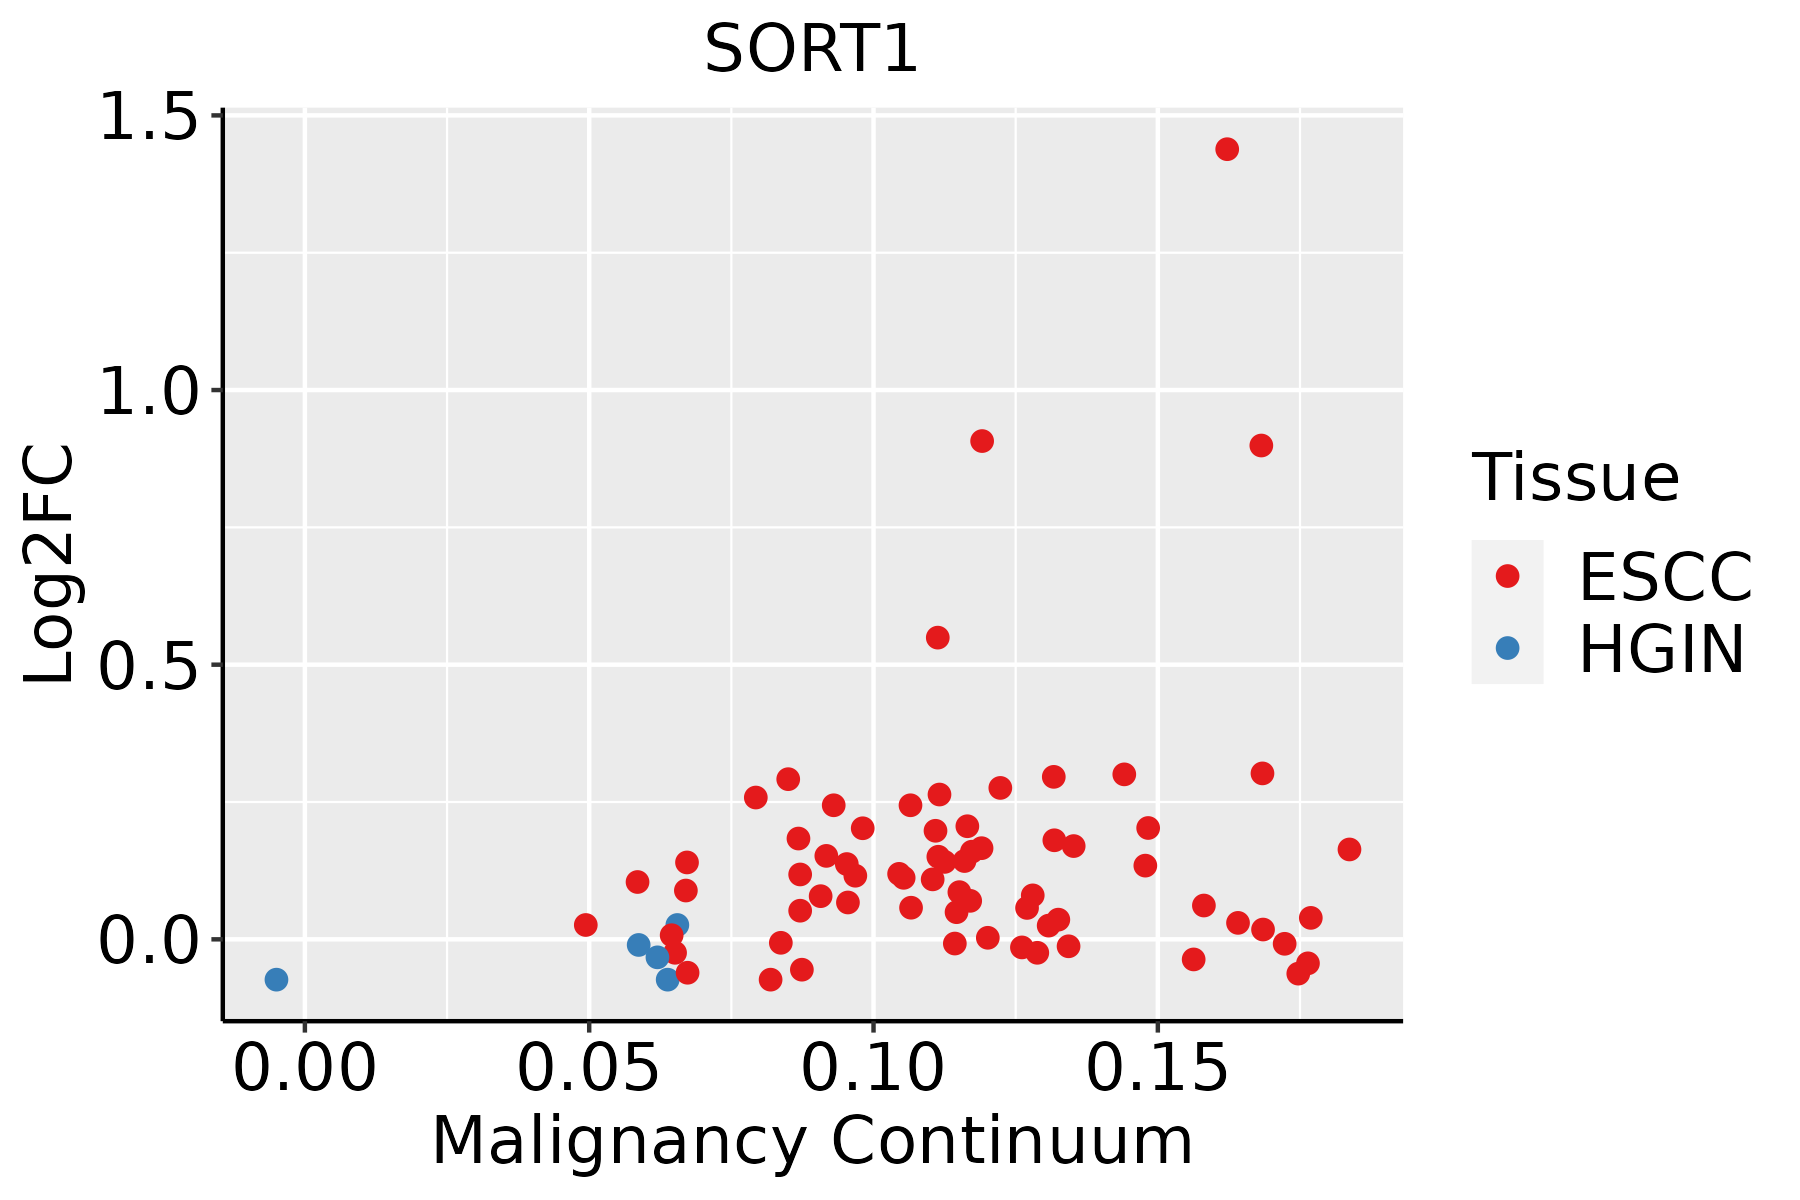 | ESCC: Esophageal squamous cell carcinoma |
| HGIN: High-grade intraepithelial neoplasias | ||
| LGIN: Low-grade intraepithelial neoplasias | ||
| Liver | 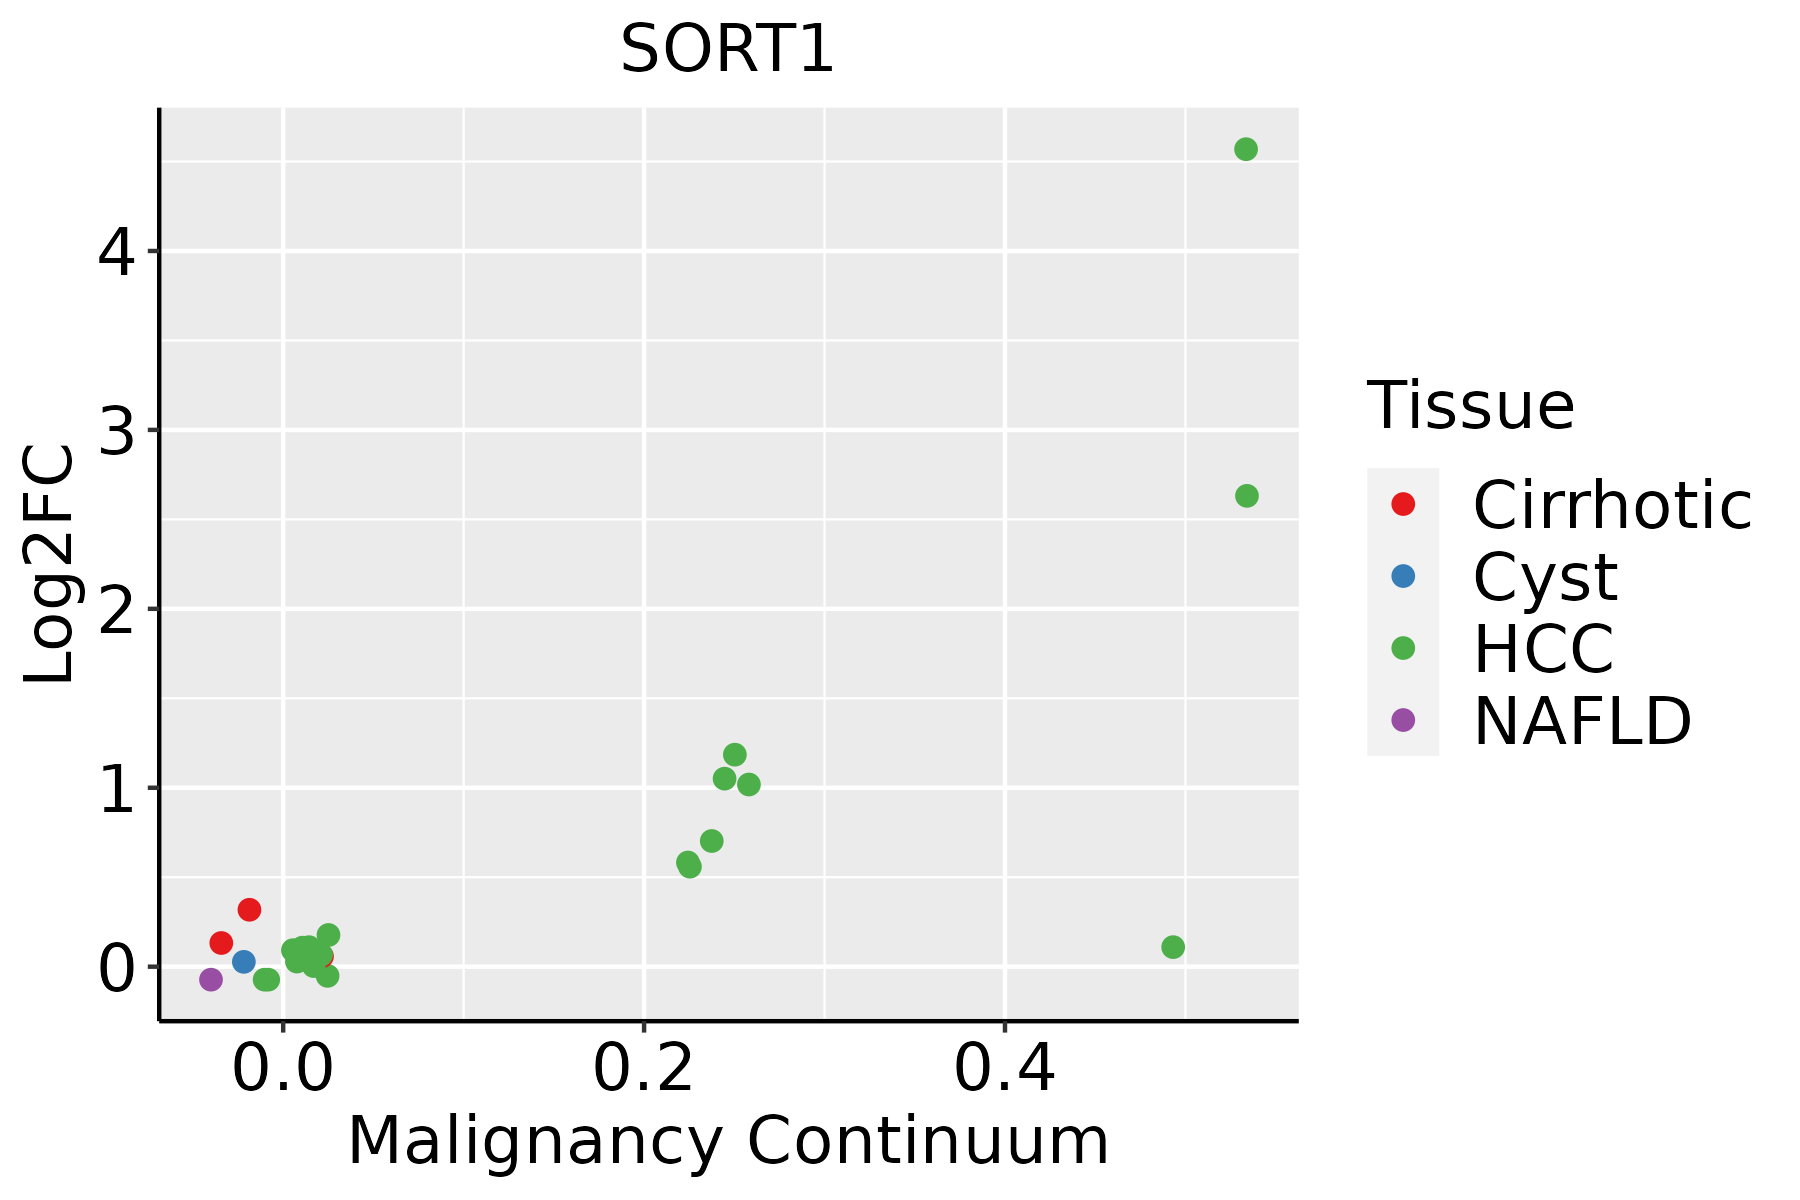 | HCC: Hepatocellular carcinoma |
| NAFLD: Non-alcoholic fatty liver disease | ||
| Prostate | 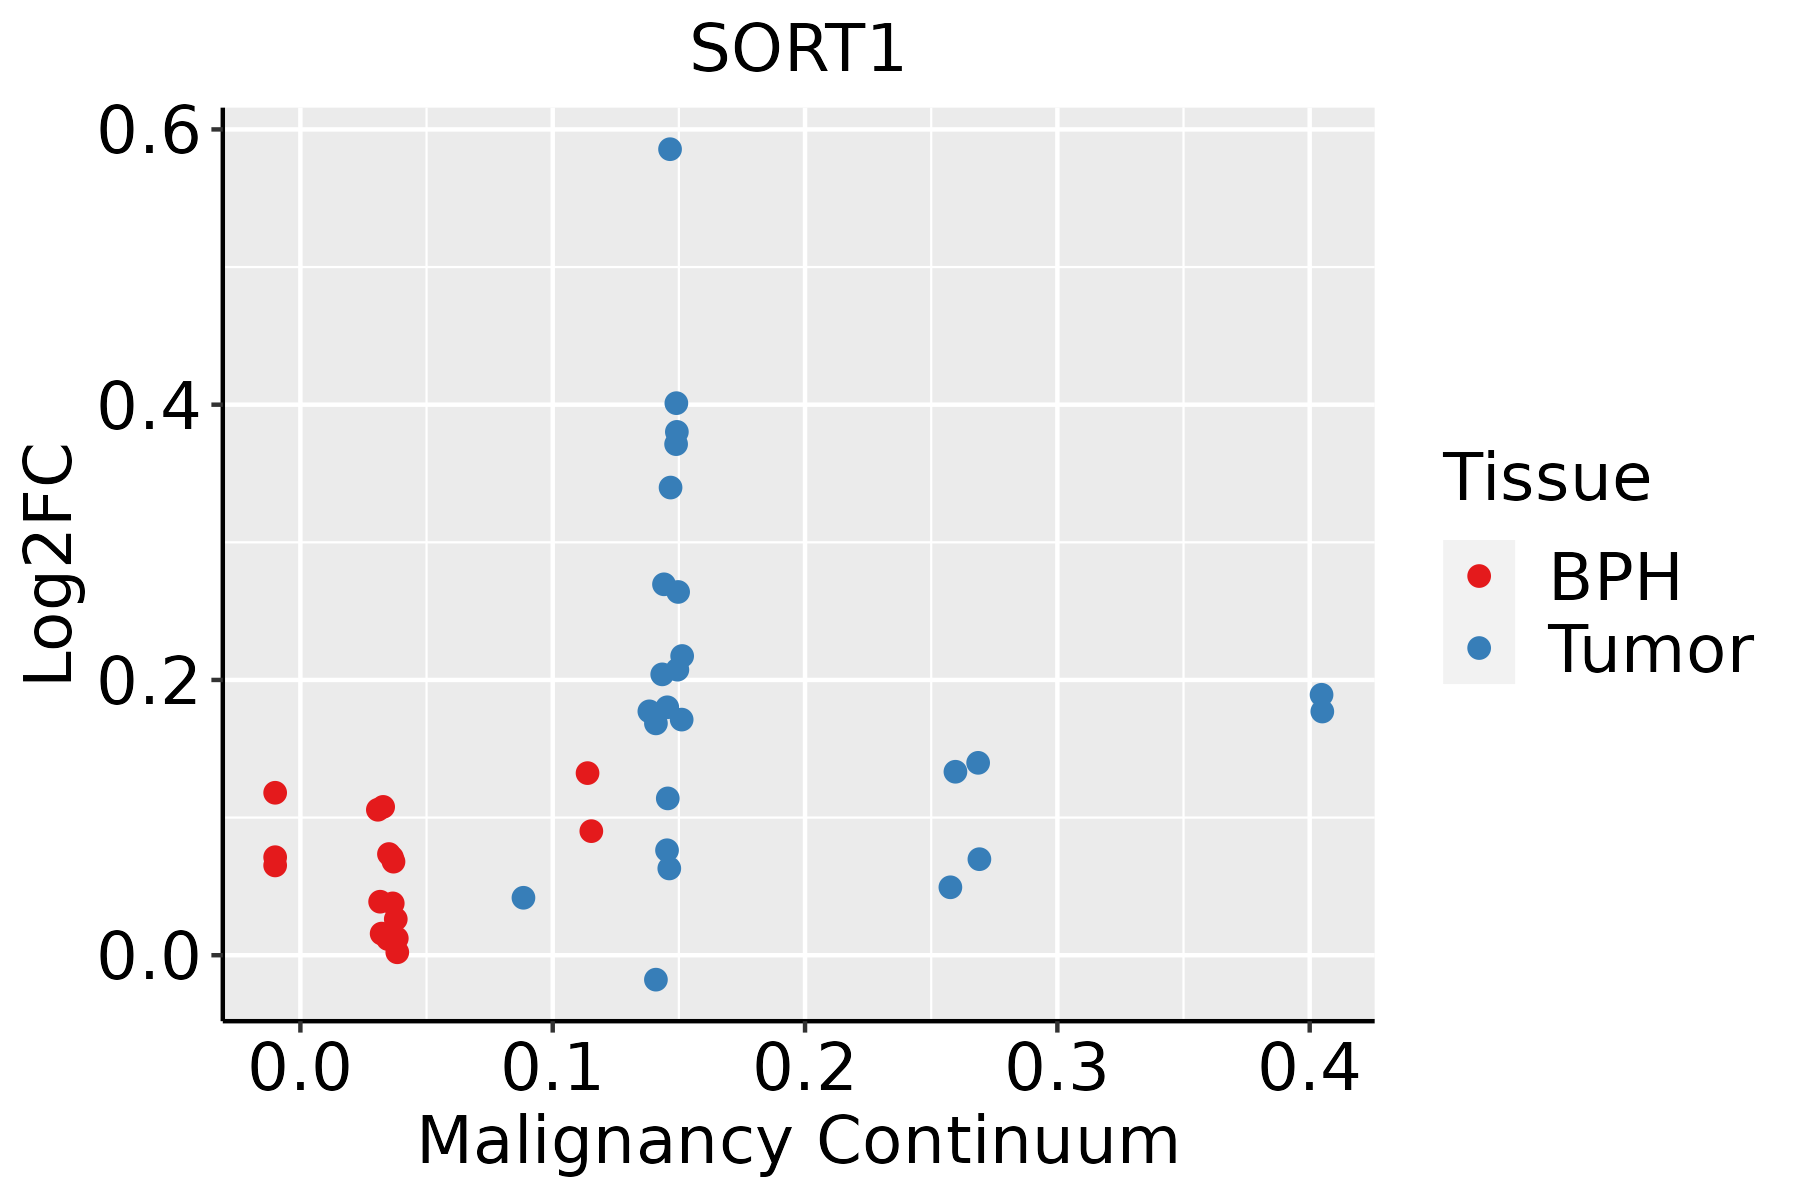 | BPH: Benign Prostatic Hyperplasia |
| Thyroid |  | ATC: Anaplastic thyroid cancer |
| HT: Hashimoto's thyroiditis | ||
| PTC: Papillary thyroid cancer |
| ∗log2FC in expression of this searched gene in stem-like cells from each diseased tissue sample relative to stem-like cells in normal samples in each tissue plotted against the malignancy continuum. Samples are colored based on if they are from different disease stage. |
Top |
Malignant transformation related pathway analysis |
| Find out the enriched GO biological processes and KEGG pathways involved in transition from healthy to precancer to cancer |
| Tissue | Disease Stage | Enriched GO biological Processes |
| Colorectum | AD |  |
| Colorectum | SER |  |
| Colorectum | MSS |  |
| Colorectum | MSI-H |  |
| Colorectum | FAP |  |
| ∗Top 15 enriched GO BP terms are showed in the bar plot of each disease state in each tissue. Each row represents a significant GO biological process which is colored according to the -log10(p.adjust). |
| Page: 1 2 3 4 5 6 7 8 9 |
| GO ID | Tissue | Disease Stage | Description | Gene Ratio | Bg Ratio | pvalue | p.adjust | Count |
| GO:0072594110 | Esophagus | ESCC | establishment of protein localization to organelle | 311/8552 | 422/18723 | 3.02e-32 | 2.13e-29 | 311 |
| GO:004819318 | Esophagus | ESCC | Golgi vesicle transport | 231/8552 | 296/18723 | 1.82e-30 | 9.63e-28 | 231 |
| GO:0006605111 | Esophagus | ESCC | protein targeting | 229/8552 | 314/18723 | 4.93e-23 | 1.01e-20 | 229 |
| GO:001605014 | Esophagus | ESCC | vesicle organization | 211/8552 | 300/18723 | 2.85e-18 | 2.87e-16 | 211 |
| GO:001619715 | Esophagus | ESCC | endosomal transport | 168/8552 | 230/18723 | 2.28e-17 | 1.93e-15 | 168 |
| GO:0097191111 | Esophagus | ESCC | extrinsic apoptotic signaling pathway | 159/8552 | 219/18723 | 4.12e-16 | 2.94e-14 | 159 |
| GO:000703417 | Esophagus | ESCC | vacuolar transport | 119/8552 | 157/18723 | 1.16e-14 | 6.30e-13 | 119 |
| GO:001648210 | Esophagus | ESCC | cytosolic transport | 124/8552 | 168/18723 | 9.69e-14 | 4.69e-12 | 124 |
| GO:000689215 | Esophagus | ESCC | post-Golgi vesicle-mediated transport | 82/8552 | 104/18723 | 4.00e-12 | 1.55e-10 | 82 |
| GO:007198514 | Esophagus | ESCC | multivesicular body sorting pathway | 34/8552 | 37/18723 | 3.49e-09 | 7.39e-08 | 34 |
| GO:00070419 | Esophagus | ESCC | lysosomal transport | 83/8552 | 114/18723 | 3.52e-09 | 7.41e-08 | 83 |
| GO:003250915 | Esophagus | ESCC | endosome transport via multivesicular body sorting pathway | 29/8552 | 31/18723 | 1.92e-08 | 3.72e-07 | 29 |
| GO:00726659 | Esophagus | ESCC | protein localization to vacuole | 52/8552 | 67/18723 | 9.14e-08 | 1.52e-06 | 52 |
| GO:000862519 | Esophagus | ESCC | extrinsic apoptotic signaling pathway via death domain receptors | 59/8552 | 82/18723 | 1.23e-06 | 1.52e-05 | 59 |
| GO:00066238 | Esophagus | ESCC | protein targeting to vacuole | 31/8552 | 37/18723 | 1.95e-06 | 2.26e-05 | 31 |
| GO:000150317 | Esophagus | ESCC | ossification | 232/8552 | 408/18723 | 3.00e-06 | 3.40e-05 | 232 |
| GO:0043434111 | Esophagus | ESCC | response to peptide hormone | 234/8552 | 414/18723 | 4.93e-06 | 5.21e-05 | 234 |
| GO:003286818 | Esophagus | ESCC | response to insulin | 156/8552 | 264/18723 | 7.21e-06 | 7.20e-05 | 156 |
| GO:00726668 | Esophagus | ESCC | establishment of protein localization to vacuole | 37/8552 | 49/18723 | 2.05e-05 | 1.78e-04 | 37 |
| GO:00454449 | Esophagus | ESCC | fat cell differentiation | 135/8552 | 229/18723 | 3.38e-05 | 2.78e-04 | 135 |
| Page: 1 2 3 4 5 6 7 8 9 10 11 |
| Pathway ID | Tissue | Disease Stage | Description | Gene Ratio | Bg Ratio | pvalue | p.adjust | qvalue | Count |
| hsa0414222 | Esophagus | ESCC | Lysosome | 102/4205 | 132/8465 | 5.11e-11 | 7.13e-10 | 3.65e-10 | 102 |
| hsa0472225 | Esophagus | ESCC | Neurotrophin signaling pathway | 80/4205 | 119/8465 | 7.33e-05 | 3.07e-04 | 1.57e-04 | 80 |
| hsa0414232 | Esophagus | ESCC | Lysosome | 102/4205 | 132/8465 | 5.11e-11 | 7.13e-10 | 3.65e-10 | 102 |
| hsa04722111 | Esophagus | ESCC | Neurotrophin signaling pathway | 80/4205 | 119/8465 | 7.33e-05 | 3.07e-04 | 1.57e-04 | 80 |
| hsa041424 | Liver | Cirrhotic | Lysosome | 68/2530 | 132/8465 | 1.34e-07 | 1.97e-06 | 1.21e-06 | 68 |
| hsa049792 | Liver | Cirrhotic | Cholesterol metabolism | 30/2530 | 51/8465 | 1.59e-05 | 1.39e-04 | 8.60e-05 | 30 |
| hsa0414211 | Liver | Cirrhotic | Lysosome | 68/2530 | 132/8465 | 1.34e-07 | 1.97e-06 | 1.21e-06 | 68 |
| hsa049793 | Liver | Cirrhotic | Cholesterol metabolism | 30/2530 | 51/8465 | 1.59e-05 | 1.39e-04 | 8.60e-05 | 30 |
| hsa041422 | Liver | HCC | Lysosome | 100/4020 | 132/8465 | 2.32e-11 | 4.31e-10 | 2.40e-10 | 100 |
| hsa049794 | Liver | HCC | Cholesterol metabolism | 41/4020 | 51/8465 | 1.33e-06 | 1.35e-05 | 7.49e-06 | 41 |
| hsa0472210 | Liver | HCC | Neurotrophin signaling pathway | 74/4020 | 119/8465 | 8.27e-04 | 3.26e-03 | 1.81e-03 | 74 |
| hsa041423 | Liver | HCC | Lysosome | 100/4020 | 132/8465 | 2.32e-11 | 4.31e-10 | 2.40e-10 | 100 |
| hsa049795 | Liver | HCC | Cholesterol metabolism | 41/4020 | 51/8465 | 1.33e-06 | 1.35e-05 | 7.49e-06 | 41 |
| hsa0472211 | Liver | HCC | Neurotrophin signaling pathway | 74/4020 | 119/8465 | 8.27e-04 | 3.26e-03 | 1.81e-03 | 74 |
| hsa0472223 | Prostate | Tumor | Neurotrophin signaling pathway | 39/1791 | 119/8465 | 2.01e-03 | 8.10e-03 | 5.02e-03 | 39 |
| hsa0472233 | Prostate | Tumor | Neurotrophin signaling pathway | 39/1791 | 119/8465 | 2.01e-03 | 8.10e-03 | 5.02e-03 | 39 |
| Page: 1 |
Top |
Cell-cell communication analysis |
| Identification of potential cell-cell interactions between two cell types and their ligand-receptor pairs for different disease states |
| Ligand | Receptor | LRpair | Pathway | Tissue | Disease Stage |
| GRN | SORT1 | GRN_SORT1 | GRN | Breast | DCIS |
| GRN | SORT1 | GRN_SORT1 | GRN | Cervix | ADJ |
| GRN | SORT1 | GRN_SORT1 | GRN | Cervix | CC |
| GRN | SORT1 | GRN_SORT1 | GRN | Cervix | Precancer |
| GRN | SORT1 | GRN_SORT1 | GRN | CRC | AD |
| GRN | SORT1 | GRN_SORT1 | GRN | CRC | ADJ |
| GRN | SORT1 | GRN_SORT1 | GRN | CRC | MSI-H |
| GRN | SORT1 | GRN_SORT1 | GRN | CRC | MSS |
| GRN | SORT1 | GRN_SORT1 | GRN | CRC | SER |
| GRN | SORT1 | GRN_SORT1 | GRN | Endometrium | ADJ |
| GRN | SORT1 | GRN_SORT1 | GRN | Endometrium | AEH |
| GRN | SORT1 | GRN_SORT1 | GRN | Endometrium | Healthy |
| GRN | SORT1 | GRN_SORT1 | GRN | Esophagus | ESCC |
| GRN | SORT1 | GRN_SORT1 | GRN | GC | ADJ |
| GRN | SORT1 | GRN_SORT1 | GRN | HNSCC | ADJ |
| GRN | SORT1 | GRN_SORT1 | GRN | HNSCC | OSCC |
| GRN | SORT1 | GRN_SORT1 | GRN | HNSCC | Precancer |
| GRN | SORT1 | GRN_SORT1 | GRN | Liver | HCC |
| GRN | SORT1 | GRN_SORT1 | GRN | Lung | AAH |
| GRN | SORT1 | GRN_SORT1 | GRN | Lung | ADJ |
| Page: 1 |
Top |
Single-cell gene regulatory network inference analysis |
| Find out the significant the regulons (TFs) and the target genes of each regulon across cell types for different disease states |
| TF | Cell Type | Tissue | Disease Stage | Target Gene | RSS | Regulon Activity |
| ∗The dot plots of a searched regulon are shown for all cell subpopulations in each disease state of each tissue based on the regulon specific score inferred using pySCENIC and by calculating the average expression. |
| Page: 1 |
Top |
Somatic mutation of malignant transformation related genes |
| Annotation of somatic variants for genes involved in malignant transformation |
| Hugo Symbol | Variant Class | Variant Classification | dbSNP RS | HGVSc | HGVSp | HGVSp Short | SWISSPROT | BIOTYPE | SIFT | PolyPhen | Tumor Sample Barcode | Tissue | Histology | Sex | Age | Stage | Therapy Types | Drugs | Outcome |
| SORT1 | SNV | Missense_Mutation | c.845N>A | p.Gly282Glu | p.G282E | Q99523 | protein_coding | deleterious(0) | probably_damaging(0.954) | TCGA-AO-A03R-01 | Breast | breast invasive carcinoma | Female | <65 | I/II | Chemotherapy | doxorubicin | SD | |
| SORT1 | SNV | Missense_Mutation | novel | c.1799N>C | p.Tyr600Ser | p.Y600S | Q99523 | protein_coding | tolerated(0.12) | possibly_damaging(0.857) | TCGA-B6-A0RT-01 | Breast | breast invasive carcinoma | Female | <65 | III/IV | Unknown | Unknown | SD |
| SORT1 | SNV | Missense_Mutation | novel | c.1999C>T | p.Leu667Phe | p.L667F | Q99523 | protein_coding | tolerated(0.39) | benign(0.159) | TCGA-OL-A5RW-01 | Breast | breast invasive carcinoma | Female | <65 | I/II | Chemotherapy | adriamycin | CR |
| SORT1 | insertion | Nonsense_Mutation | novel | c.1279_1280insATGAAATGAGTCAGGGAGCTTCAGTTAGAAAATAAAGTTGAGG | p.Thr427AsnfsTer12 | p.T427Nfs*12 | Q99523 | protein_coding | TCGA-AN-A041-01 | Breast | breast invasive carcinoma | Female | <65 | I/II | Unknown | Unknown | SD | ||
| SORT1 | deletion | Frame_Shift_Del | novel | c.2019delT | p.Leu674SerfsTer21 | p.L674Sfs*21 | Q99523 | protein_coding | TCGA-EW-A2FV-01 | Breast | breast invasive carcinoma | Female | <65 | III/IV | Chemotherapy | docetaxel | SD | ||
| SORT1 | SNV | Missense_Mutation | c.1439C>T | p.Ser480Leu | p.S480L | Q99523 | protein_coding | deleterious(0) | probably_damaging(0.989) | TCGA-EK-A2RK-01 | Cervix | cervical & endocervical cancer | Female | >=65 | I/II | Unknown | Unknown | SD | |
| SORT1 | SNV | Missense_Mutation | novel | c.313T>G | p.Phe105Val | p.F105V | Q99523 | protein_coding | deleterious(0) | probably_damaging(0.969) | TCGA-AA-3949-01 | Colorectum | colon adenocarcinoma | Female | >=65 | III/IV | Unknown | Unknown | SD |
| SORT1 | SNV | Missense_Mutation | c.1406N>T | p.Ser469Phe | p.S469F | Q99523 | protein_coding | tolerated(0.13) | benign(0.144) | TCGA-AA-A01R-01 | Colorectum | colon adenocarcinoma | Male | <65 | III/IV | Chemotherapy | 5-fluorouracil | PD | |
| SORT1 | SNV | Missense_Mutation | novel | c.2230T>A | p.Phe744Ile | p.F744I | Q99523 | protein_coding | tolerated(0.22) | benign(0.015) | TCGA-AA-A02R-01 | Colorectum | colon adenocarcinoma | Female | >=65 | I/II | Unknown | Unknown | PD |
| SORT1 | SNV | Missense_Mutation | c.706N>A | p.Glu236Lys | p.E236K | Q99523 | protein_coding | tolerated(0.69) | benign(0) | TCGA-AA-A02W-01 | Colorectum | colon adenocarcinoma | Female | >=65 | I/II | Unknown | Unknown | PD |
| Page: 1 2 3 4 5 6 7 |
Top |
Related drugs of malignant transformation related genes |
| Identification of chemicals and drugs interact with genes involved in malignant transfromation |
| (DGIdb 4.0) |
| Entrez ID | Symbol | Category | Interaction Types | Drug Claim Name | Drug Name | PMIDs |
| Page: 1 |

Copyright 2023-Present -The University of Texas Health Science Center at Houston |