
|
|||||
|
 | |
| |
| |
| |
| |
| |
|
Gene: SORBS3 |
Gene summary for SORBS3 |
| Gene information | Species | Human | Gene symbol | SORBS3 | Gene ID | 10174 |
| Gene name | sorbin and SH3 domain containing 3 | |
| Gene Alias | SCAM-1 | |
| Cytomap | 8p21.3 | |
| Gene Type | protein-coding | GO ID | GO:0000122 | UniProtAcc | O60504 |
Top |
Malignant transformation analysis |
| Identification of the aberrant gene expression in precancerous and cancerous lesions by comparing the gene expression of stem-like cells in diseased tissues with normal stem cells |
| Entrez ID | Symbol | Replicates | Species | Organ | Tissue | Adj P-value | Log2FC | Malignancy |
| 10174 | SORBS3 | HTA11_347_2000001011 | Human | Colorectum | AD | 8.23e-05 | 2.45e-01 | -0.1954 |
| 10174 | SORBS3 | HTA11_3361_2000001011 | Human | Colorectum | AD | 2.30e-03 | 2.45e-01 | -0.1207 |
| 10174 | SORBS3 | HTA11_866_2000001011 | Human | Colorectum | AD | 2.37e-07 | 3.13e-01 | -0.1001 |
| 10174 | SORBS3 | HTA11_2992_2000001011 | Human | Colorectum | SER | 6.06e-05 | 4.11e-01 | -0.1706 |
| 10174 | SORBS3 | HTA11_7696_3000711011 | Human | Colorectum | AD | 2.45e-06 | 3.22e-01 | 0.0674 |
| 10174 | SORBS3 | HTA11_6818_2000001011 | Human | Colorectum | AD | 7.84e-03 | 3.94e-01 | 0.0112 |
| 10174 | SORBS3 | HTA11_6818_2000001021 | Human | Colorectum | AD | 9.09e-08 | 4.14e-01 | 0.0588 |
| 10174 | SORBS3 | HTA11_99999973899_84307 | Human | Colorectum | MSS | 2.46e-03 | 2.66e-01 | 0.2585 |
| 10174 | SORBS3 | LZE4T | Human | Esophagus | ESCC | 1.51e-12 | 2.64e-01 | 0.0811 |
| 10174 | SORBS3 | LZE8T | Human | Esophagus | ESCC | 6.54e-04 | 3.11e-02 | 0.067 |
| 10174 | SORBS3 | LZE24T | Human | Esophagus | ESCC | 3.67e-23 | 7.82e-01 | 0.0596 |
| 10174 | SORBS3 | LZE21T | Human | Esophagus | ESCC | 8.10e-04 | 2.62e-01 | 0.0655 |
| 10174 | SORBS3 | P1T-E | Human | Esophagus | ESCC | 6.70e-05 | 5.31e-01 | 0.0875 |
| 10174 | SORBS3 | P2T-E | Human | Esophagus | ESCC | 1.17e-84 | 1.31e+00 | 0.1177 |
| 10174 | SORBS3 | P4T-E | Human | Esophagus | ESCC | 5.34e-45 | 1.12e+00 | 0.1323 |
| 10174 | SORBS3 | P5T-E | Human | Esophagus | ESCC | 8.21e-16 | 4.10e-01 | 0.1327 |
| 10174 | SORBS3 | P8T-E | Human | Esophagus | ESCC | 7.17e-56 | 9.84e-01 | 0.0889 |
| 10174 | SORBS3 | P9T-E | Human | Esophagus | ESCC | 5.62e-18 | 5.91e-01 | 0.1131 |
| 10174 | SORBS3 | P10T-E | Human | Esophagus | ESCC | 2.62e-70 | 1.20e+00 | 0.116 |
| 10174 | SORBS3 | P11T-E | Human | Esophagus | ESCC | 2.01e-17 | 7.12e-01 | 0.1426 |
| Page: 1 2 3 4 5 6 |
| Tissue | Expression Dynamics | Abbreviation |
| Colorectum (GSE201348) |  | FAP: Familial adenomatous polyposis |
| CRC: Colorectal cancer | ||
| Colorectum (HTA11) |  | AD: Adenomas |
| SER: Sessile serrated lesions | ||
| MSI-H: Microsatellite-high colorectal cancer | ||
| MSS: Microsatellite stable colorectal cancer | ||
| Esophagus | 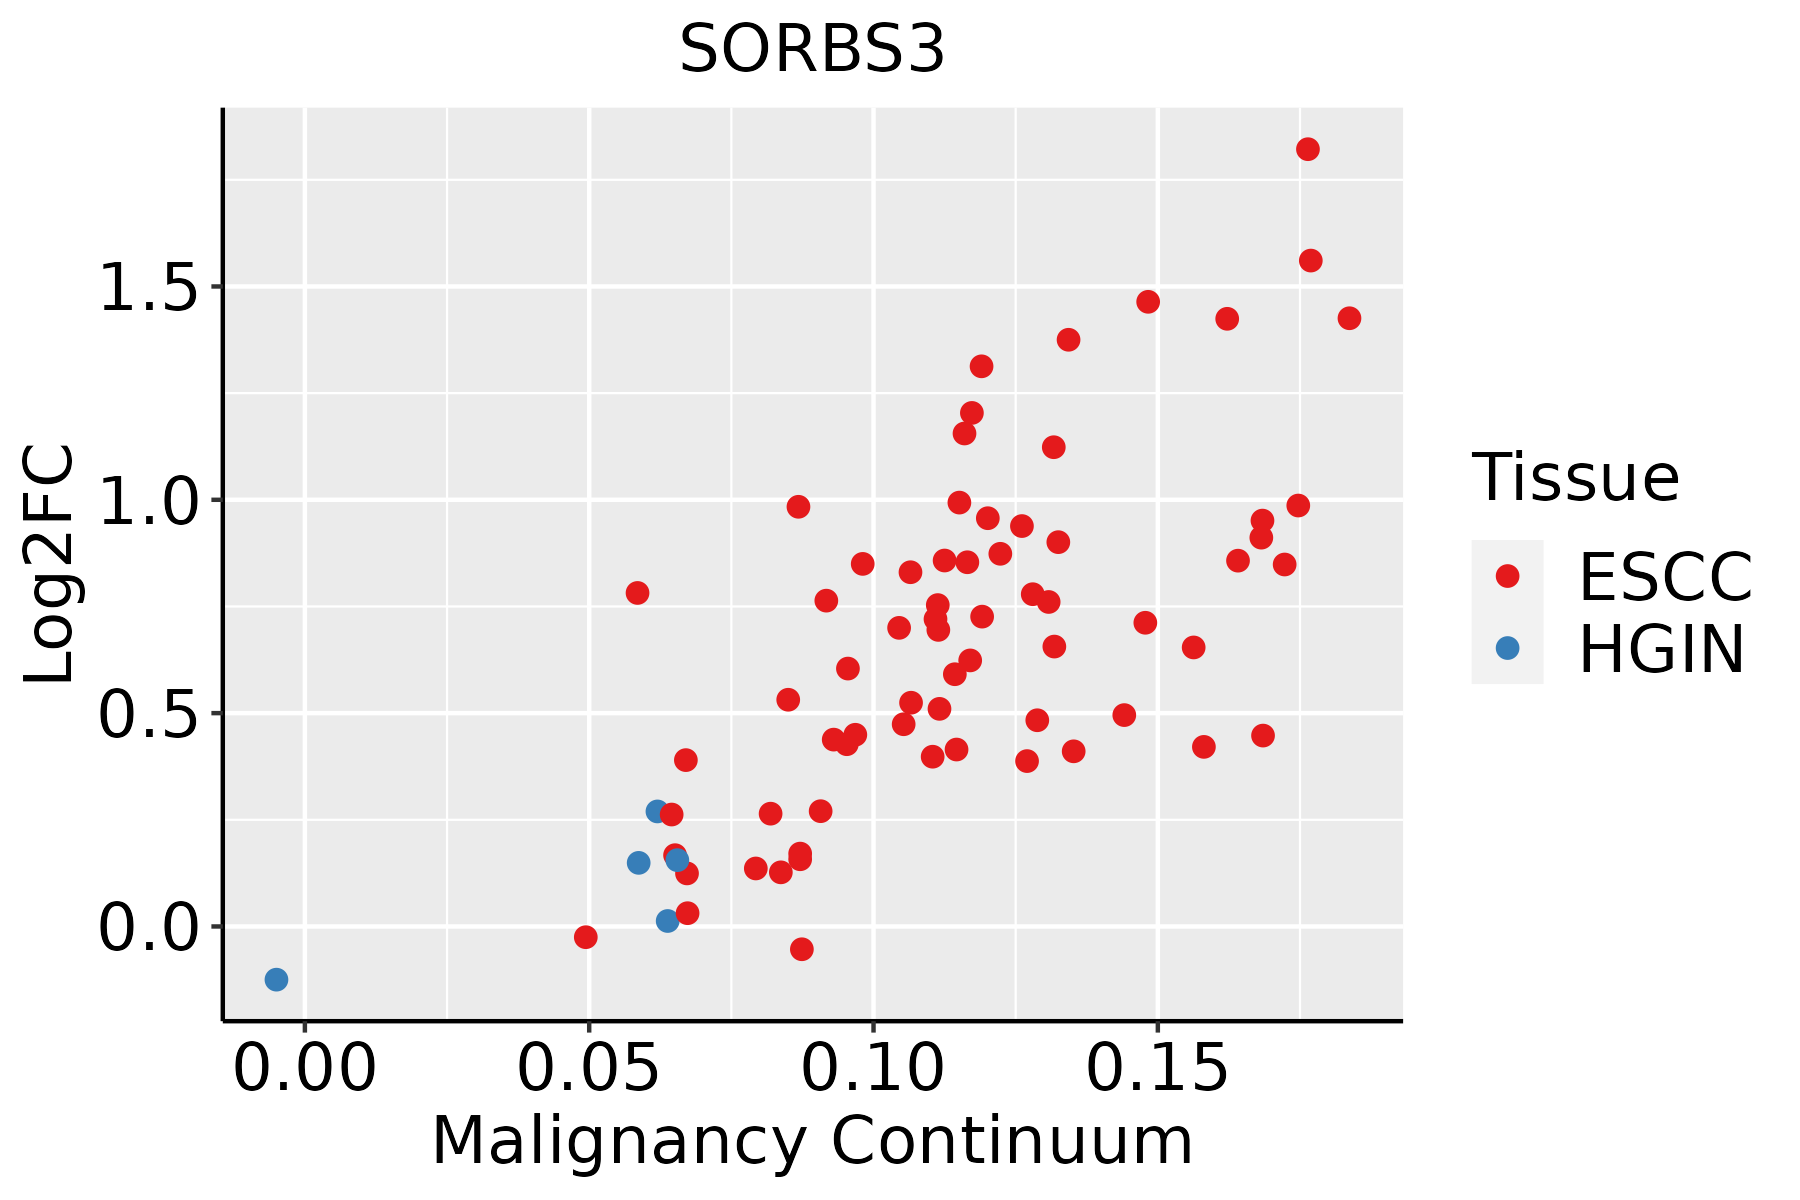 | ESCC: Esophageal squamous cell carcinoma |
| HGIN: High-grade intraepithelial neoplasias | ||
| LGIN: Low-grade intraepithelial neoplasias | ||
| Liver | 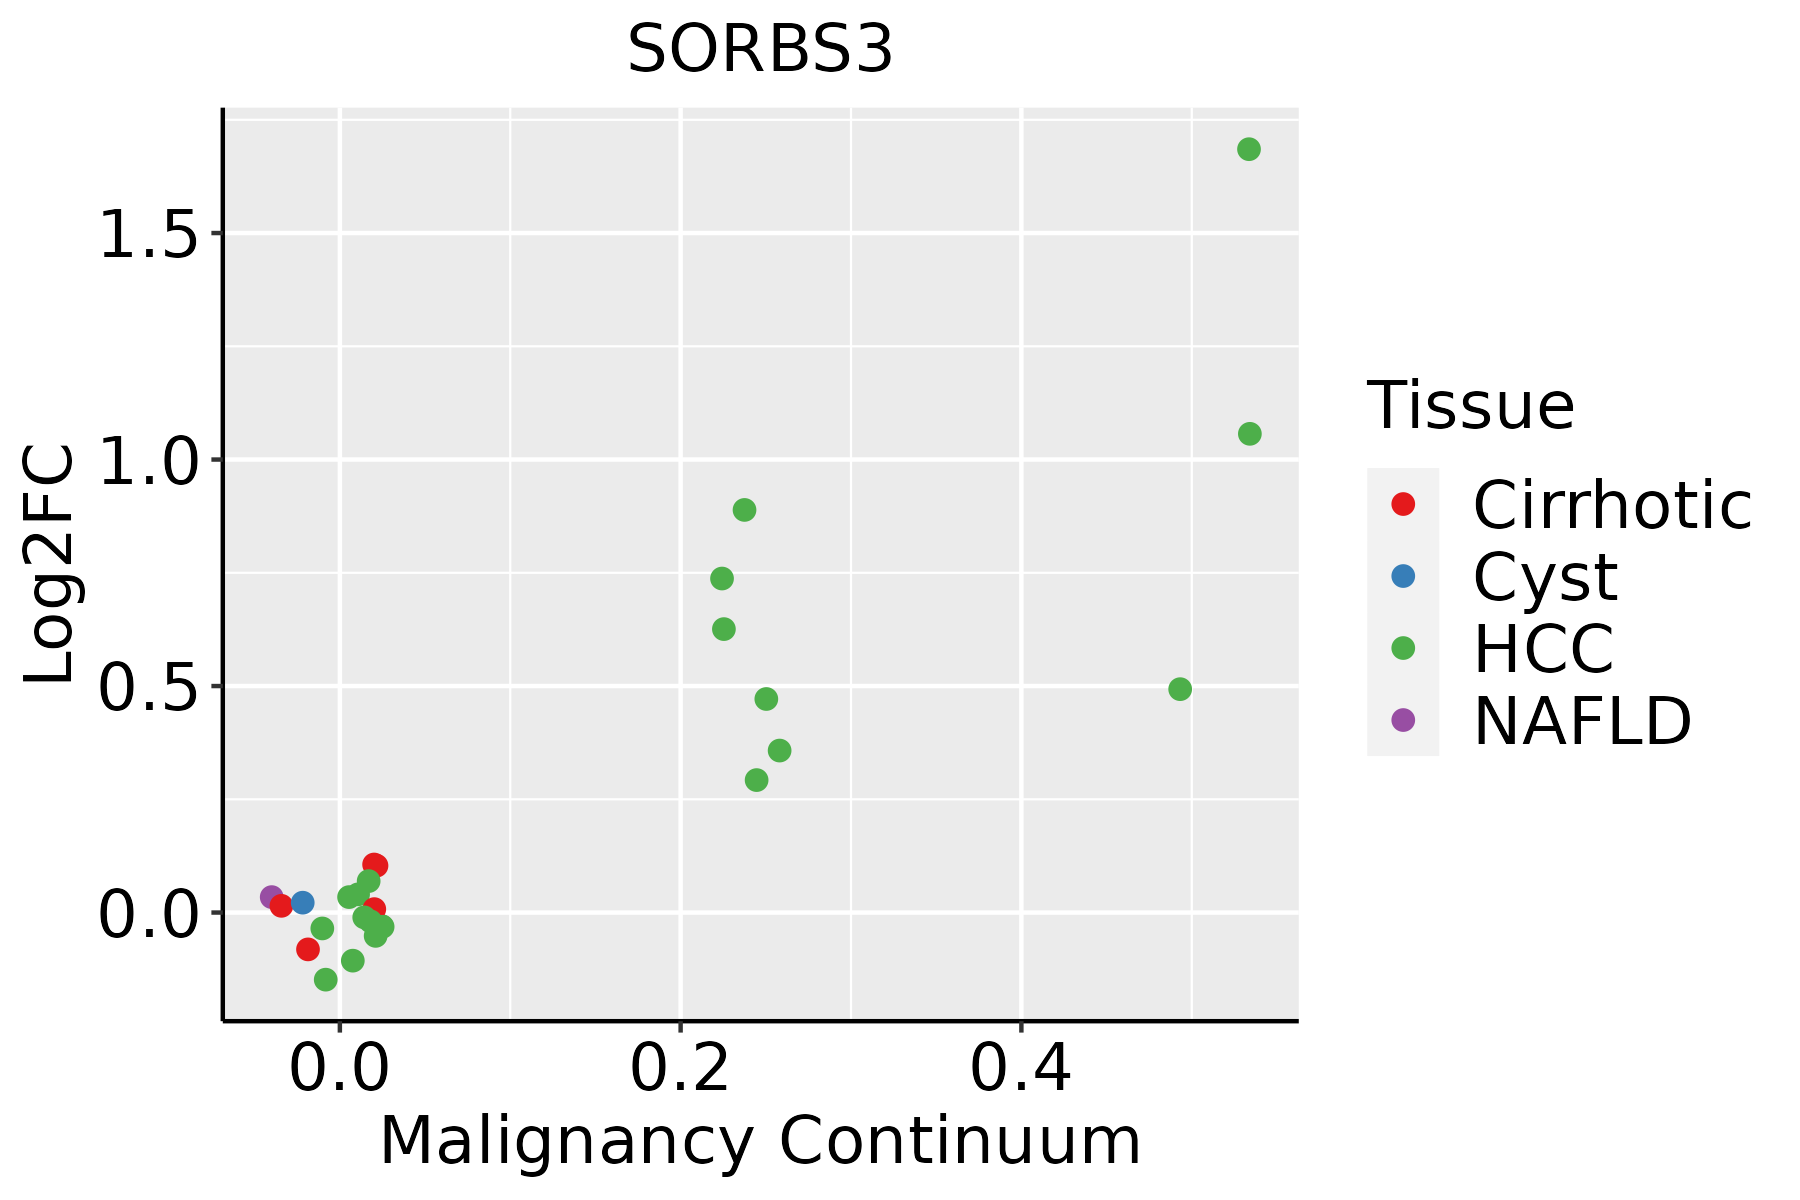 | HCC: Hepatocellular carcinoma |
| NAFLD: Non-alcoholic fatty liver disease | ||
| Oral Cavity | 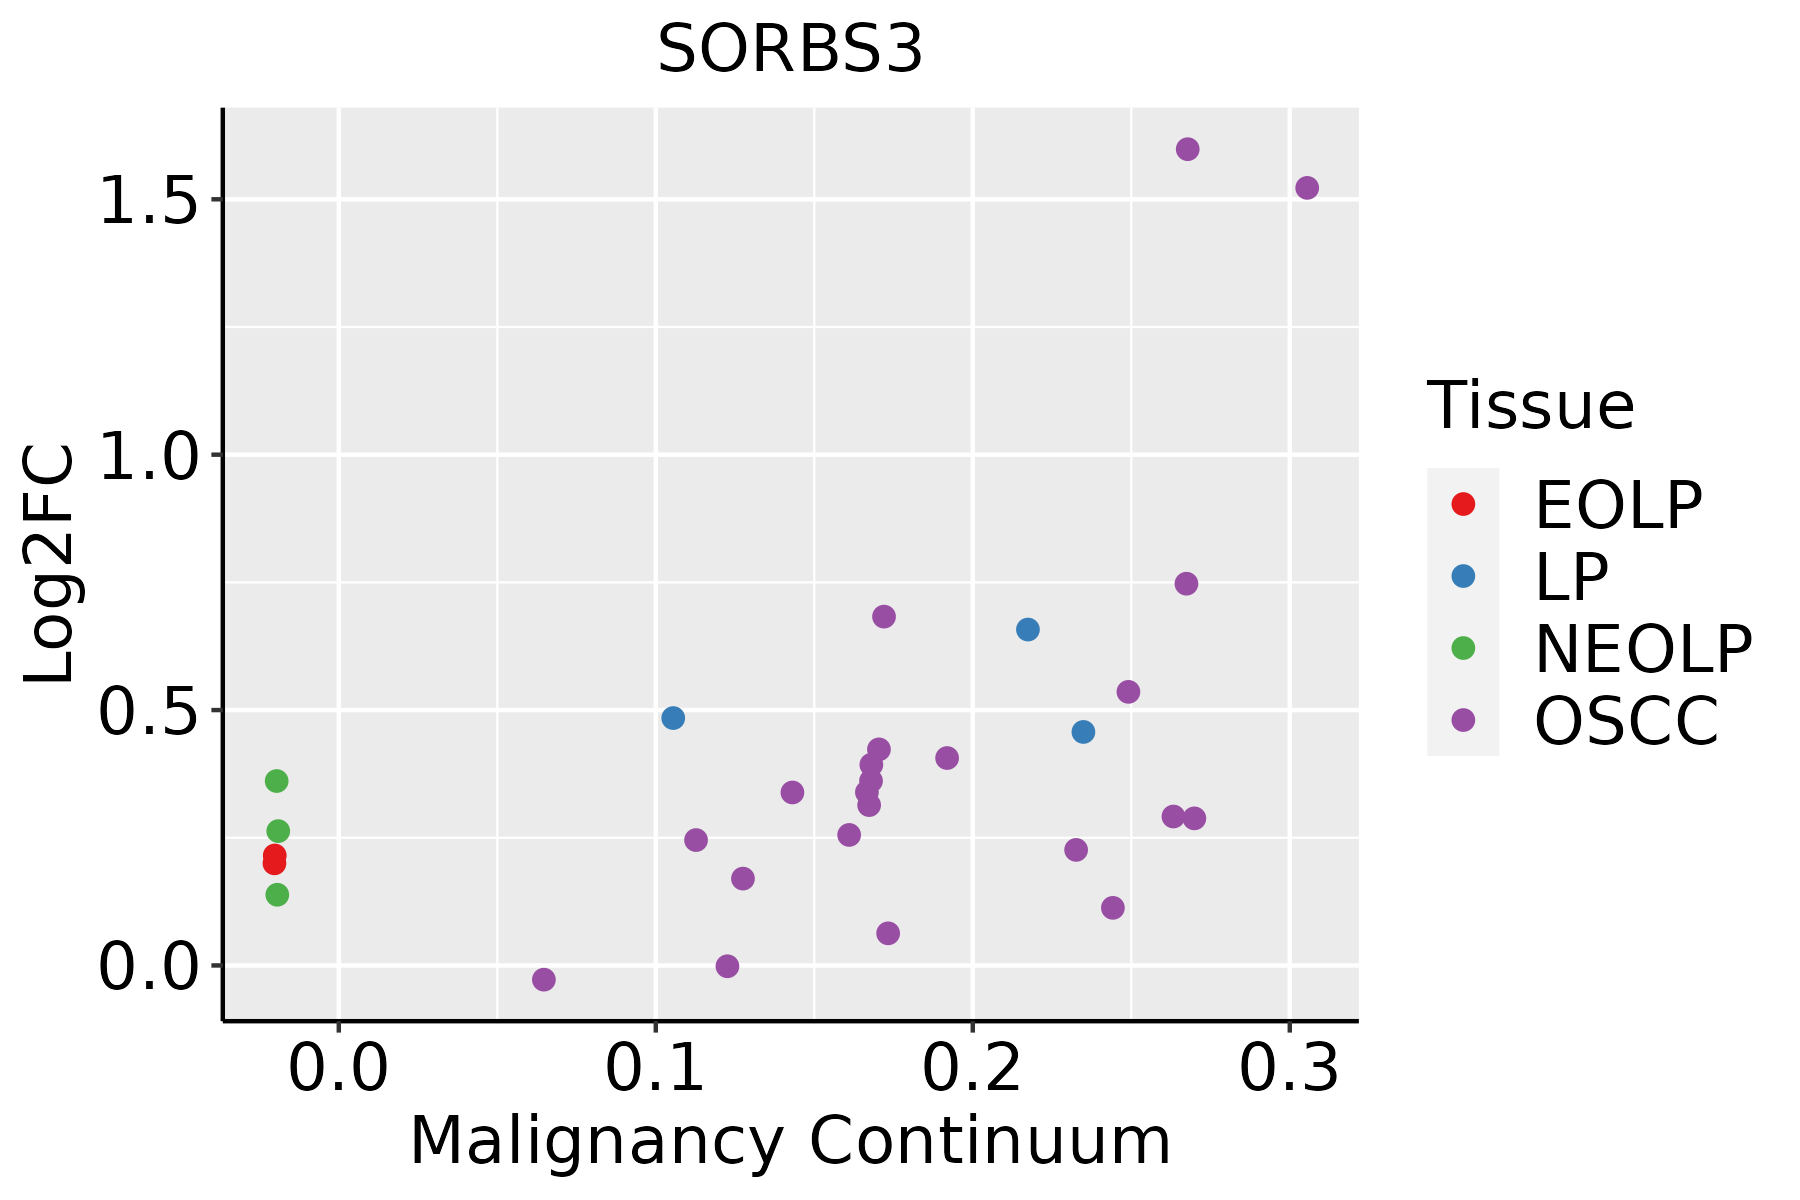 | EOLP: Erosive Oral lichen planus |
| LP: leukoplakia | ||
| NEOLP: Non-erosive oral lichen planus | ||
| OSCC: Oral squamous cell carcinoma | ||
| Skin |  | AK: Actinic keratosis |
| cSCC: Cutaneous squamous cell carcinoma | ||
| SCCIS:squamous cell carcinoma in situ | ||
| Thyroid |  | ATC: Anaplastic thyroid cancer |
| HT: Hashimoto's thyroiditis | ||
| PTC: Papillary thyroid cancer |
| ∗log2FC in expression of this searched gene in stem-like cells from each diseased tissue sample relative to stem-like cells in normal samples in each tissue plotted against the malignancy continuum. Samples are colored based on if they are from different disease stage. |
Top |
Malignant transformation related pathway analysis |
| Find out the enriched GO biological processes and KEGG pathways involved in transition from healthy to precancer to cancer |
| Tissue | Disease Stage | Enriched GO biological Processes |
| Colorectum | AD |  |
| Colorectum | SER |  |
| Colorectum | MSS |  |
| Colorectum | MSI-H |  |
| Colorectum | FAP |  |
| ∗Top 15 enriched GO BP terms are showed in the bar plot of each disease state in each tissue. Each row represents a significant GO biological process which is colored according to the -log10(p.adjust). |
| Page: 1 2 3 4 5 6 7 8 9 |
| GO ID | Tissue | Disease Stage | Description | Gene Ratio | Bg Ratio | pvalue | p.adjust | Count |
| GO:0007015 | Colorectum | AD | actin filament organization | 167/3918 | 442/18723 | 1.65e-16 | 7.94e-14 | 167 |
| GO:1902903 | Colorectum | AD | regulation of supramolecular fiber organization | 139/3918 | 383/18723 | 2.01e-12 | 3.19e-10 | 139 |
| GO:0032970 | Colorectum | AD | regulation of actin filament-based process | 142/3918 | 397/18723 | 4.05e-12 | 5.90e-10 | 142 |
| GO:0110053 | Colorectum | AD | regulation of actin filament organization | 108/3918 | 278/18723 | 5.02e-12 | 6.98e-10 | 108 |
| GO:1902905 | Colorectum | AD | positive regulation of supramolecular fiber organization | 85/3918 | 209/18723 | 5.95e-11 | 6.33e-09 | 85 |
| GO:0032956 | Colorectum | AD | regulation of actin cytoskeleton organization | 127/3918 | 358/18723 | 1.03e-10 | 1.04e-08 | 127 |
| GO:0051495 | Colorectum | AD | positive regulation of cytoskeleton organization | 89/3918 | 226/18723 | 1.61e-10 | 1.56e-08 | 89 |
| GO:0031589 | Colorectum | AD | cell-substrate adhesion | 116/3918 | 363/18723 | 4.68e-07 | 1.76e-05 | 116 |
| GO:0061572 | Colorectum | AD | actin filament bundle organization | 60/3918 | 161/18723 | 1.33e-06 | 4.23e-05 | 60 |
| GO:0051017 | Colorectum | AD | actin filament bundle assembly | 58/3918 | 157/18723 | 2.74e-06 | 7.89e-05 | 58 |
| GO:0031032 | Colorectum | AD | actomyosin structure organization | 65/3918 | 196/18723 | 4.17e-05 | 7.37e-04 | 65 |
| GO:0030038 | Colorectum | AD | contractile actin filament bundle assembly | 39/3918 | 106/18723 | 1.22e-04 | 1.78e-03 | 39 |
| GO:0043149 | Colorectum | AD | stress fiber assembly | 39/3918 | 106/18723 | 1.22e-04 | 1.78e-03 | 39 |
| GO:0032231 | Colorectum | AD | regulation of actin filament bundle assembly | 37/3918 | 105/18723 | 4.82e-04 | 5.27e-03 | 37 |
| GO:0110020 | Colorectum | AD | regulation of actomyosin structure organization | 35/3918 | 100/18723 | 7.78e-04 | 7.78e-03 | 35 |
| GO:0051492 | Colorectum | AD | regulation of stress fiber assembly | 32/3918 | 91/18723 | 1.17e-03 | 1.05e-02 | 32 |
| GO:0032233 | Colorectum | AD | positive regulation of actin filament bundle assembly | 23/3918 | 63/18723 | 3.18e-03 | 2.35e-02 | 23 |
| GO:00070151 | Colorectum | SER | actin filament organization | 134/2897 | 442/18723 | 1.39e-15 | 5.70e-13 | 134 |
| GO:01100531 | Colorectum | SER | regulation of actin filament organization | 91/2897 | 278/18723 | 4.33e-13 | 1.40e-10 | 91 |
| GO:19029031 | Colorectum | SER | regulation of supramolecular fiber organization | 114/2897 | 383/18723 | 7.32e-13 | 1.95e-10 | 114 |
| Page: 1 2 3 4 5 6 7 8 9 10 11 |
| Pathway ID | Tissue | Disease Stage | Description | Gene Ratio | Bg Ratio | pvalue | p.adjust | qvalue | Count |
| Page: 1 |
Top |
Cell-cell communication analysis |
| Identification of potential cell-cell interactions between two cell types and their ligand-receptor pairs for different disease states |
| Ligand | Receptor | LRpair | Pathway | Tissue | Disease Stage |
| Page: 1 |
Top |
Single-cell gene regulatory network inference analysis |
| Find out the significant the regulons (TFs) and the target genes of each regulon across cell types for different disease states |
| TF | Cell Type | Tissue | Disease Stage | Target Gene | RSS | Regulon Activity |
| ∗The dot plots of a searched regulon are shown for all cell subpopulations in each disease state of each tissue based on the regulon specific score inferred using pySCENIC and by calculating the average expression. |
| Page: 1 |
Top |
Somatic mutation of malignant transformation related genes |
| Annotation of somatic variants for genes involved in malignant transformation |
| Hugo Symbol | Variant Class | Variant Classification | dbSNP RS | HGVSc | HGVSp | HGVSp Short | SWISSPROT | BIOTYPE | SIFT | PolyPhen | Tumor Sample Barcode | Tissue | Histology | Sex | Age | Stage | Therapy Types | Drugs | Outcome |
| SORBS3 | SNV | Missense_Mutation | c.1640C>T | p.Ser547Leu | p.S547L | O60504 | protein_coding | tolerated(0.79) | benign(0.003) | TCGA-A8-A09G-01 | Breast | breast invasive carcinoma | Female | >=65 | III/IV | Unknown | Unknown | SD | |
| SORBS3 | SNV | Missense_Mutation | c.572C>A | p.Thr191Lys | p.T191K | O60504 | protein_coding | tolerated(0.35) | benign(0) | TCGA-BH-A0C0-01 | Breast | breast invasive carcinoma | Female | <65 | I/II | Chemotherapy | carboplatin | SD | |
| SORBS3 | SNV | Missense_Mutation | novel | c.689N>A | p.Arg230Gln | p.R230Q | O60504 | protein_coding | tolerated(0.45) | benign(0.001) | TCGA-LD-A74U-01 | Breast | breast invasive carcinoma | Female | >=65 | III/IV | Chemotherapy | taxotere | SD |
| SORBS3 | deletion | Frame_Shift_Del | novel | c.1333delN | p.Ile446SerfsTer38 | p.I446Sfs*38 | O60504 | protein_coding | TCGA-D8-A27V-01 | Breast | breast invasive carcinoma | Female | <65 | I/II | Hormone Therapy | tamoxiphen | SD | ||
| SORBS3 | SNV | Missense_Mutation | c.554N>G | p.His185Arg | p.H185R | O60504 | protein_coding | tolerated(0.54) | benign(0) | TCGA-EK-A2PM-01 | Cervix | cervical & endocervical cancer | Female | >=65 | I/II | Unknown | Unknown | SD | |
| SORBS3 | SNV | Missense_Mutation | novel | c.103G>T | p.Val35Leu | p.V35L | O60504 | protein_coding | deleterious(0.01) | benign(0.034) | TCGA-VS-A9U6-01 | Cervix | cervical & endocervical cancer | Female | <65 | I/II | Chemotherapy | cisplatin | PD |
| SORBS3 | SNV | Missense_Mutation | novel | c.1903N>C | p.Glu635Gln | p.E635Q | O60504 | protein_coding | deleterious(0.04) | benign(0.342) | TCGA-AA-3947-01 | Colorectum | colon adenocarcinoma | Female | <65 | I/II | Unknown | Unknown | SD |
| SORBS3 | SNV | Missense_Mutation | rs375539049 | c.161C>T | p.Ala54Val | p.A54V | O60504 | protein_coding | tolerated(0.06) | probably_damaging(0.991) | TCGA-AA-A00N-01 | Colorectum | colon adenocarcinoma | Male | >=65 | I/II | Unknown | Unknown | PD |
| SORBS3 | SNV | Missense_Mutation | rs775458853 | c.1484G>A | p.Arg495His | p.R495H | O60504 | protein_coding | deleterious(0) | possibly_damaging(0.771) | TCGA-AM-5821-01 | Colorectum | colon adenocarcinoma | Female | >=65 | I/II | Unknown | Unknown | SD |
| SORBS3 | SNV | Missense_Mutation | novel | c.865N>A | p.Asp289Asn | p.D289N | O60504 | protein_coding | tolerated(0.05) | probably_damaging(0.994) | TCGA-AZ-4315-01 | Colorectum | colon adenocarcinoma | Male | <65 | I/II | Unknown | Unknown | SD |
| Page: 1 2 3 4 5 |
Top |
Related drugs of malignant transformation related genes |
| Identification of chemicals and drugs interact with genes involved in malignant transfromation |
| (DGIdb 4.0) |
| Entrez ID | Symbol | Category | Interaction Types | Drug Claim Name | Drug Name | PMIDs |
| Page: 1 |

Copyright 2023-Present -The University of Texas Health Science Center at Houston |