Schematic overview of the cellular and molecular mechanisms involved in the cancer progression, including the proposed cellular and molecular mechanisms in cancer cells trajectory. AT1: alveolar type 1 cells; AT2: alveolar type 2 cells; AAH: atypical adenomatous hyperplasia; AIS: adenocarcinoma in situ; MIA: minimally invasive adenocarcinoma; IA: invasive adenocarcinoma; EMT: epithelial-mesenchymal transition

Home

Download

Statistics

Help

Contact

Center for Computational Systems Medicine
leaf

Gene summary

leaf

Malignant transformation analysis

leaf

Malignant transformation related pathway analysis

leaf

Cell-cell communication analysis

leaf

Single-cell gene regulatory network inference analysis

leaf

Somatic mutation of malignant transformation related genes

leaf

Related drugs of malignant transformation related genes

Gene: SORBS2

Gene summary for SORBS2

check button Gene summary.

Gene informationSpeciesHuman
Gene symbol

SORBS2

Gene ID

8470

Gene namesorbin and SH3 domain containing 2
Gene AliasARGBP2
Cytomap4q35.1
Gene Typeprotein-coding
GO ID

GO:0003008

UniProtAcc

O94875


Top

Malignant transformation analysis

check button Identification of the aberrant gene expression in precancerous and cancerous lesions by comparing the gene expression of stem-like cells in diseased tissues with normal stem cells
check button Malignant transformation involving gene list.
Entrez IDSymbolReplicatesSpeciesOrganTissueAdj P-valueLog2FCMalignancy
8470SORBS2GSM4909281HumanBreastIDC5.03e-032.77e-010.21
8470SORBS2GSM4909286HumanBreastIDC2.02e-02-8.44e-020.1081
8470SORBS2GSM4909297HumanBreastIDC4.61e-09-3.01e-010.1517
8470SORBS2GSM4909299HumanBreastIDC6.34e-094.93e-010.035
8470SORBS2GSM4909300HumanBreastIDC2.03e-024.61e-010.0334
8470SORBS2GSM4909304HumanBreastIDC2.16e-08-3.15e-010.1636
8470SORBS2GSM4909307HumanBreastIDC3.14e-054.15e-010.1569
8470SORBS2GSM4909308HumanBreastIDC1.51e-145.74e-010.158
8470SORBS2GSM4909309HumanBreastIDC1.20e-064.81e-010.0483
8470SORBS2GSM4909311HumanBreastIDC7.36e-11-2.55e-010.1534
8470SORBS2GSM4909315HumanBreastIDC2.44e-15-3.35e-010.21
8470SORBS2GSM4909316HumanBreastIDC2.46e-04-3.40e-010.21
8470SORBS2GSM4909319HumanBreastIDC4.11e-12-3.27e-010.1563
8470SORBS2GSM4909320HumanBreastIDC3.15e-05-3.40e-010.1575
8470SORBS2GSM4909321HumanBreastIDC6.69e-11-2.77e-010.1559
8470SORBS2brca10HumanBreastPrecancer2.02e-08-2.85e-01-0.0029
8470SORBS2NCCBC14HumanBreastDCIS8.16e-07-1.58e-010.2021
8470SORBS2NCCBC5HumanBreastDCIS2.24e-09-3.12e-010.2046
8470SORBS2P1HumanBreastIDC2.89e-07-2.44e-010.1527
8470SORBS2P2HumanBreastIDC2.03e-05-3.10e-010.21
Page: 1 2 3 4 5 6 7 8 9 

check button Transcriptomic changes along malignancy continuum.
TissueExpression DynamicsAbbreviation
BreastThe image shows the transcriptomic changes along malignancy continuum.log2FC in expression of this searched gene in stem-like cells from each diseased tissue sample relative to stem-like cells in normal samples in each tissue plotted against the malignancy continuum. Samples are colored based on if they are from different disease stage.IDC: Invasive ductal carcinoma
DCIS: Ductal carcinoma in situ
Precancer(BRCA1-mut): Precancerous lesion from BRCA1 mutation carriers
Colorectum (GSE201348)The image shows the transcriptomic changes along malignancy continuum.log2FC in expression of this searched gene in stem-like cells from each diseased tissue sample relative to stem-like cells in normal samples in each tissue plotted against the malignancy continuum. Samples are colored based on if they are from different disease stage.
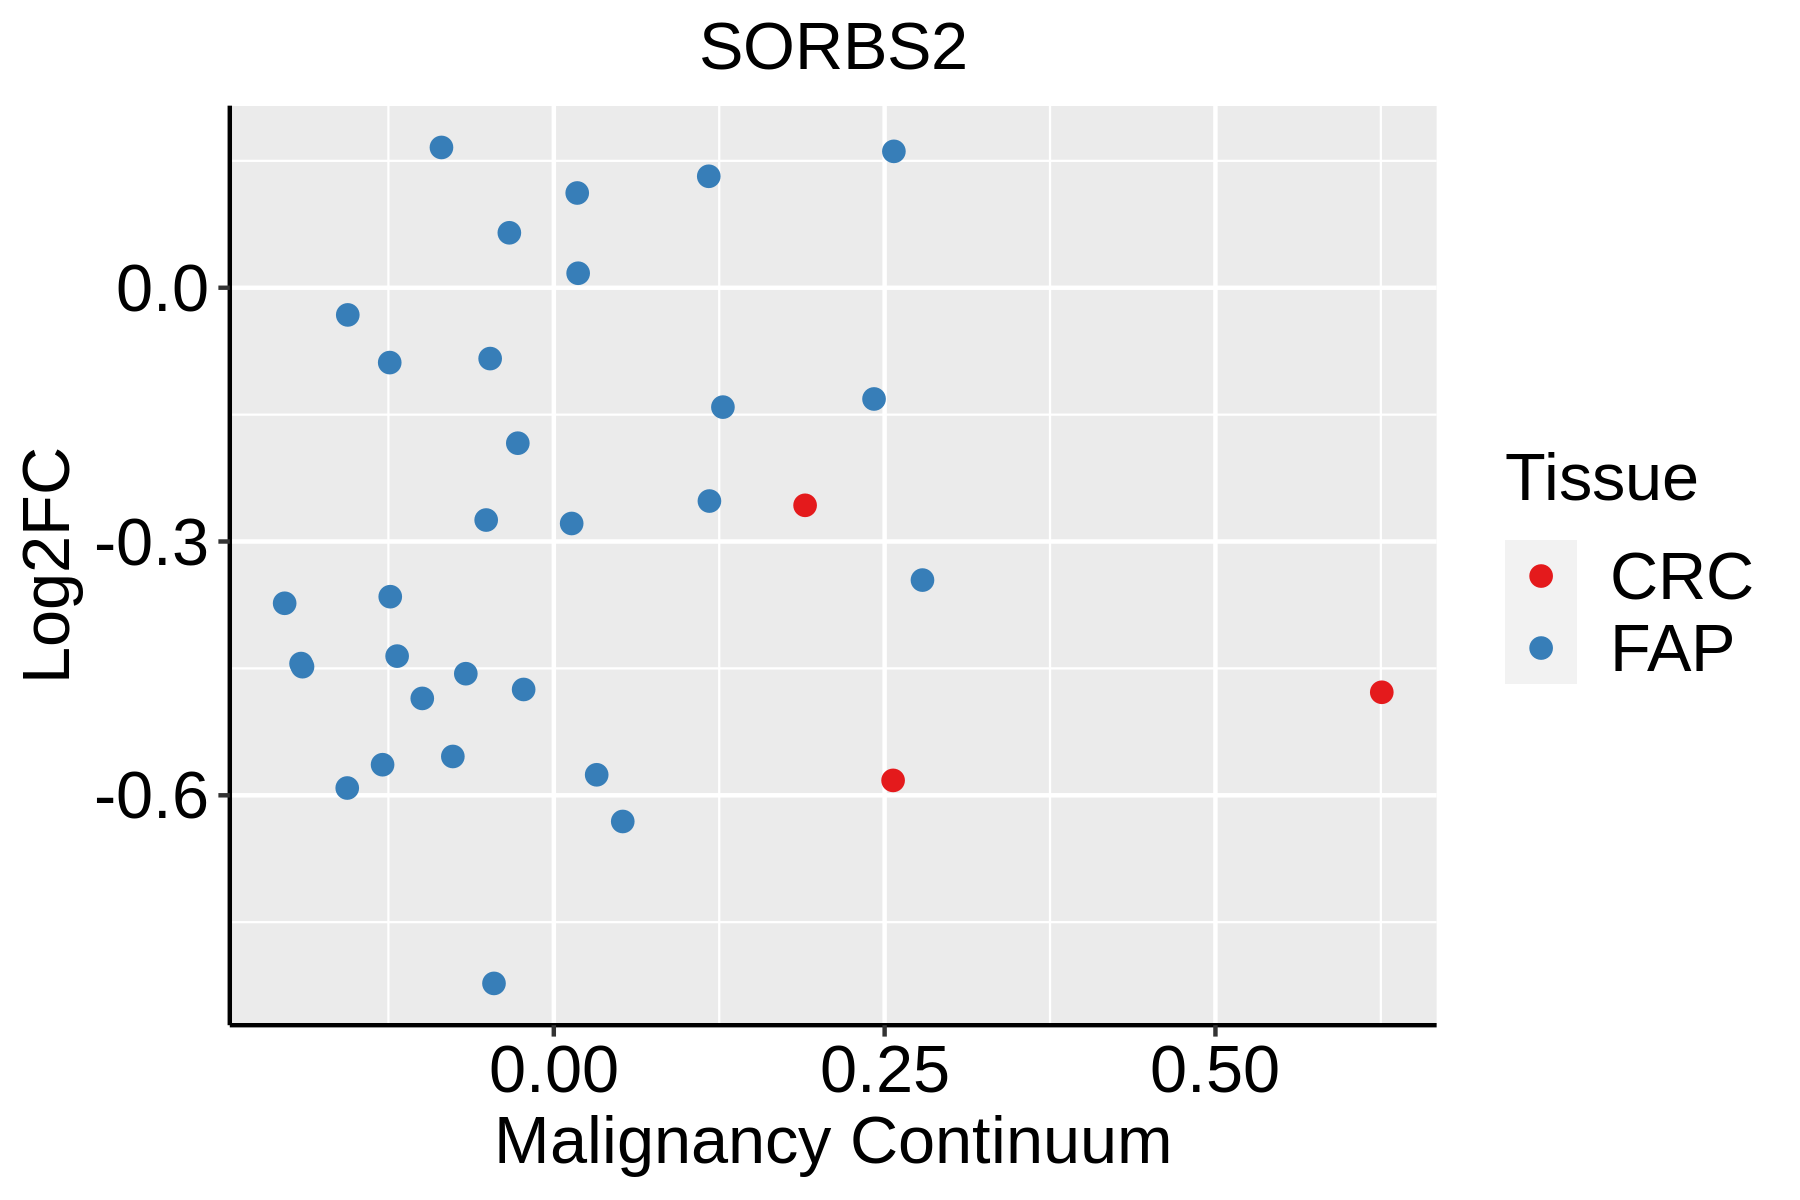
FAP: Familial adenomatous polyposis
CRC: Colorectal cancer
Colorectum (HTA11)The image shows the transcriptomic changes along malignancy continuum.log2FC in expression of this searched gene in stem-like cells from each diseased tissue sample relative to stem-like cells in normal samples in each tissue plotted against the malignancy continuum. Samples are colored based on if they are from different disease stage.AD: Adenomas
SER: Sessile serrated lesions
MSI-H: Microsatellite-high colorectal cancer
MSS: Microsatellite stable colorectal cancer
EndometriumThe image shows the transcriptomic changes along malignancy continuum.log2FC in expression of this searched gene in stem-like cells from each diseased tissue sample relative to stem-like cells in normal samples in each tissue plotted against the malignancy continuum. Samples are colored based on if they are from different disease stage.AEH: Atypical endometrial hyperplasia
EEC: Endometrioid Cancer
EsophagusThe image shows the transcriptomic changes along malignancy continuum.log2FC in expression of this searched gene in stem-like cells from each diseased tissue sample relative to stem-like cells in normal samples in each tissue plotted against the malignancy continuum. Samples are colored based on if they are from different disease stage.
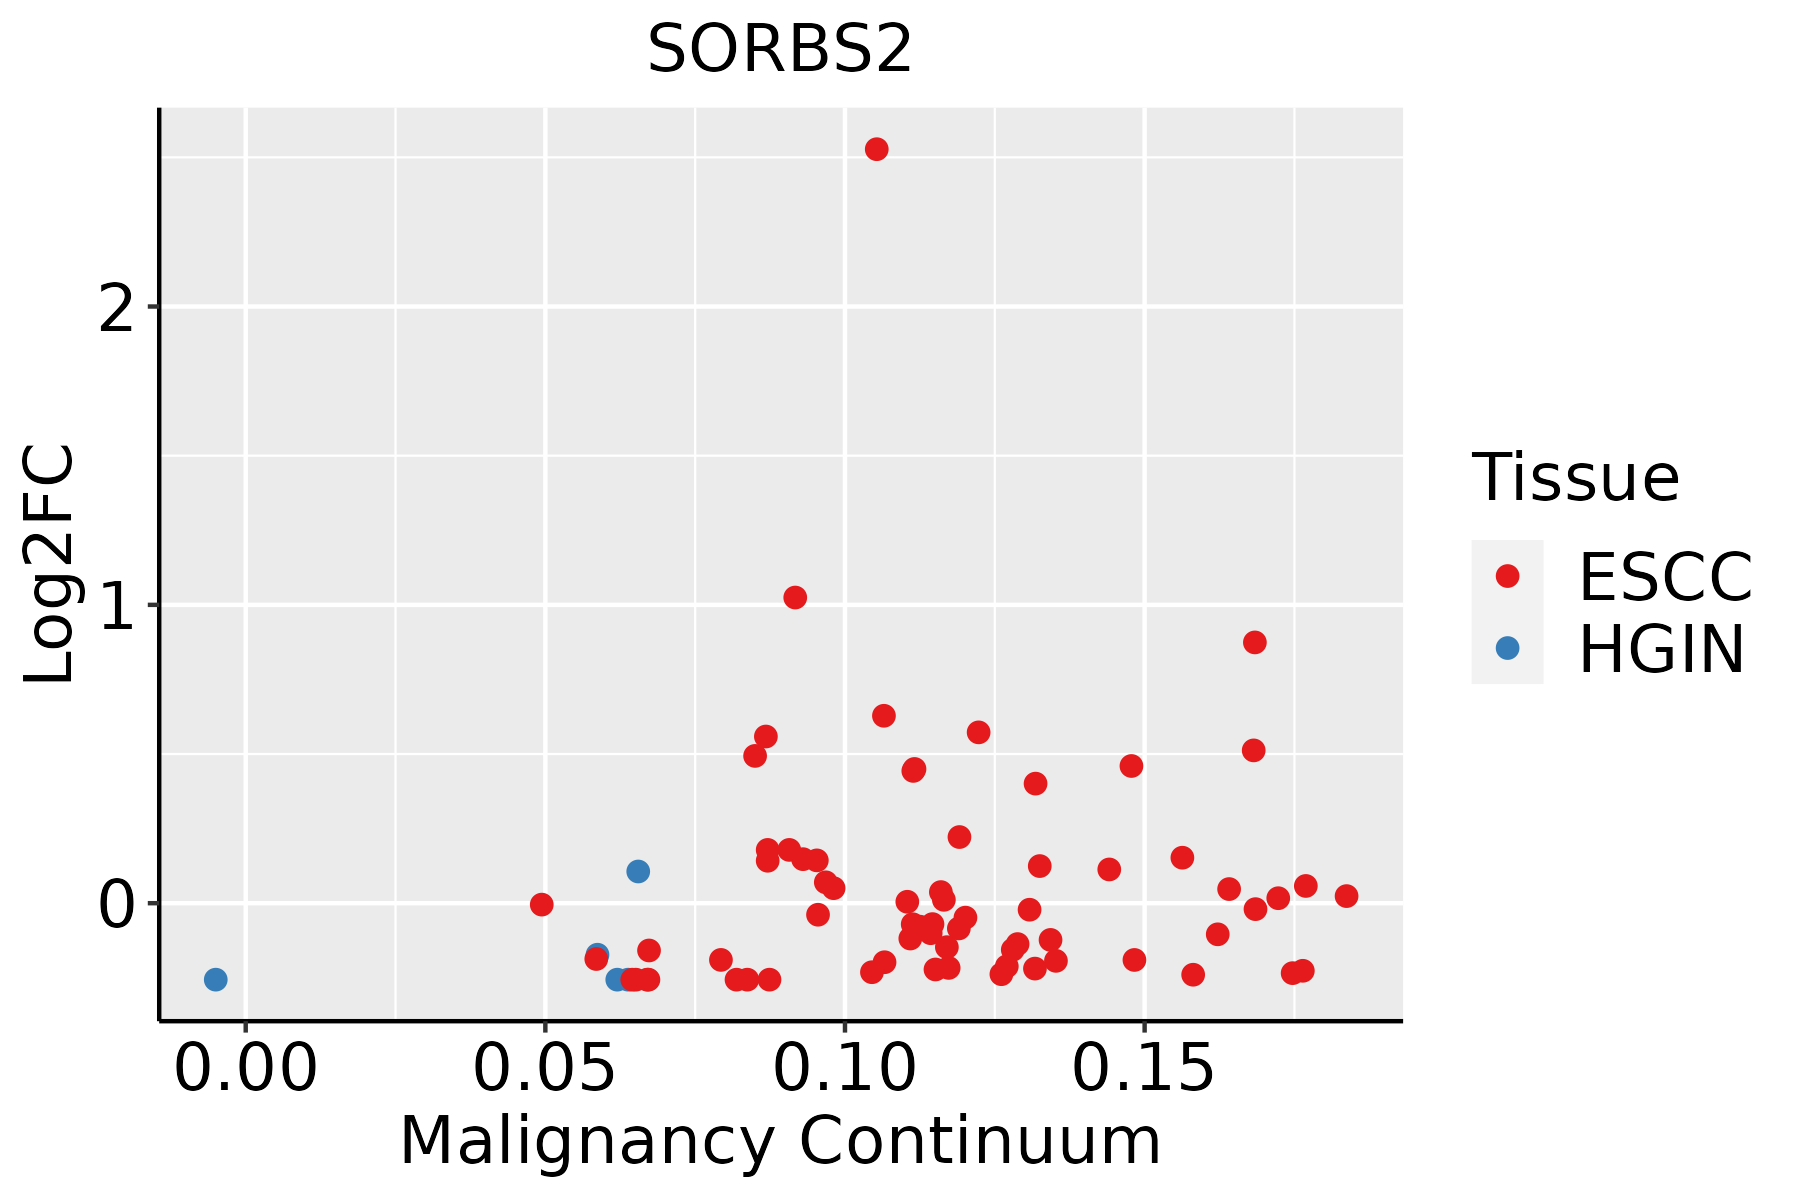
ESCC: Esophageal squamous cell carcinoma
HGIN: High-grade intraepithelial neoplasias
LGIN: Low-grade intraepithelial neoplasias
LiverThe image shows the transcriptomic changes along malignancy continuum.log2FC in expression of this searched gene in stem-like cells from each diseased tissue sample relative to stem-like cells in normal samples in each tissue plotted against the malignancy continuum. Samples are colored based on if they are from different disease stage.HCC: Hepatocellular carcinoma
NAFLD: Non-alcoholic fatty liver disease
LungThe image shows the transcriptomic changes along malignancy continuum.log2FC in expression of this searched gene in stem-like cells from each diseased tissue sample relative to stem-like cells in normal samples in each tissue plotted against the malignancy continuum. Samples are colored based on if they are from different disease stage.
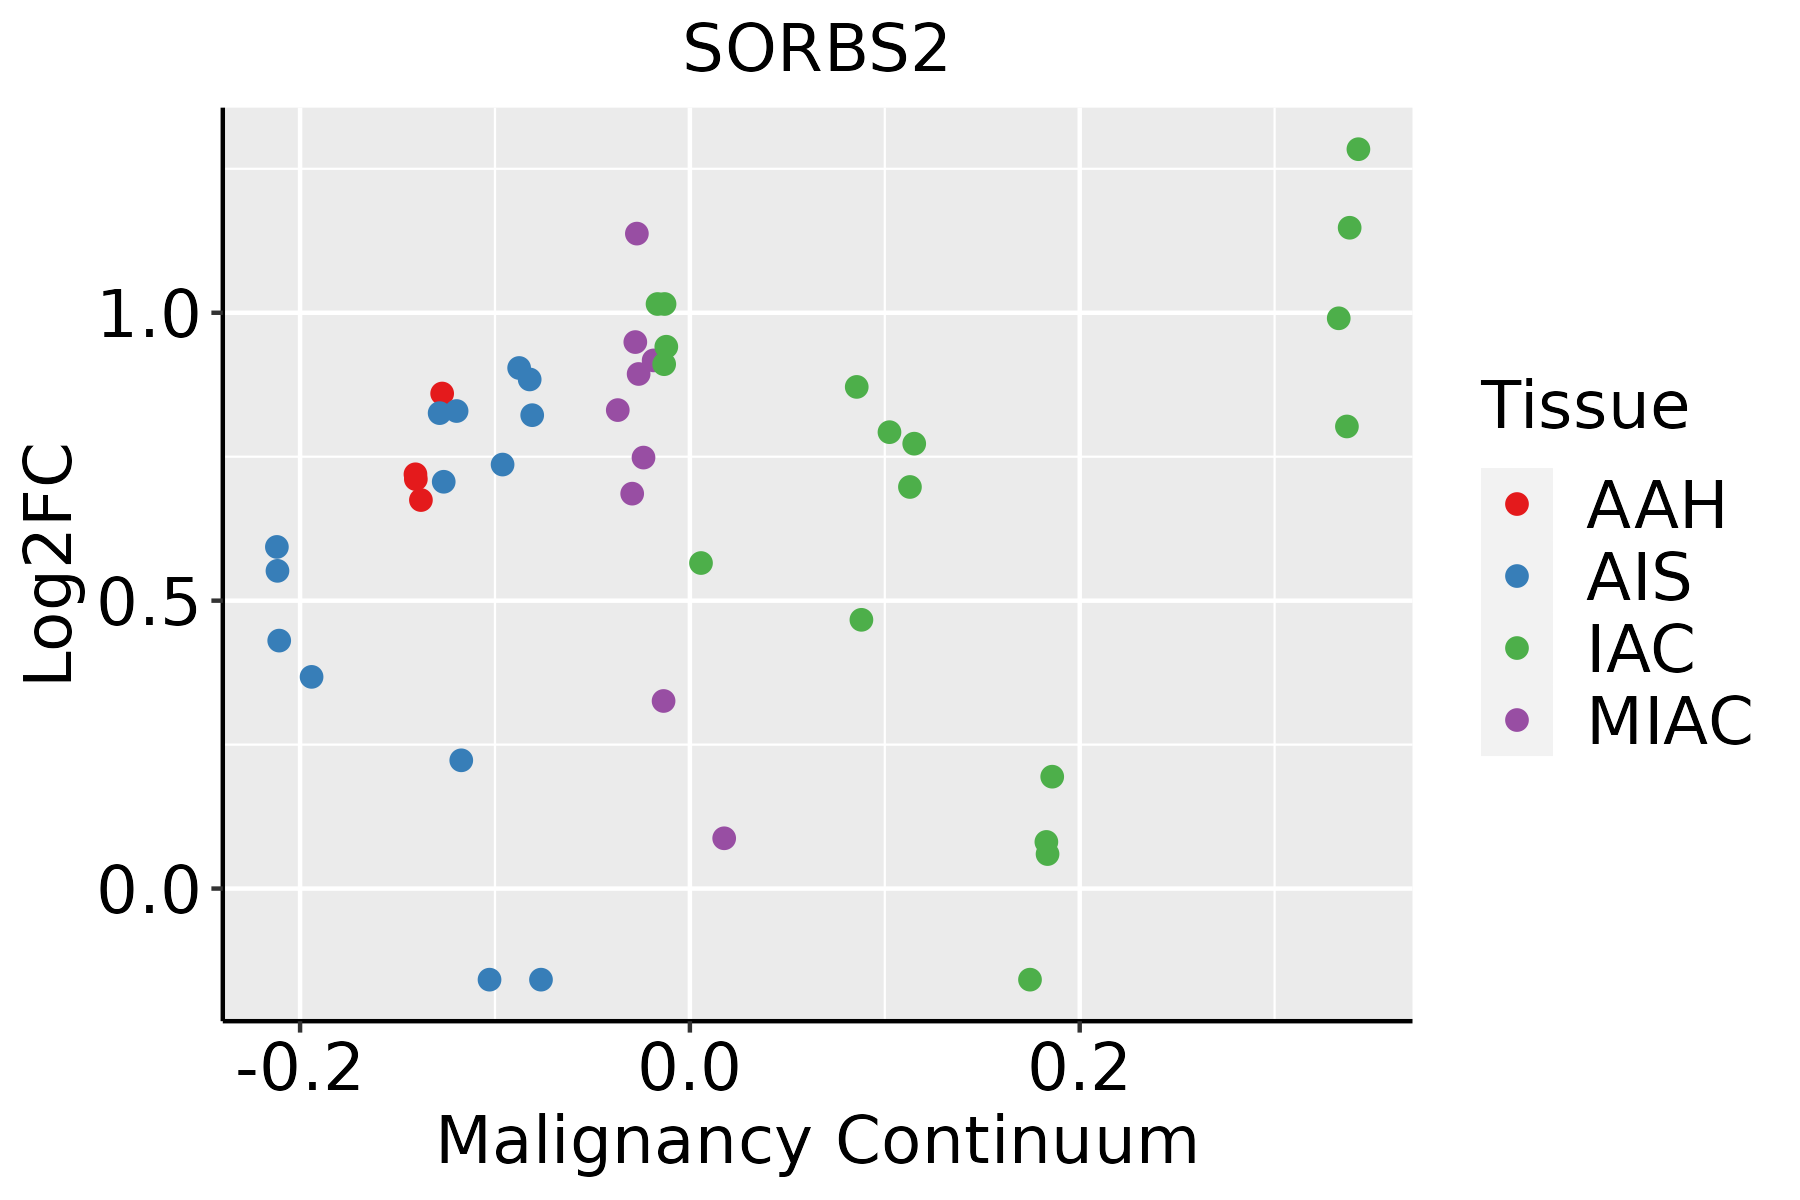
AAH: Atypical adenomatous hyperplasia
AIS: Adenocarcinoma in situ
IAC: Invasive lung adenocarcinoma
MIA: Minimally invasive adenocarcinoma
Oral CavityThe image shows the transcriptomic changes along malignancy continuum.log2FC in expression of this searched gene in stem-like cells from each diseased tissue sample relative to stem-like cells in normal samples in each tissue plotted against the malignancy continuum. Samples are colored based on if they are from different disease stage.EOLP: Erosive Oral lichen planus
LP: leukoplakia
NEOLP: Non-erosive oral lichen planus
OSCC: Oral squamous cell carcinoma
ProstateThe image shows the transcriptomic changes along malignancy continuum.log2FC in expression of this searched gene in stem-like cells from each diseased tissue sample relative to stem-like cells in normal samples in each tissue plotted against the malignancy continuum. Samples are colored based on if they are from different disease stage.
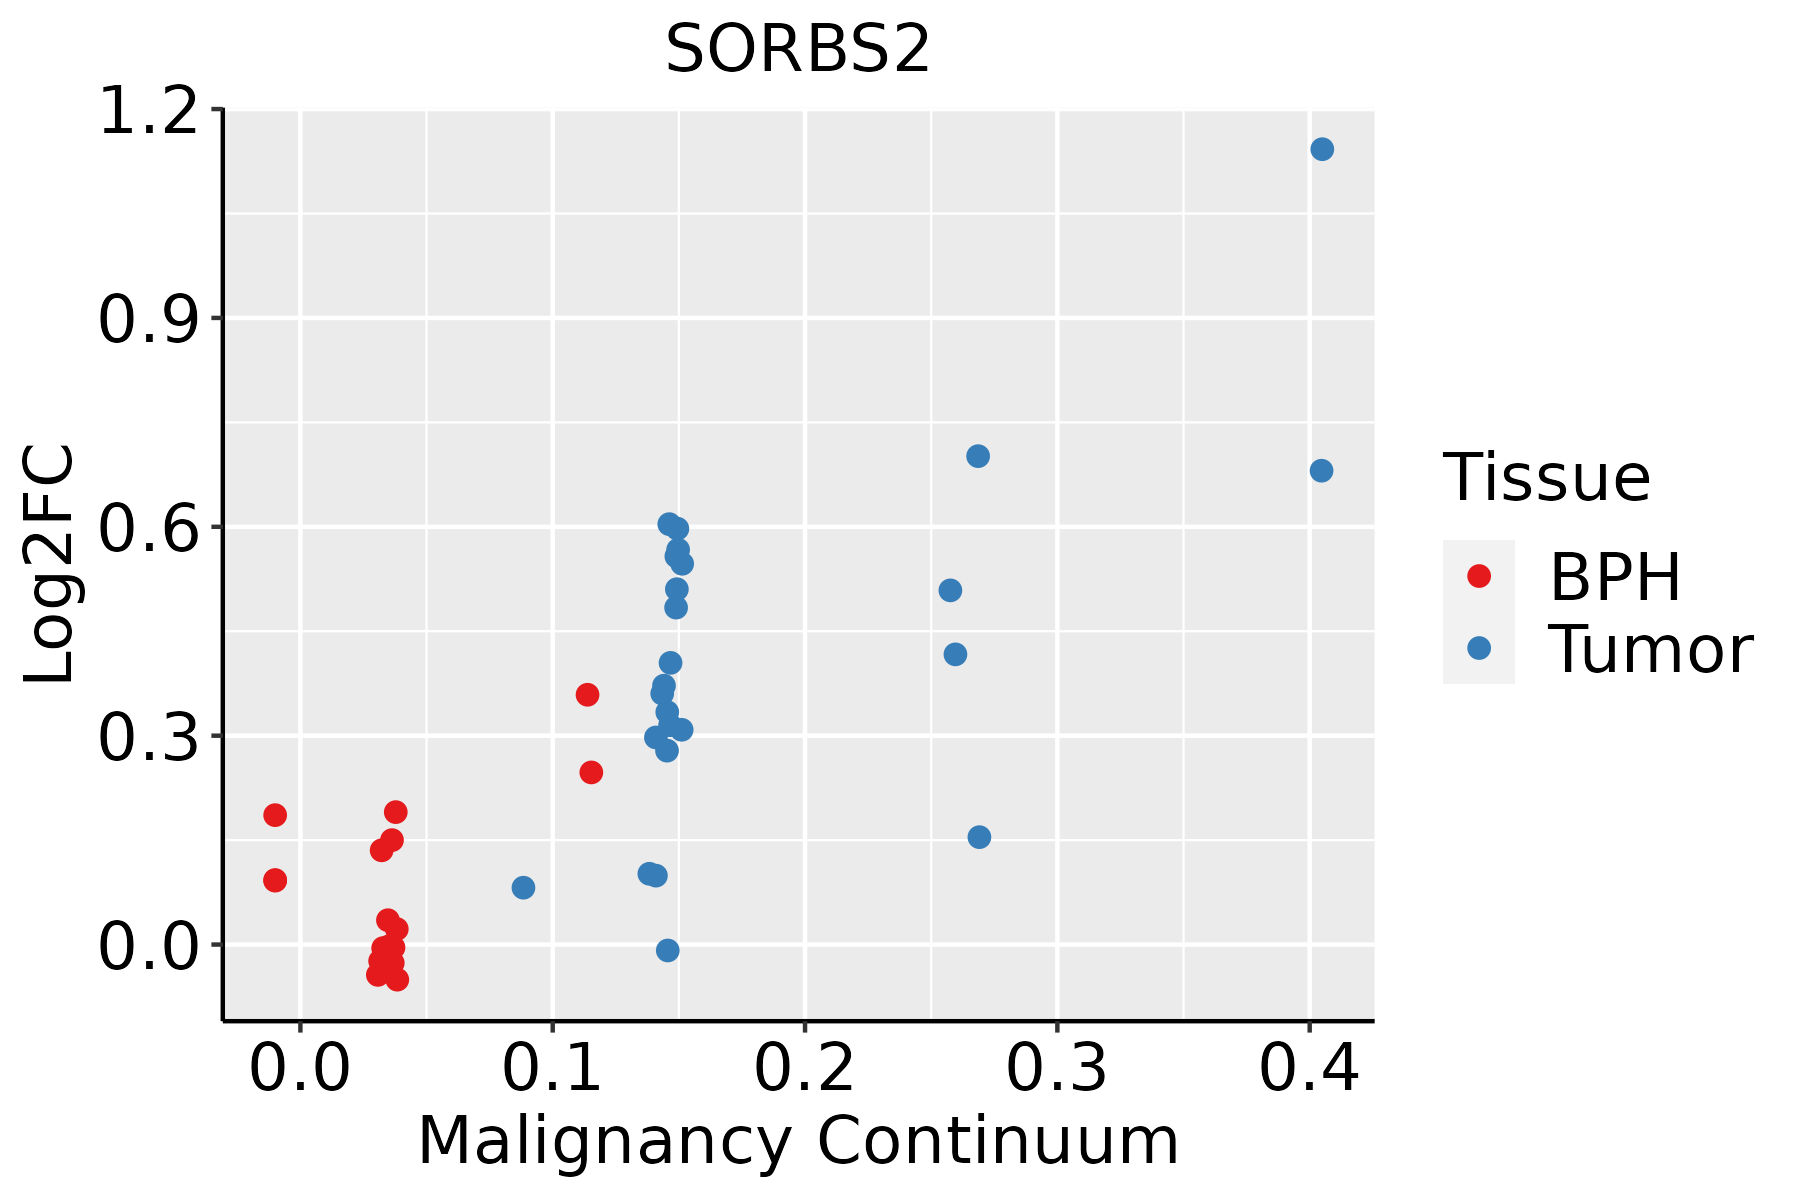
BPH: Benign Prostatic Hyperplasia
ThyroidThe image shows the transcriptomic changes along malignancy continuum.log2FC in expression of this searched gene in stem-like cells from each diseased tissue sample relative to stem-like cells in normal samples in each tissue plotted against the malignancy continuum. Samples are colored based on if they are from different disease stage.ATC: Anaplastic thyroid cancer
HT: Hashimoto's thyroiditis
PTC: Papillary thyroid cancer
∗log2FC in expression of this searched gene in stem-like cells from each diseased tissue sample relative to stem-like cells in normal samples in each tissue plotted against the malignancy continuum. Samples are colored based on if they are from different disease stage.

Top

Malignant transformation related pathway analysis

check buttonFind out the enriched GO biological processes and KEGG pathways involved in transition from healthy to precancer to cancer
check button Figure of enriched GO biological processes.
TissueDisease StageEnriched GO biological Processes
ColorectumADGO analysis - Figure of enriched GO biological processes: Top 15 enriched GO BP terms are showed in the bar plot of each disease state in each tissue. Each row represents a significant GO biological process which is colored according to the -log10(p.adjust).
ColorectumSERGO analysis - Figure of enriched GO biological processes: Top 15 enriched GO BP terms are showed in the bar plot of each disease state in each tissue. Each row represents a significant GO biological process which is colored according to the -log10(p.adjust).
ColorectumMSSGO analysis - Figure of enriched GO biological processes: Top 15 enriched GO BP terms are showed in the bar plot of each disease state in each tissue. Each row represents a significant GO biological process which is colored according to the -log10(p.adjust).
ColorectumMSI-HGO analysis - Figure of enriched GO biological processes: Top 15 enriched GO BP terms are showed in the bar plot of each disease state in each tissue. Each row represents a significant GO biological process which is colored according to the -log10(p.adjust).
ColorectumFAPGO analysis - Figure of enriched GO biological processes: Top 15 enriched GO BP terms are showed in the bar plot of each disease state in each tissue. Each row represents a significant GO biological process which is colored according to the -log10(p.adjust).
∗Top 15 enriched GO BP terms are showed in the bar plot of each disease state in each tissue. Each row represents a significant GO biological process which is colored according to the -log10(p.adjust).
Page: 1 2 3 4 5 6 7 8 9 

check button Enriched GO biological processes.
GO IDTissueDisease StageDescriptionGene RatioBg Ratiopvaluep.adjustCount
GO:00070159BreastPrecanceractin filament organization44/1080442/187233.02e-044.35e-0344
GO:00160497BreastPrecancercell growth46/1080482/187235.63e-047.16e-0346
GO:00605374BreastPrecancermuscle tissue development37/1080403/187233.60e-032.98e-0237
GO:00147063BreastPrecancerstriated muscle tissue development35/1080384/187235.10e-033.83e-0235
GO:000701514BreastIDCactin filament organization55/1434442/187232.45e-043.84e-0355
GO:006053711BreastIDCmuscle tissue development50/1434403/187234.91e-046.45e-0350
GO:001604913BreastIDCcell growth56/1434482/187231.16e-031.26e-0256
GO:00147061BreastIDCstriated muscle tissue development46/1434384/187231.67e-031.63e-0246
GO:00426923BreastIDCmuscle cell differentiation44/1434384/187234.77e-033.66e-0244
GO:00030125BreastIDCmuscle system process50/1434452/187235.52e-034.05e-0250
GO:00511463BreastIDCstriated muscle cell differentiation34/1434283/187236.00e-034.31e-0234
GO:000701524BreastDCISactin filament organization56/1390442/187235.90e-051.19e-0356
GO:006053721BreastDCISmuscle tissue development50/1390403/187232.39e-043.74e-0350
GO:00147062BreastDCISstriated muscle tissue development46/1390384/187238.88e-041.01e-0246
GO:001604923BreastDCIScell growth54/1390482/187231.60e-031.59e-0254
GO:000301212BreastDCISmuscle system process50/1390452/187233.02e-032.57e-0250
GO:004269211BreastDCISmuscle cell differentiation43/1390384/187234.56e-033.49e-0243
GO:005114611BreastDCISstriated muscle cell differentiation33/1390283/187236.63e-034.62e-0233
GO:0007015ColorectumADactin filament organization167/3918442/187231.65e-167.94e-14167
GO:0016049ColorectumADcell growth143/3918482/187232.83e-068.09e-05143
Page: 1 2 3 4 5 6 7 8 9 10 

check button Enriched KEGG pathways.
Pathway IDTissueDisease StageDescriptionGene RatioBg Ratiopvaluep.adjustqvalueCount
Page: 1 

Top

Cell-cell communication analysis

check buttonIdentification of potential cell-cell interactions between two cell types and their ligand-receptor pairs for different disease states
LigandReceptorLRpairPathwayTissueDisease Stage
Page: 1 

Top

Single-cell gene regulatory network inference analysis

check buttonFind out the significant the regulons (TFs) and the target genes of each regulon across cell types for different disease states
TFCell TypeTissueDisease StageTarget GeneRSSRegulon Activity
∗The dot plots of a searched regulon are shown for all cell subpopulations in each disease state of each tissue based on the regulon specific score inferred using pySCENIC and by calculating the average expression.
Page: 1 

Top

Somatic mutation of malignant transformation related genes

check buttonAnnotation of somatic variants for genes involved in malignant transformation
Hugo SymbolVariant ClassVariant ClassificationdbSNP RSHGVScHGVSpHGVSp ShortSWISSPROTBIOTYPESIFTPolyPhenTumor Sample BarcodeTissueHistologySexAgeStageTherapy TypesDrugsOutcome
SORBS2SNVMissense_Mutationc.2713N>Ap.Cys905Serp.C905SO94875protein_codingtolerated(0.33)benign(0.06)TCGA-A2-A0SV-01Breastbreast invasive carcinomaFemale<65III/IVOther, specify in notesBisphosphonate therapyzometaPD
SORBS2SNVMissense_Mutationnovelc.1742A>Gp.Glu581Glyp.E581GO94875protein_codingdeleterious(0)probably_damaging(0.999)TCGA-A2-A1FZ-01Breastbreast invasive carcinomaFemale<65I/IIUnspecificArimidexSD
SORBS2SNVMissense_Mutationc.1954N>Cp.Glu652Glnp.E652QO94875protein_codingdeleterious(0)probably_damaging(0.999)TCGA-A8-A081-01Breastbreast invasive carcinomaFemale>=65I/IIUnknownUnknownSD
SORBS2SNVMissense_Mutationc.481G>Cp.Glu161Glnp.E161QO94875protein_codingdeleterious(0)probably_damaging(0.999)TCGA-A8-A08L-01Breastbreast invasive carcinomaFemale>=65III/IVUnknownUnknownSD
SORBS2SNVMissense_Mutationnovelc.2567T>Cp.Ile856Thrp.I856TO94875protein_codingdeleterious(0)probably_damaging(0.999)TCGA-AN-A046-01Breastbreast invasive carcinomaFemale>=65I/IIUnknownUnknownSD
SORBS2SNVMissense_Mutationc.2435C>Tp.Ser812Leup.S812LO94875protein_codingtolerated(0.3)benign(0)TCGA-AN-A046-01Breastbreast invasive carcinomaFemale>=65I/IIUnknownUnknownSD
SORBS2SNVMissense_Mutationc.3505G>Ap.Asp1169Asnp.D1169NO94875protein_codingdeleterious(0.01)probably_damaging(0.925)TCGA-BH-A0DZ-01Breastbreast invasive carcinomaFemale<65I/IIChemotherapydocetaxelSD
SORBS2SNVMissense_Mutationc.1739N>Gp.Tyr580Cysp.Y580CO94875protein_codingdeleterious(0)probably_damaging(1)TCGA-D8-A1Y0-01Breastbreast invasive carcinomaFemale>=65III/IVChemotherapycyclophosphamide+methotrexatum+fluorouracillumSD
SORBS2SNVMissense_Mutationnovelc.290C>Tp.Ala97Valp.A97VO94875protein_codingtolerated(0.05)benign(0.279)TCGA-OL-A6VR-01Breastbreast invasive carcinomaFemale<65I/IIUnknownUnknownSD
SORBS2insertionFrame_Shift_Insnovelc.2542_2543insTGCCCCGCAGTGCCTCTTTCCAAGACGTGGACACAGCCAACAGCAGCp.Arg848MetfsTer44p.R848Mfs*44O94875protein_codingTCGA-A2-A0EQ-01Breastbreast invasive carcinomaFemale<65I/IIChemotherapyadriamycinSD
Page: 1 2 3 4 5 6 7 8 9 10 11 12 13 14 15 16 17 18 

Top

Related drugs of malignant transformation related genes

check buttonIdentification of chemicals and drugs interact with genes involved in malignant transfromation
(DGIdb 4.0)
Entrez IDSymbolCategoryInteraction TypesDrug Claim NameDrug NamePMIDs
Page: 1