
|
|||||
|
 | |
| |
| |
| |
| |
| |
|
Gene: SORBS1 |
Gene summary for SORBS1 |
| Gene information | Species | Human | Gene symbol | SORBS1 | Gene ID | 10580 |
| Gene name | sorbin and SH3 domain containing 1 | |
| Gene Alias | CAP | |
| Cytomap | 10q24.1 | |
| Gene Type | protein-coding | GO ID | GO:0000271 | UniProtAcc | Q9BX66 |
Top |
Malignant transformation analysis |
| Identification of the aberrant gene expression in precancerous and cancerous lesions by comparing the gene expression of stem-like cells in diseased tissues with normal stem cells |
| Entrez ID | Symbol | Replicates | Species | Organ | Tissue | Adj P-value | Log2FC | Malignancy |
| 10580 | SORBS1 | HTA11_3410_2000001011 | Human | Colorectum | AD | 5.37e-03 | -3.21e-01 | 0.0155 |
| 10580 | SORBS1 | HTA11_866_3004761011 | Human | Colorectum | AD | 8.51e-03 | 3.61e-01 | 0.096 |
| 10580 | SORBS1 | HTA11_99999971662_82457 | Human | Colorectum | MSS | 2.23e-20 | 1.24e+00 | 0.3859 |
| 10580 | SORBS1 | HTA11_99999973899_84307 | Human | Colorectum | MSS | 9.34e-10 | 8.81e-01 | 0.2585 |
| 10580 | SORBS1 | A001-C-207 | Human | Colorectum | FAP | 3.94e-02 | -2.92e-01 | 0.1278 |
| 10580 | SORBS1 | A015-C-203 | Human | Colorectum | FAP | 3.26e-08 | -2.33e-02 | -0.1294 |
| 10580 | SORBS1 | A002-C-201 | Human | Colorectum | FAP | 1.40e-06 | -3.52e-01 | 0.0324 |
| 10580 | SORBS1 | A002-C-203 | Human | Colorectum | FAP | 2.17e-09 | -3.64e-01 | 0.2786 |
| 10580 | SORBS1 | A001-C-108 | Human | Colorectum | FAP | 8.19e-08 | -2.84e-01 | -0.0272 |
| 10580 | SORBS1 | A002-C-205 | Human | Colorectum | FAP | 2.81e-08 | -2.49e-01 | -0.1236 |
| 10580 | SORBS1 | A015-C-006 | Human | Colorectum | FAP | 1.46e-07 | -4.19e-01 | -0.0994 |
| 10580 | SORBS1 | A015-C-106 | Human | Colorectum | FAP | 4.37e-03 | -1.48e-01 | -0.0511 |
| 10580 | SORBS1 | A002-C-114 | Human | Colorectum | FAP | 4.22e-08 | -3.78e-01 | -0.1561 |
| 10580 | SORBS1 | A015-C-104 | Human | Colorectum | FAP | 1.91e-12 | -2.35e-01 | -0.1899 |
| 10580 | SORBS1 | A001-C-014 | Human | Colorectum | FAP | 2.35e-05 | -2.34e-01 | 0.0135 |
| 10580 | SORBS1 | A002-C-016 | Human | Colorectum | FAP | 2.40e-11 | -2.83e-01 | 0.0521 |
| 10580 | SORBS1 | A015-C-002 | Human | Colorectum | FAP | 2.11e-04 | -3.50e-01 | -0.0763 |
| 10580 | SORBS1 | A001-C-203 | Human | Colorectum | FAP | 3.27e-02 | 2.59e-02 | -0.0481 |
| 10580 | SORBS1 | A002-C-116 | Human | Colorectum | FAP | 3.83e-15 | -2.54e-01 | -0.0452 |
| 10580 | SORBS1 | A014-C-008 | Human | Colorectum | FAP | 7.90e-03 | -1.60e-01 | -0.191 |
| Page: 1 2 3 4 |
| Tissue | Expression Dynamics | Abbreviation |
| Colorectum (GSE201348) |  | FAP: Familial adenomatous polyposis |
| CRC: Colorectal cancer | ||
| Colorectum (HTA11) |  | AD: Adenomas |
| SER: Sessile serrated lesions | ||
| MSI-H: Microsatellite-high colorectal cancer | ||
| MSS: Microsatellite stable colorectal cancer | ||
| Endometrium | 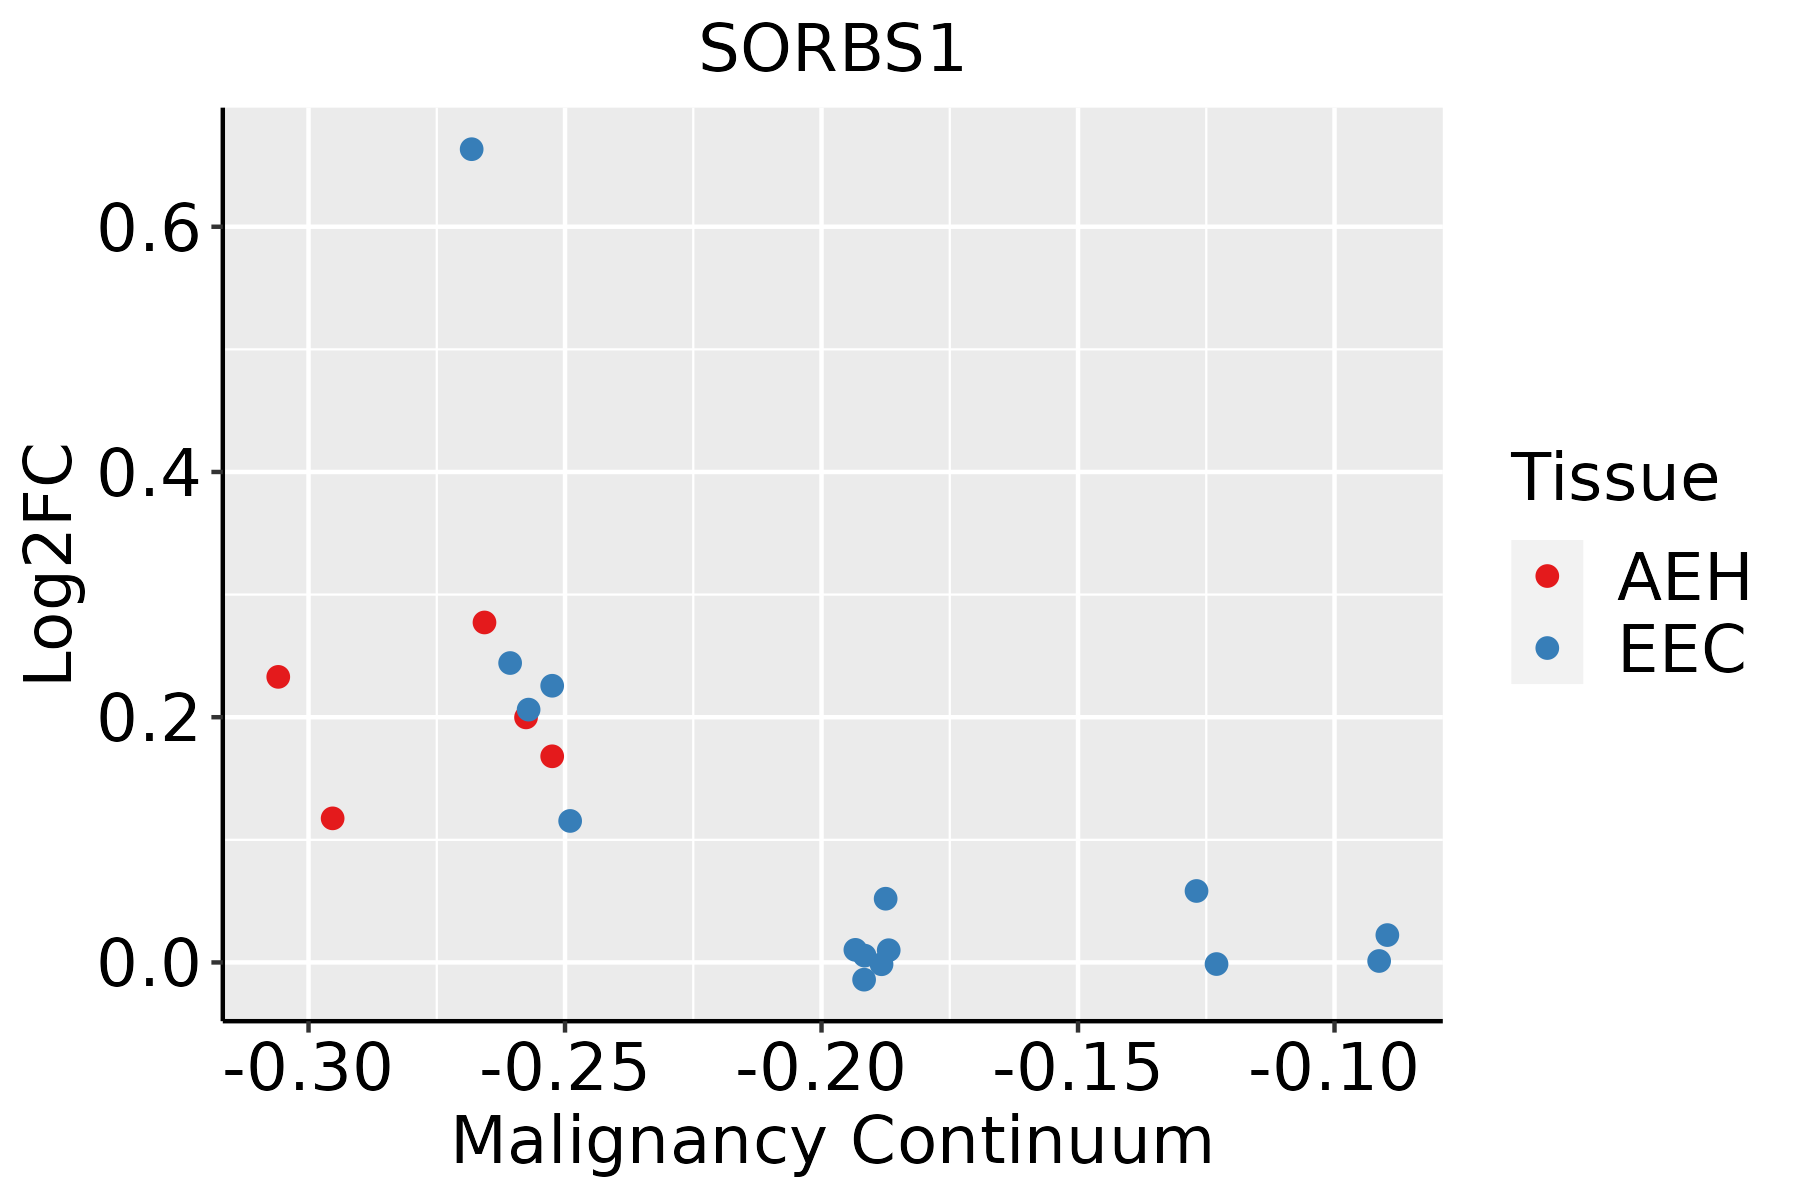 | AEH: Atypical endometrial hyperplasia |
| EEC: Endometrioid Cancer | ||
| Esophagus |  | ESCC: Esophageal squamous cell carcinoma |
| HGIN: High-grade intraepithelial neoplasias | ||
| LGIN: Low-grade intraepithelial neoplasias | ||
| Liver | 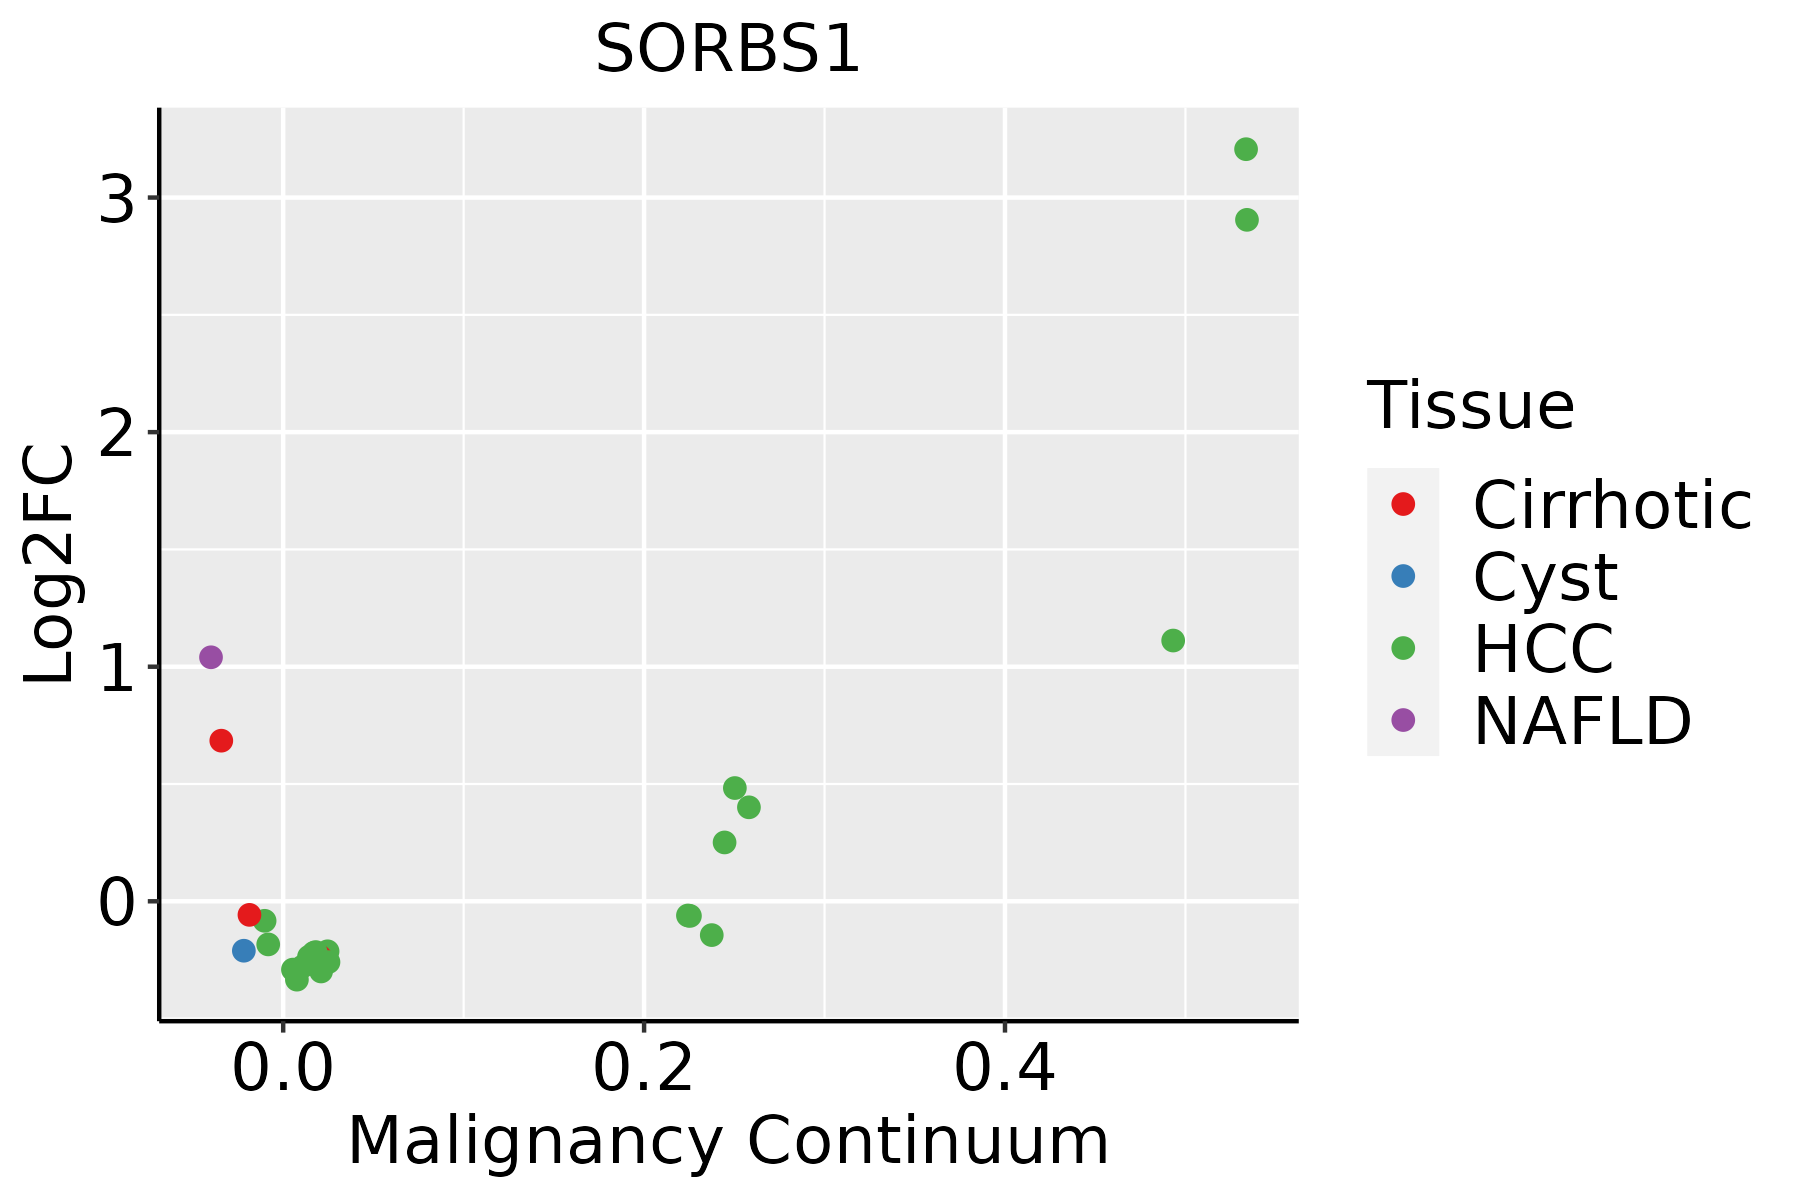 | HCC: Hepatocellular carcinoma |
| NAFLD: Non-alcoholic fatty liver disease | ||
| Lung | 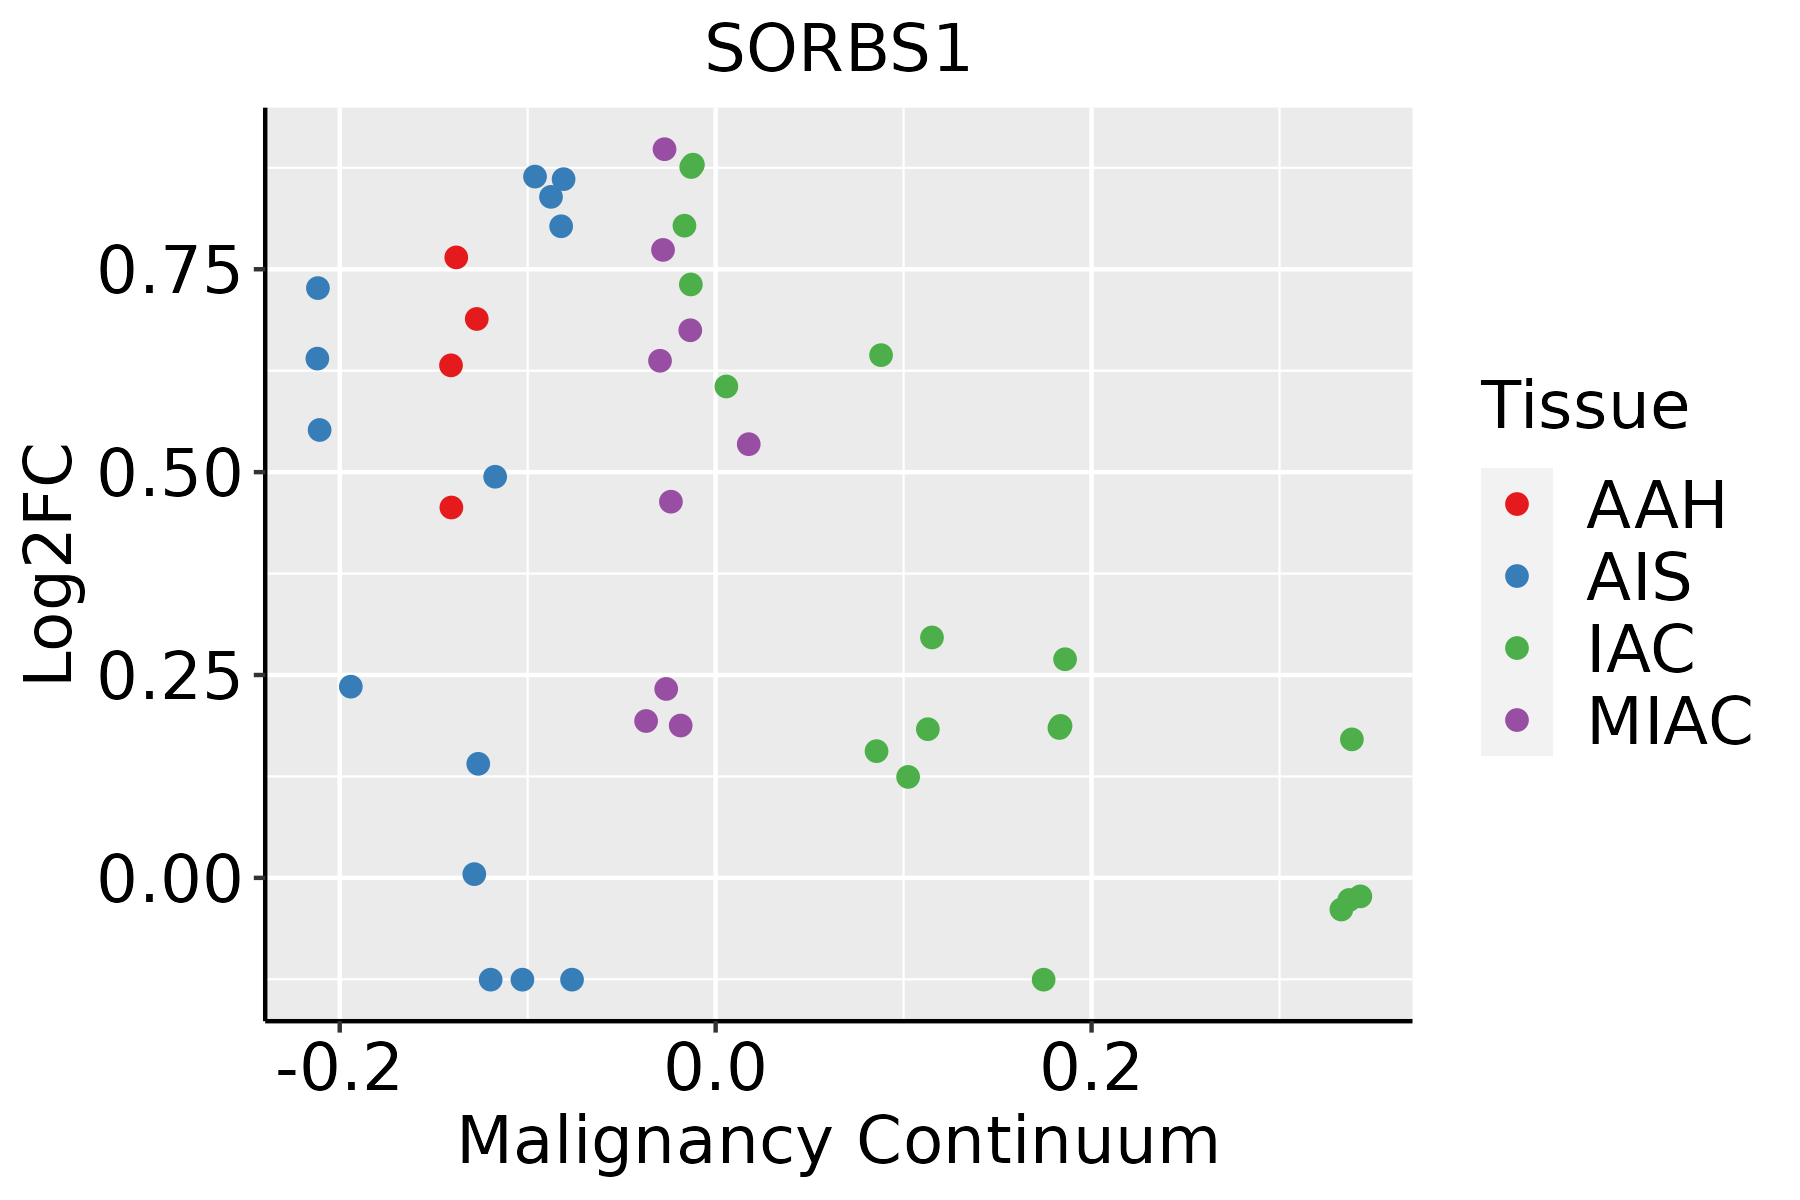 | AAH: Atypical adenomatous hyperplasia |
| AIS: Adenocarcinoma in situ | ||
| IAC: Invasive lung adenocarcinoma | ||
| MIA: Minimally invasive adenocarcinoma | ||
| Prostate | 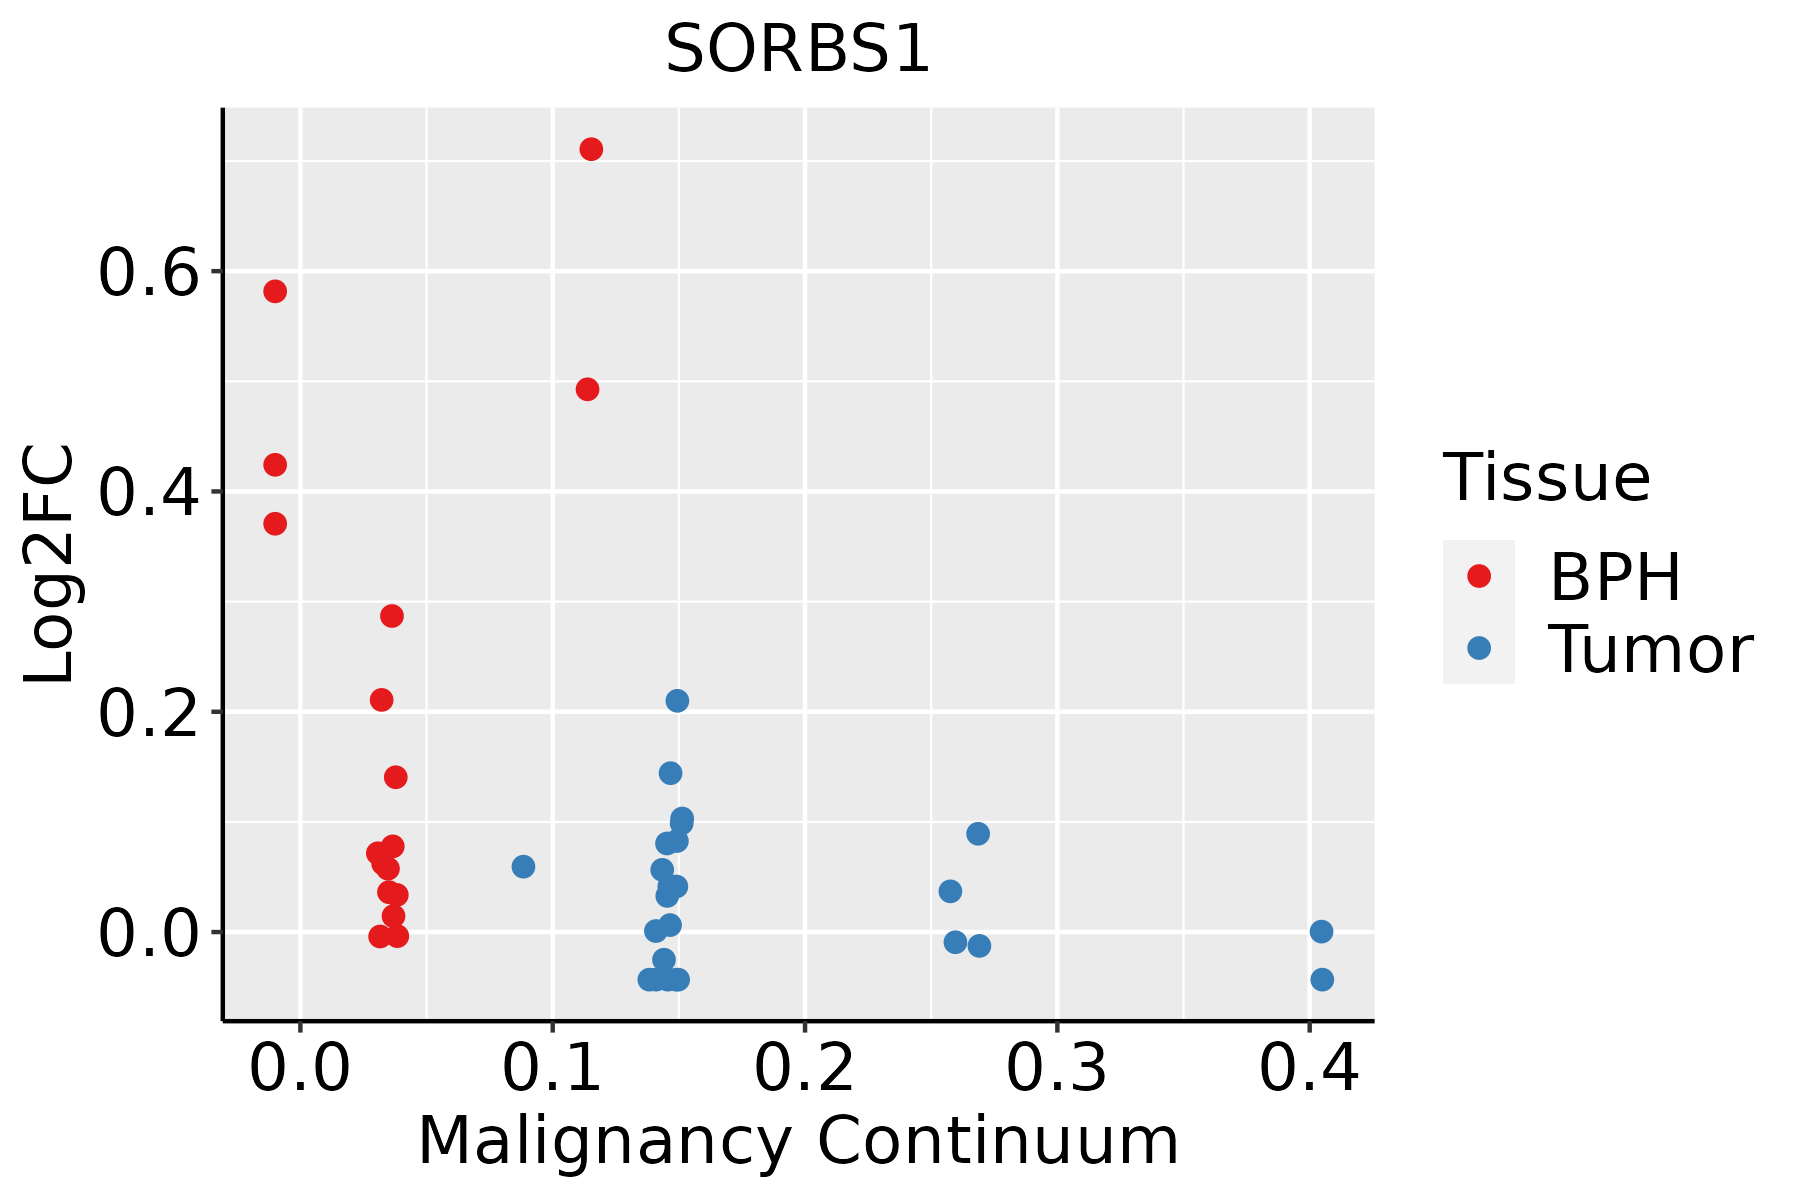 | BPH: Benign Prostatic Hyperplasia |
| ∗log2FC in expression of this searched gene in stem-like cells from each diseased tissue sample relative to stem-like cells in normal samples in each tissue plotted against the malignancy continuum. Samples are colored based on if they are from different disease stage. |
Top |
Malignant transformation related pathway analysis |
| Find out the enriched GO biological processes and KEGG pathways involved in transition from healthy to precancer to cancer |
| Tissue | Disease Stage | Enriched GO biological Processes |
| Colorectum | AD |  |
| Colorectum | SER |  |
| Colorectum | MSS |  |
| Colorectum | MSI-H |  |
| Colorectum | FAP |  |
| ∗Top 15 enriched GO BP terms are showed in the bar plot of each disease state in each tissue. Each row represents a significant GO biological process which is colored according to the -log10(p.adjust). |
| Page: 1 2 3 4 5 6 7 8 9 |
| GO ID | Tissue | Disease Stage | Description | Gene Ratio | Bg Ratio | pvalue | p.adjust | Count |
| GO:0006091 | Colorectum | AD | generation of precursor metabolites and energy | 209/3918 | 490/18723 | 3.17e-28 | 6.61e-25 | 209 |
| GO:0015980 | Colorectum | AD | energy derivation by oxidation of organic compounds | 143/3918 | 318/18723 | 2.78e-22 | 2.49e-19 | 143 |
| GO:0072659 | Colorectum | AD | protein localization to plasma membrane | 122/3918 | 284/18723 | 2.86e-17 | 1.49e-14 | 122 |
| GO:0007015 | Colorectum | AD | actin filament organization | 167/3918 | 442/18723 | 1.65e-16 | 7.94e-14 | 167 |
| GO:1990778 | Colorectum | AD | protein localization to cell periphery | 129/3918 | 333/18723 | 5.51e-14 | 1.15e-11 | 129 |
| GO:1903829 | Colorectum | AD | positive regulation of cellular protein localization | 110/3918 | 276/18723 | 4.58e-13 | 8.44e-11 | 110 |
| GO:1905475 | Colorectum | AD | regulation of protein localization to membrane | 73/3918 | 175/18723 | 3.37e-10 | 2.93e-08 | 73 |
| GO:1903076 | Colorectum | AD | regulation of protein localization to plasma membrane | 48/3918 | 104/18723 | 7.17e-09 | 4.36e-07 | 48 |
| GO:1904375 | Colorectum | AD | regulation of protein localization to cell periphery | 54/3918 | 125/18723 | 1.52e-08 | 9.00e-07 | 54 |
| GO:0034329 | Colorectum | AD | cell junction assembly | 136/3918 | 420/18723 | 2.02e-08 | 1.15e-06 | 136 |
| GO:1905477 | Colorectum | AD | positive regulation of protein localization to membrane | 46/3918 | 106/18723 | 1.47e-07 | 6.64e-06 | 46 |
| GO:0032868 | Colorectum | AD | response to insulin | 91/3918 | 264/18723 | 2.02e-07 | 8.48e-06 | 91 |
| GO:0150115 | Colorectum | AD | cell-substrate junction organization | 44/3918 | 101/18723 | 2.38e-07 | 9.81e-06 | 44 |
| GO:0031589 | Colorectum | AD | cell-substrate adhesion | 116/3918 | 363/18723 | 4.68e-07 | 1.76e-05 | 116 |
| GO:0007044 | Colorectum | AD | cell-substrate junction assembly | 41/3918 | 95/18723 | 8.20e-07 | 2.85e-05 | 41 |
| GO:1901653 | Colorectum | AD | cellular response to peptide | 114/3918 | 359/18723 | 8.32e-07 | 2.88e-05 | 114 |
| GO:0032869 | Colorectum | AD | cellular response to insulin stimulus | 72/3918 | 203/18723 | 1.10e-06 | 3.68e-05 | 72 |
| GO:0061572 | Colorectum | AD | actin filament bundle organization | 60/3918 | 161/18723 | 1.33e-06 | 4.23e-05 | 60 |
| GO:0071375 | Colorectum | AD | cellular response to peptide hormone stimulus | 95/3918 | 290/18723 | 1.50e-06 | 4.66e-05 | 95 |
| GO:0043434 | Colorectum | AD | response to peptide hormone | 126/3918 | 414/18723 | 2.70e-06 | 7.86e-05 | 126 |
| Page: 1 2 3 4 5 6 7 8 9 10 11 12 13 14 15 16 17 18 19 20 21 22 23 24 25 26 27 28 |
| Pathway ID | Tissue | Disease Stage | Description | Gene Ratio | Bg Ratio | pvalue | p.adjust | qvalue | Count |
| hsa04520 | Colorectum | AD | Adherens junction | 50/2092 | 93/8465 | 1.52e-09 | 2.83e-08 | 1.81e-08 | 50 |
| hsa045201 | Colorectum | AD | Adherens junction | 50/2092 | 93/8465 | 1.52e-09 | 2.83e-08 | 1.81e-08 | 50 |
| hsa045204 | Colorectum | MSS | Adherens junction | 42/1875 | 93/8465 | 6.18e-07 | 9.01e-06 | 5.52e-06 | 42 |
| hsa04910 | Colorectum | MSS | Insulin signaling pathway | 43/1875 | 137/8465 | 7.37e-03 | 2.84e-02 | 1.74e-02 | 43 |
| hsa045205 | Colorectum | MSS | Adherens junction | 42/1875 | 93/8465 | 6.18e-07 | 9.01e-06 | 5.52e-06 | 42 |
| hsa049101 | Colorectum | MSS | Insulin signaling pathway | 43/1875 | 137/8465 | 7.37e-03 | 2.84e-02 | 1.74e-02 | 43 |
| hsa045208 | Colorectum | FAP | Adherens junction | 45/1404 | 93/8465 | 8.66e-13 | 2.89e-10 | 1.76e-10 | 45 |
| hsa049102 | Colorectum | FAP | Insulin signaling pathway | 36/1404 | 137/8465 | 2.51e-03 | 1.18e-02 | 7.18e-03 | 36 |
| hsa045209 | Colorectum | FAP | Adherens junction | 45/1404 | 93/8465 | 8.66e-13 | 2.89e-10 | 1.76e-10 | 45 |
| hsa049103 | Colorectum | FAP | Insulin signaling pathway | 36/1404 | 137/8465 | 2.51e-03 | 1.18e-02 | 7.18e-03 | 36 |
| hsa0452010 | Colorectum | CRC | Adherens junction | 37/1091 | 93/8465 | 5.72e-11 | 6.37e-09 | 4.32e-09 | 37 |
| hsa0452011 | Colorectum | CRC | Adherens junction | 37/1091 | 93/8465 | 5.72e-11 | 6.37e-09 | 4.32e-09 | 37 |
| hsa0452025 | Endometrium | AEH | Adherens junction | 36/1197 | 93/8465 | 3.49e-09 | 5.98e-08 | 4.37e-08 | 36 |
| hsa04520111 | Endometrium | AEH | Adherens junction | 36/1197 | 93/8465 | 3.49e-09 | 5.98e-08 | 4.37e-08 | 36 |
| hsa0452026 | Endometrium | EEC | Adherens junction | 36/1237 | 93/8465 | 8.57e-09 | 1.48e-07 | 1.11e-07 | 36 |
| hsa0452035 | Endometrium | EEC | Adherens junction | 36/1237 | 93/8465 | 8.57e-09 | 1.48e-07 | 1.11e-07 | 36 |
| hsa0452030 | Esophagus | ESCC | Adherens junction | 69/4205 | 93/8465 | 1.08e-06 | 6.83e-06 | 3.50e-06 | 69 |
| hsa049109 | Esophagus | ESCC | Insulin signaling pathway | 89/4205 | 137/8465 | 1.97e-04 | 7.32e-04 | 3.75e-04 | 89 |
| hsa04520114 | Esophagus | ESCC | Adherens junction | 69/4205 | 93/8465 | 1.08e-06 | 6.83e-06 | 3.50e-06 | 69 |
| hsa0491014 | Esophagus | ESCC | Insulin signaling pathway | 89/4205 | 137/8465 | 1.97e-04 | 7.32e-04 | 3.75e-04 | 89 |
| Page: 1 2 3 |
Top |
Cell-cell communication analysis |
| Identification of potential cell-cell interactions between two cell types and their ligand-receptor pairs for different disease states |
| Ligand | Receptor | LRpair | Pathway | Tissue | Disease Stage |
| Page: 1 |
Top |
Single-cell gene regulatory network inference analysis |
| Find out the significant the regulons (TFs) and the target genes of each regulon across cell types for different disease states |
| TF | Cell Type | Tissue | Disease Stage | Target Gene | RSS | Regulon Activity |
| ∗The dot plots of a searched regulon are shown for all cell subpopulations in each disease state of each tissue based on the regulon specific score inferred using pySCENIC and by calculating the average expression. |
| Page: 1 |
Top |
Somatic mutation of malignant transformation related genes |
| Annotation of somatic variants for genes involved in malignant transformation |
| Hugo Symbol | Variant Class | Variant Classification | dbSNP RS | HGVSc | HGVSp | HGVSp Short | SWISSPROT | BIOTYPE | SIFT | PolyPhen | Tumor Sample Barcode | Tissue | Histology | Sex | Age | Stage | Therapy Types | Drugs | Outcome |
| SORBS1 | SNV | Missense_Mutation | c.1105N>G | p.Ser369Gly | p.S369G | Q9BX66 | protein_coding | tolerated_low_confidence(0.05) | probably_damaging(0.981) | TCGA-A8-A08F-01 | Breast | breast invasive carcinoma | Female | <65 | III/IV | Chemotherapy | 5-fluorouracil | CR | |
| SORBS1 | SNV | Missense_Mutation | c.2548C>G | p.Leu850Val | p.L850V | Q9BX66 | protein_coding | deleterious(0.03) | benign(0.127) | TCGA-AC-A23H-01 | Breast | breast invasive carcinoma | Female | >=65 | I/II | Unknown | Unknown | PD | |
| SORBS1 | SNV | Missense_Mutation | rs764678128 | c.3127N>T | p.Arg1043Cys | p.R1043C | Q9BX66 | protein_coding | tolerated_low_confidence(0.17) | benign(0.232) | TCGA-AN-A046-01 | Breast | breast invasive carcinoma | Female | >=65 | I/II | Unknown | Unknown | SD |
| SORBS1 | SNV | Missense_Mutation | c.1558N>A | p.Asp520Asn | p.D520N | Q9BX66 | protein_coding | deleterious(0) | probably_damaging(0.999) | TCGA-BH-A0B4-01 | Breast | breast invasive carcinoma | Male | >=65 | III/IV | Hormone Therapy | tamoxiphen | SD | |
| SORBS1 | SNV | Missense_Mutation | c.1177N>A | p.Asp393Asn | p.D393N | Q9BX66 | protein_coding | deleterious(0) | probably_damaging(1) | TCGA-C8-A132-01 | Breast | breast invasive carcinoma | Female | <65 | I/II | Unknown | Unknown | SD | |
| SORBS1 | SNV | Missense_Mutation | rs542297924 | c.995N>T | p.Ser332Leu | p.S332L | Q9BX66 | protein_coding | deleterious_low_confidence(0.03) | benign(0.131) | TCGA-C8-A8HQ-01 | Breast | breast invasive carcinoma | Female | <65 | I/II | Unknown | Unknown | SD |
| SORBS1 | SNV | Missense_Mutation | c.2032N>A | p.Glu678Lys | p.E678K | Q9BX66 | protein_coding | deleterious(0) | probably_damaging(0.995) | TCGA-D8-A27G-01 | Breast | breast invasive carcinoma | Female | >=65 | I/II | Unknown | Unknown | SD | |
| SORBS1 | SNV | Missense_Mutation | c.2380N>A | p.Glu794Lys | p.E794K | Q9BX66 | protein_coding | deleterious(0.02) | possibly_damaging(0.613) | TCGA-EW-A1J5-01 | Breast | breast invasive carcinoma | Female | <65 | I/II | Chemotherapy | adriamycin | SD | |
| SORBS1 | SNV | Missense_Mutation | rs368416628 | c.3622N>T | p.Arg1208Trp | p.R1208W | Q9BX66 | protein_coding | tolerated_low_confidence(0.18) | benign(0.17) | TCGA-LL-A441-01 | Breast | breast invasive carcinoma | Female | <65 | I/II | Chemotherapy | taxotere | CR |
| SORBS1 | insertion | Frame_Shift_Ins | novel | c.548_549insAGTGACA | p.Gly184ValfsTer28 | p.G184Vfs*28 | Q9BX66 | protein_coding | TCGA-BH-A0H6-01 | Breast | breast invasive carcinoma | Female | >=65 | I/II | Unknown | Unknown | SD |
| Page: 1 2 3 4 5 6 7 8 9 10 11 12 13 14 |
Top |
Related drugs of malignant transformation related genes |
| Identification of chemicals and drugs interact with genes involved in malignant transfromation |
| (DGIdb 4.0) |
| Entrez ID | Symbol | Category | Interaction Types | Drug Claim Name | Drug Name | PMIDs |
| Page: 1 |

Copyright 2023-Present -The University of Texas Health Science Center at Houston |